C4.1.3—Random quadrat sampling

Random quadrat sampling explains how ecological evidence links organisms, resources and interactions to population size, distribution or community structure in a habitat.

Syllabus
First assessment 2025
Objective
C4.1.3
Level
SL

Exam analysis

Chance of appearing2%of analysed past papers
Latest appearanceMay 2023
Most common paperPaper3
Typical marks2–3

Common command terms

  • Outline
  • Distinguish
  • Determine
  • Describe

Scoring notes

Common mistake
Confusing a population with a community or with all organisms in an ecosystem.

Recent exam appearances

May 2023Paper3 ["SL"] · TZ113(c)[ 3 ]C4.1.3—Random quadrat sampling
May 2014Paper3 ["SL"] · TZ220(c)[ 2 ]C4.1.3—Random quadrat sampling
May 2014Paper3 ["SL"] · TZ120[ 2 ]C4.1.3—Random quadrat sampling
Practice this objective

Coverage 2014–2023 · Updated 16 Jul 2026

Random quadrats reduce placement bias

Random quadrat sampling estimates abundance of sessile plants or animals whose individuals can be counted within a known area.

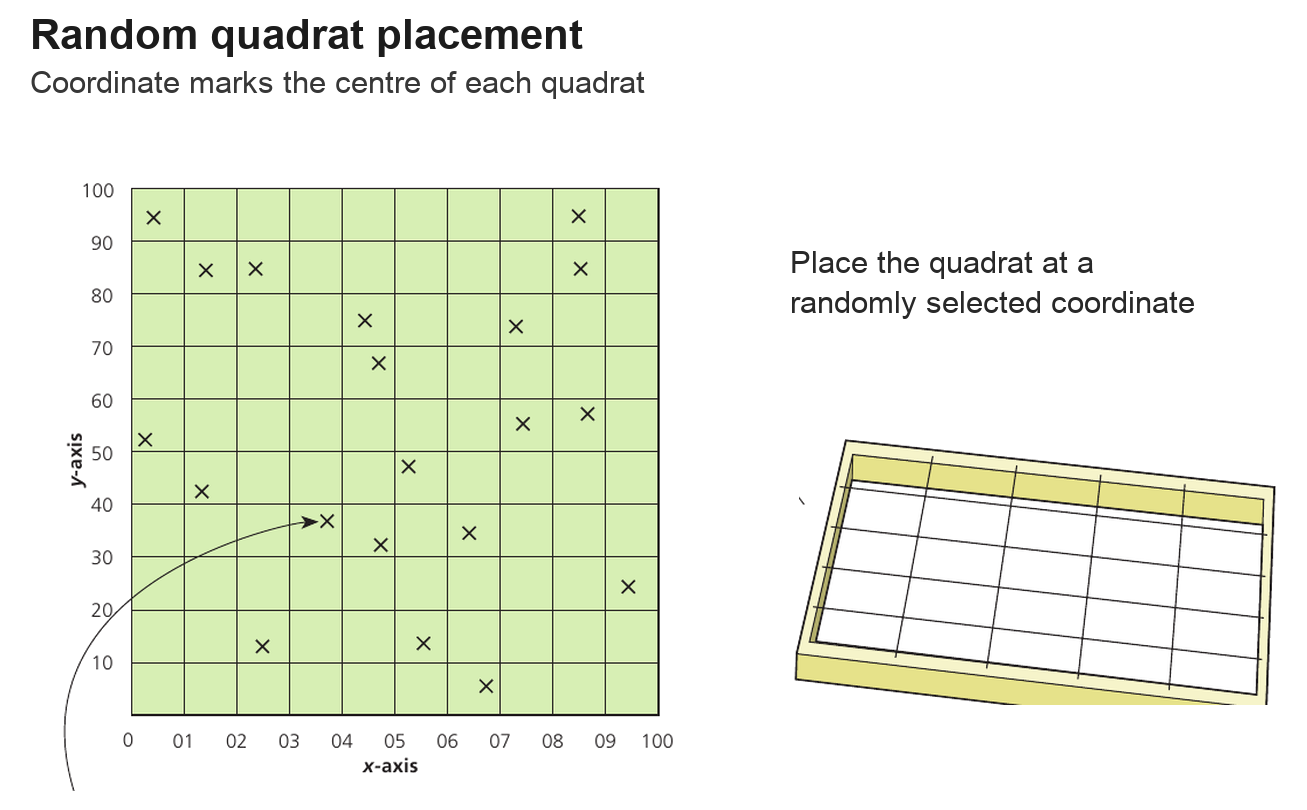
Map the study area, generate random coordinates, place equal-area quadrats at those positions, count individuals using a consistent boundary rule, repeat many times, and scale the mean count per quadrat to the total habitat area.

Use a calculator to obtain the standard deviation of quadrat counts. A small standard deviation suggests counts are similar and distribution is relatively even; a large standard deviation suggests strong spatial variation or clumping.

If 1 m² quadrats average 4 plants and the habitat is 250 m², the estimated population is 4 × 250 = 1,000 plants; the standard deviation shows how variable the counts were around that mean.

Quadrats suit sessile organisms, not freely moving animals. Random placement does not guarantee representation if too few or poorly sized quadrats are used; the standard-deviation formula need not be memorized.
Random quadrat sampling

Assessment in practice

2 marks
How it is assessed

This objective is assessed through structured response, commonly using Outline / Distinguish / Determine.

Command terms

Outline / Distinguish / Determine / Describe

What earns marks

Build the answer around this relationship: Random quadrat sampling must be linked to the correct ecological unit, method or species interaction.

Watch for

Confusing a population with a community or with all organisms in an ecosystem.

Representative question

Question 1

[Maximum number: 3]

Describe a method that can be used to measure the diversity of herbaceous plants in one of the green areas at different distances from the main road.

Populations and Communities

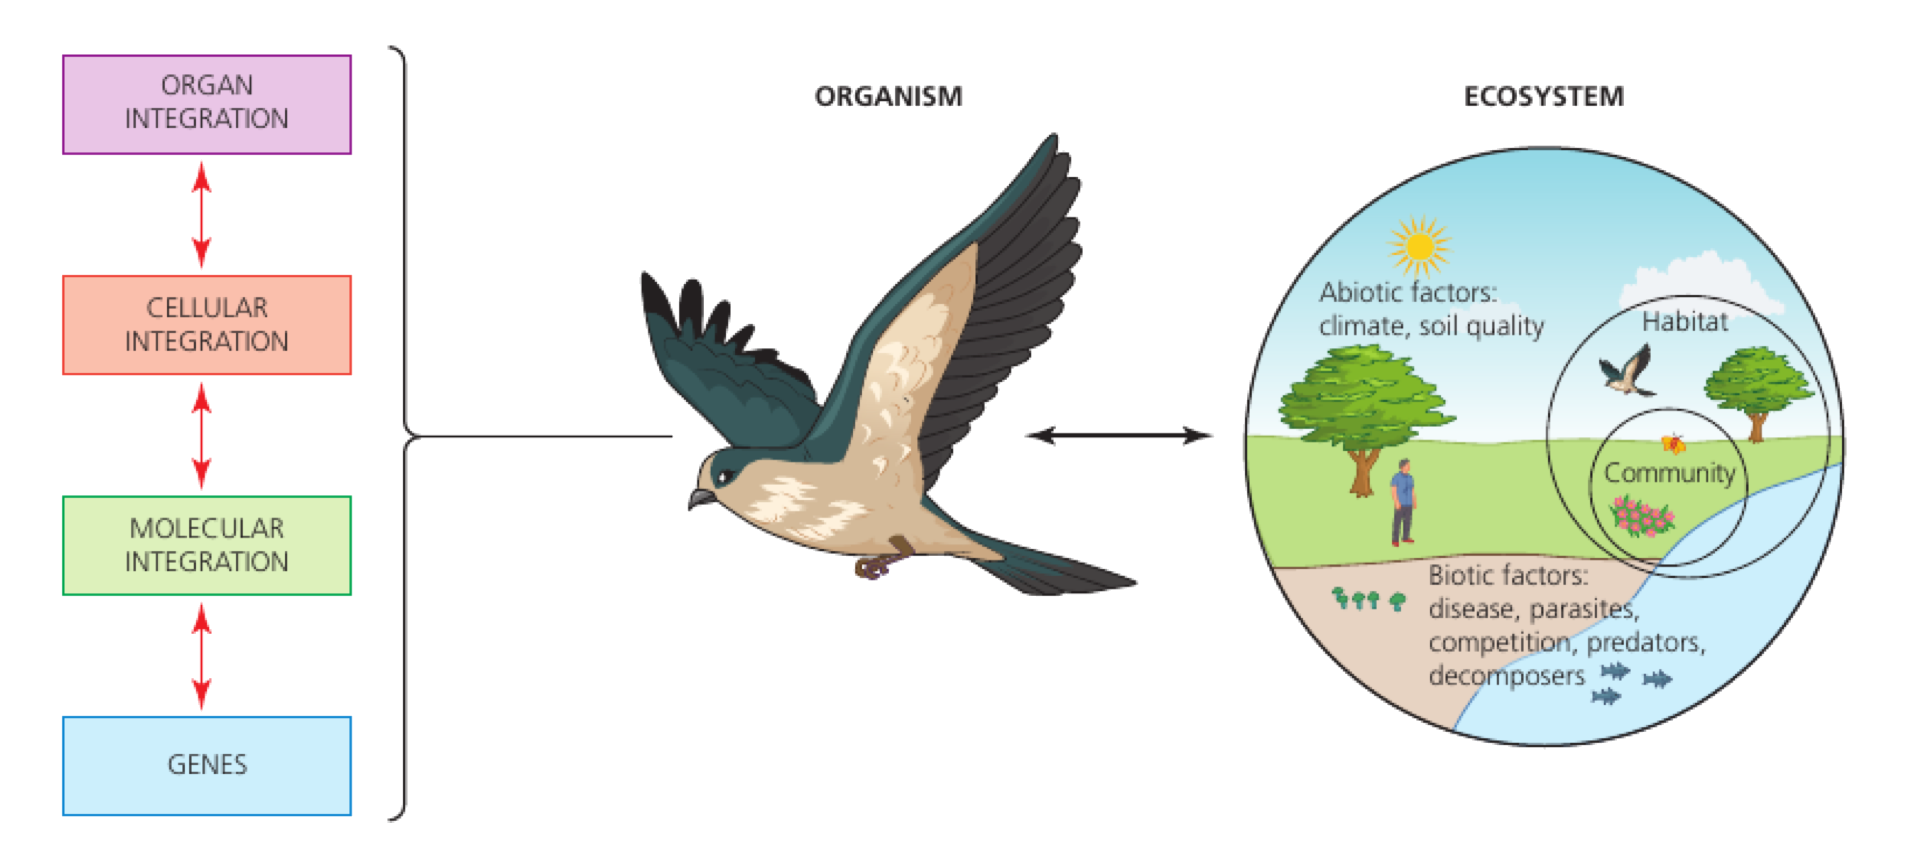
  • A population is one species in an area; a community is all interacting populations there.
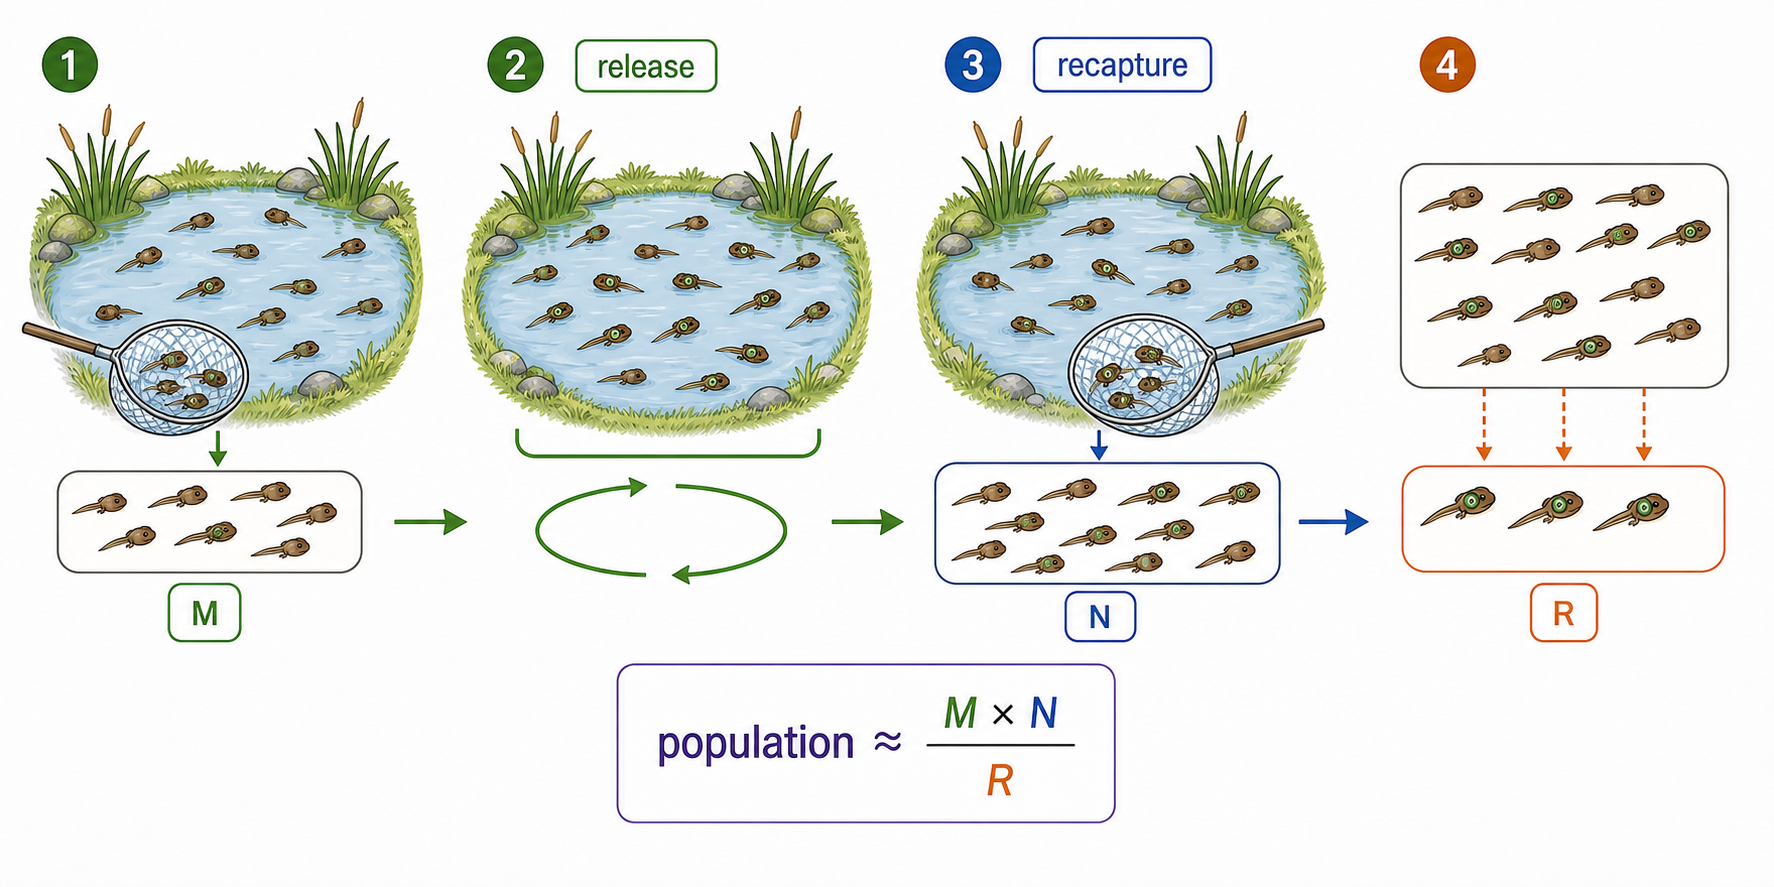
  • Estimate abundance with unbiased sampling: quadrats for sessile organisms and capture–mark–release–recapture for mobile animals, checking each method’s assumptions.
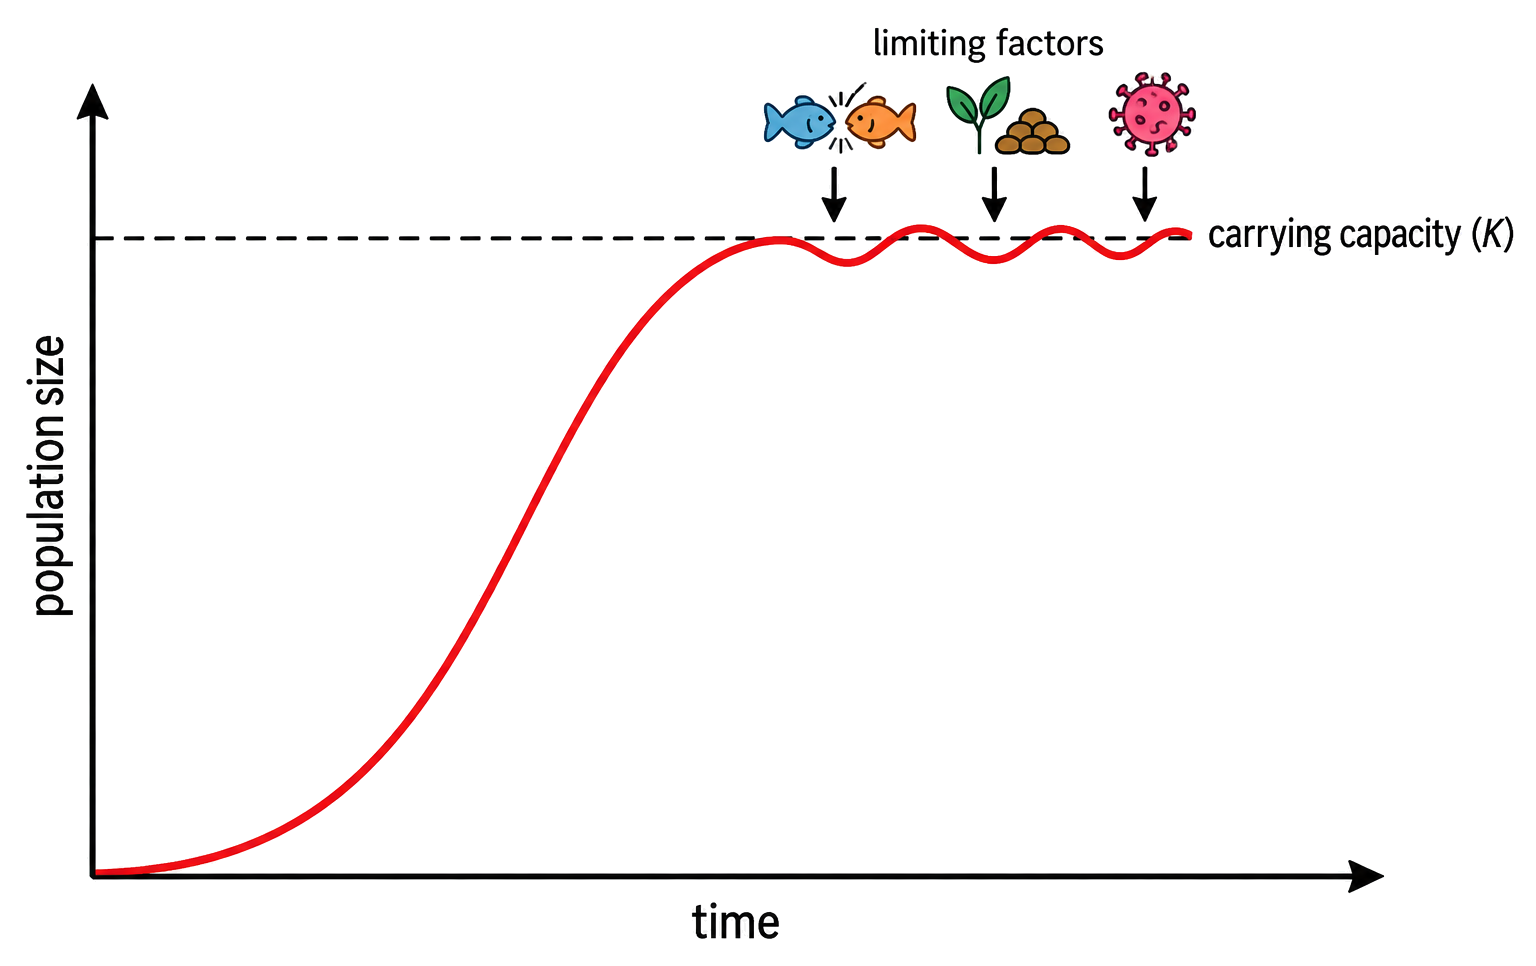
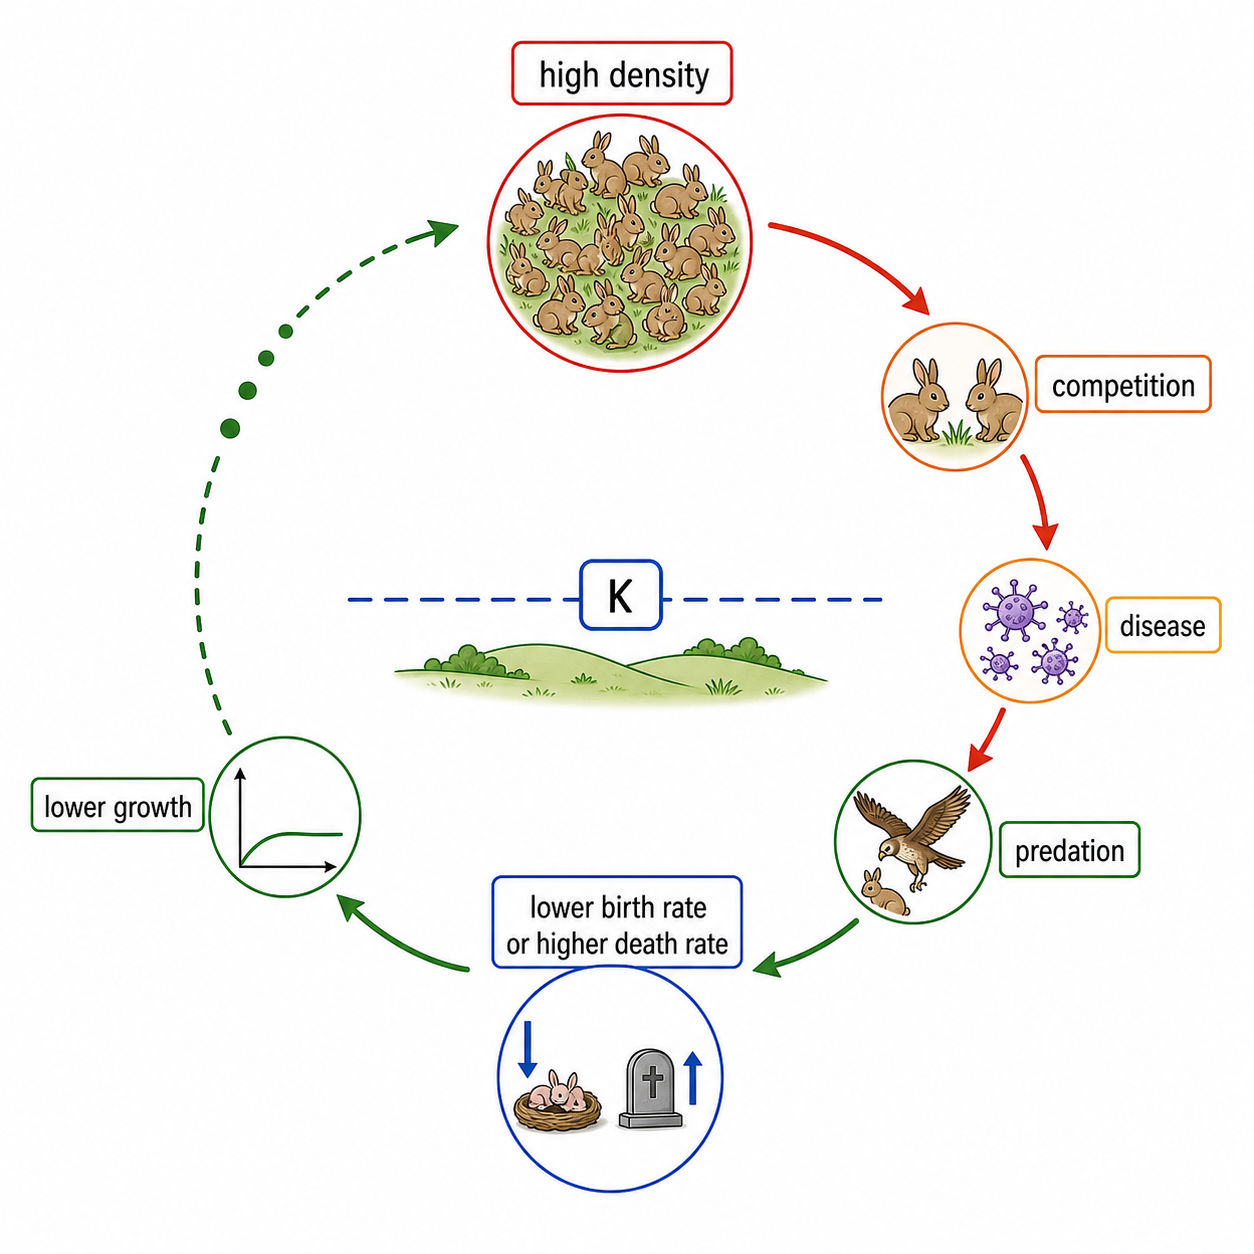
  • Density-dependent competition, predation, disease and waste create negative feedback around carrying capacity; exponential growth slows into a sigmoid curve as limits strengthen.
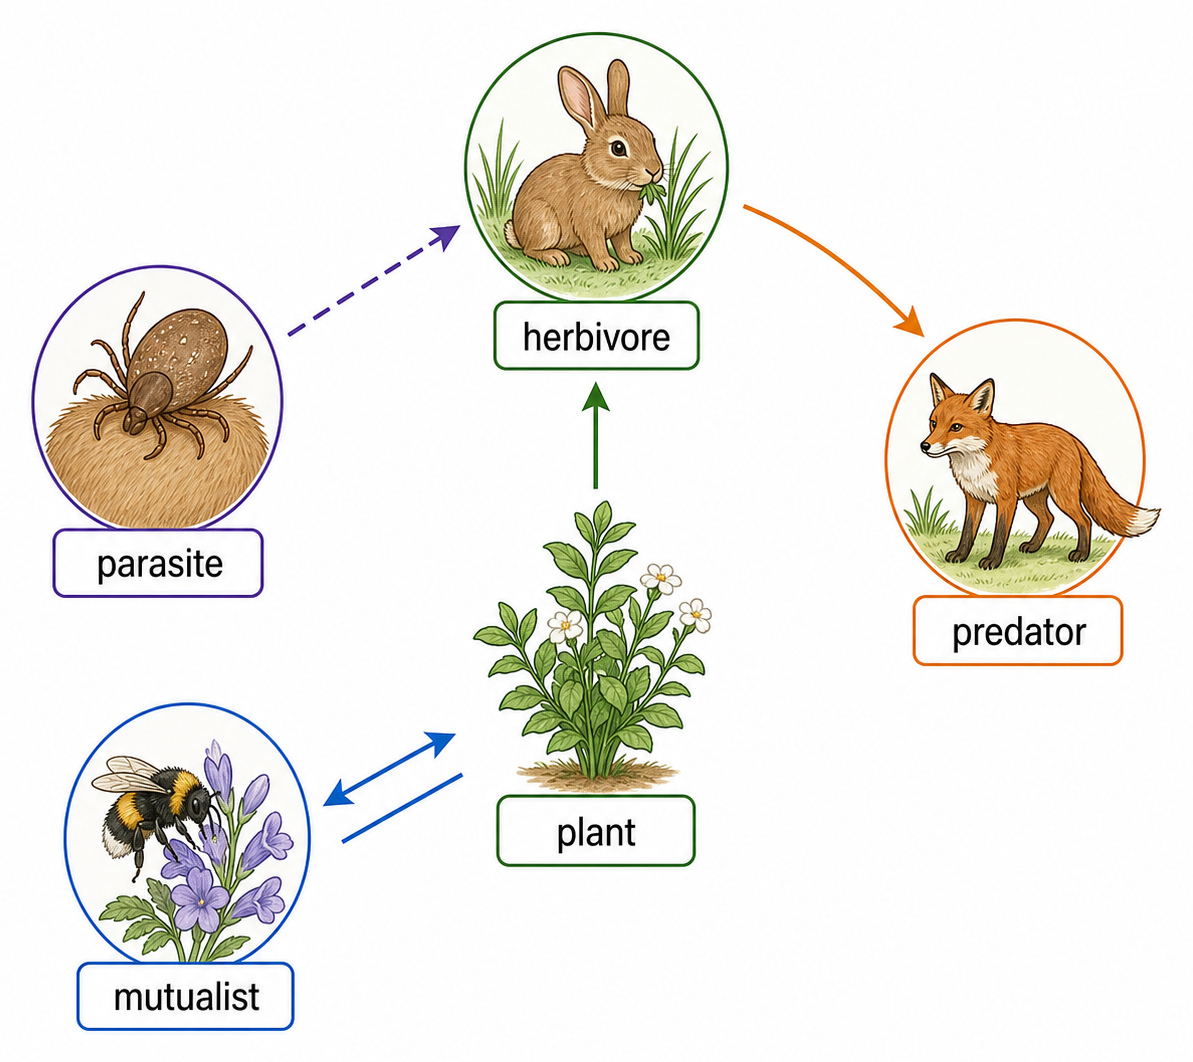
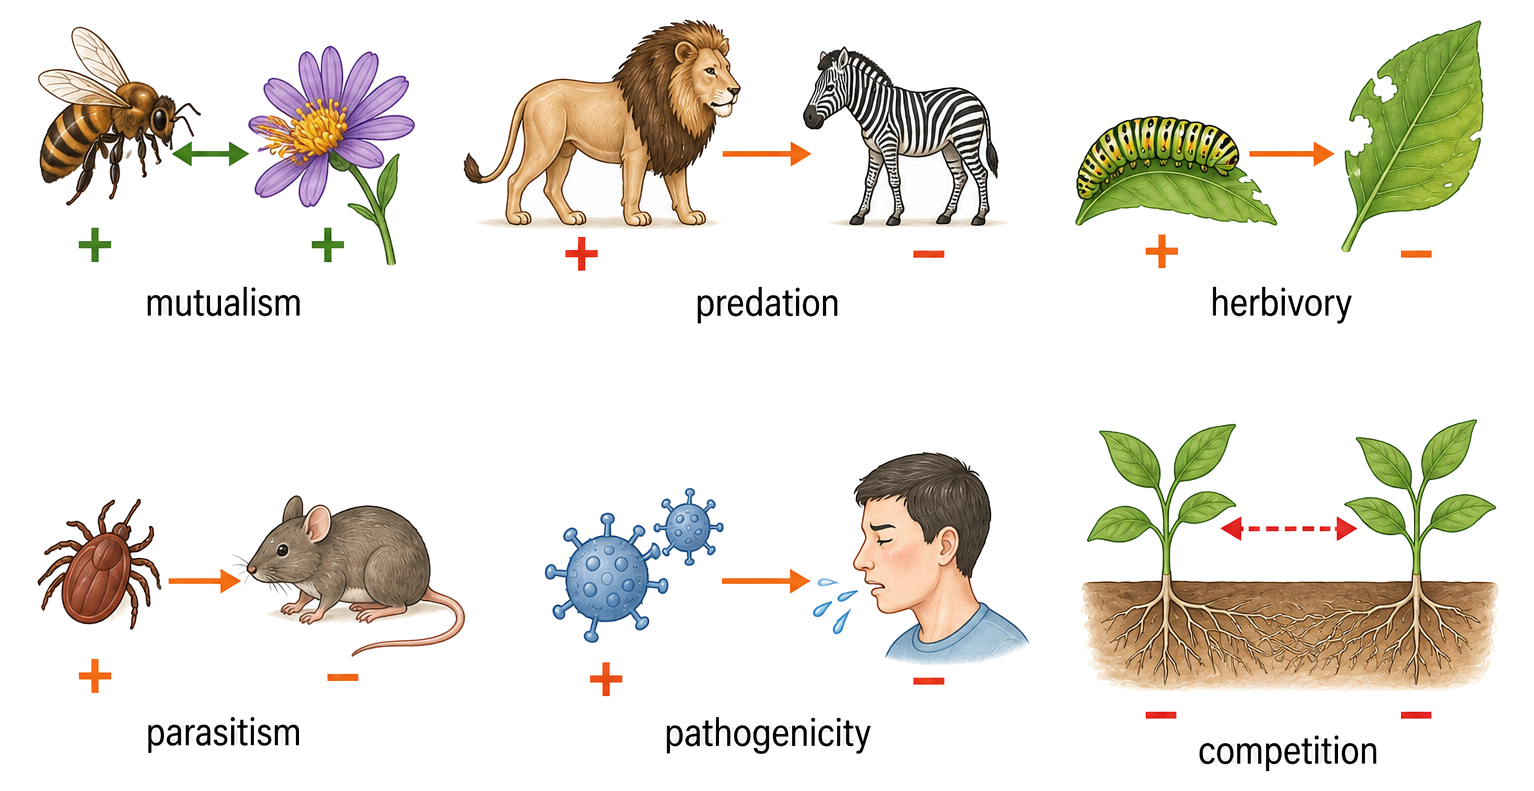
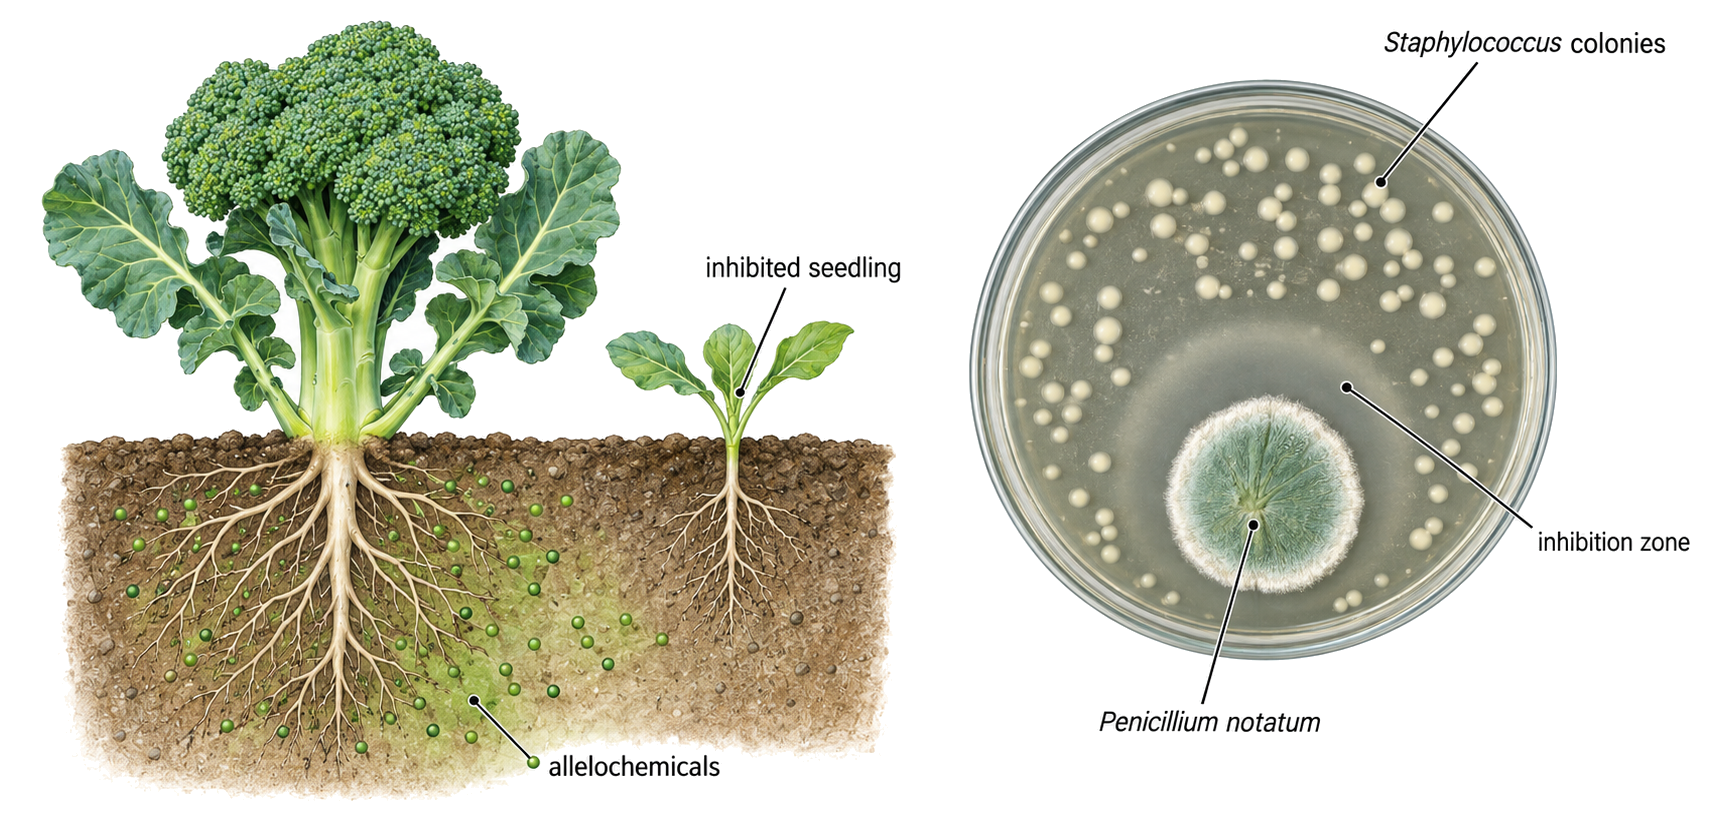
  • Classify interspecific relationships by costs and benefits: predation, herbivory, competition, mutualism, parasitism and pathogenicity.
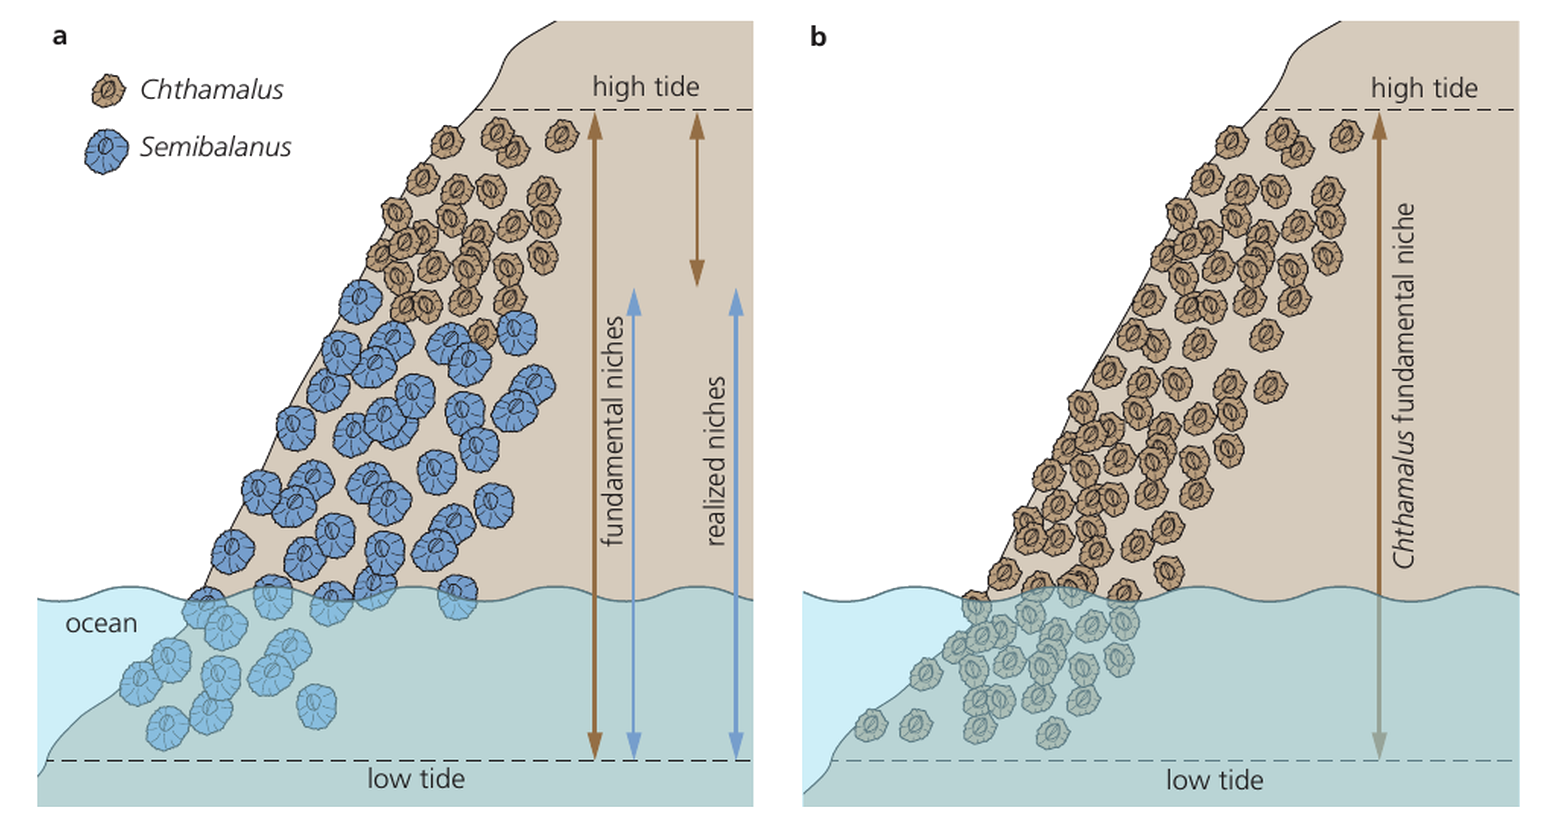
  • Invasive species may escape controls and displace endemic species. Removal experiments can reveal competition and fundamental versus realized niches.
  • Chi-squared tests assess species association from observed and expected quadrat counts.
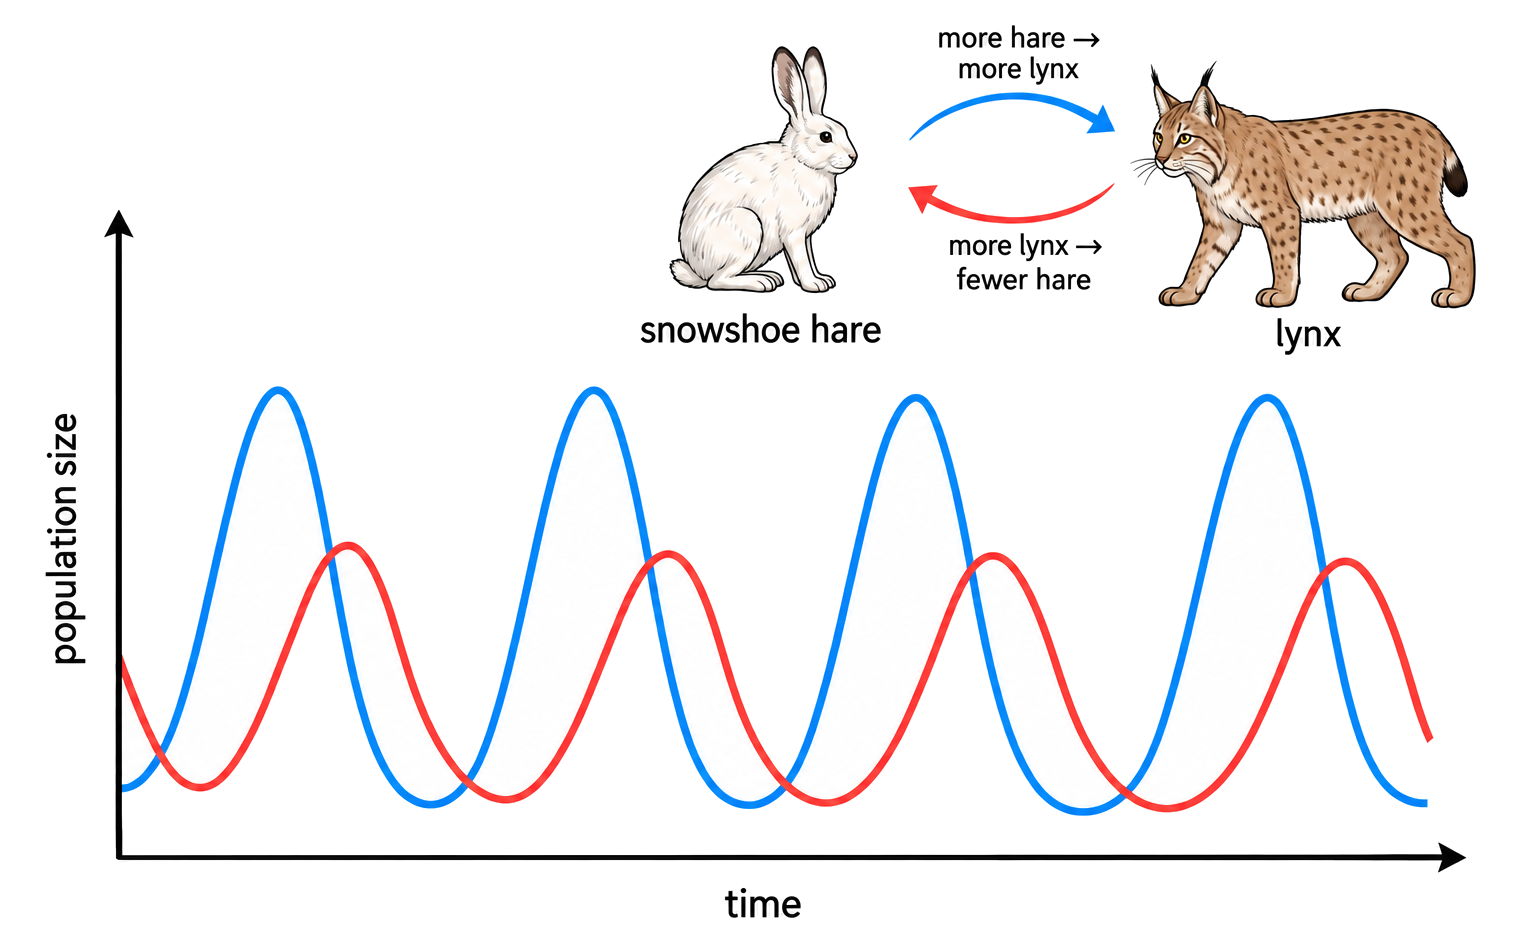
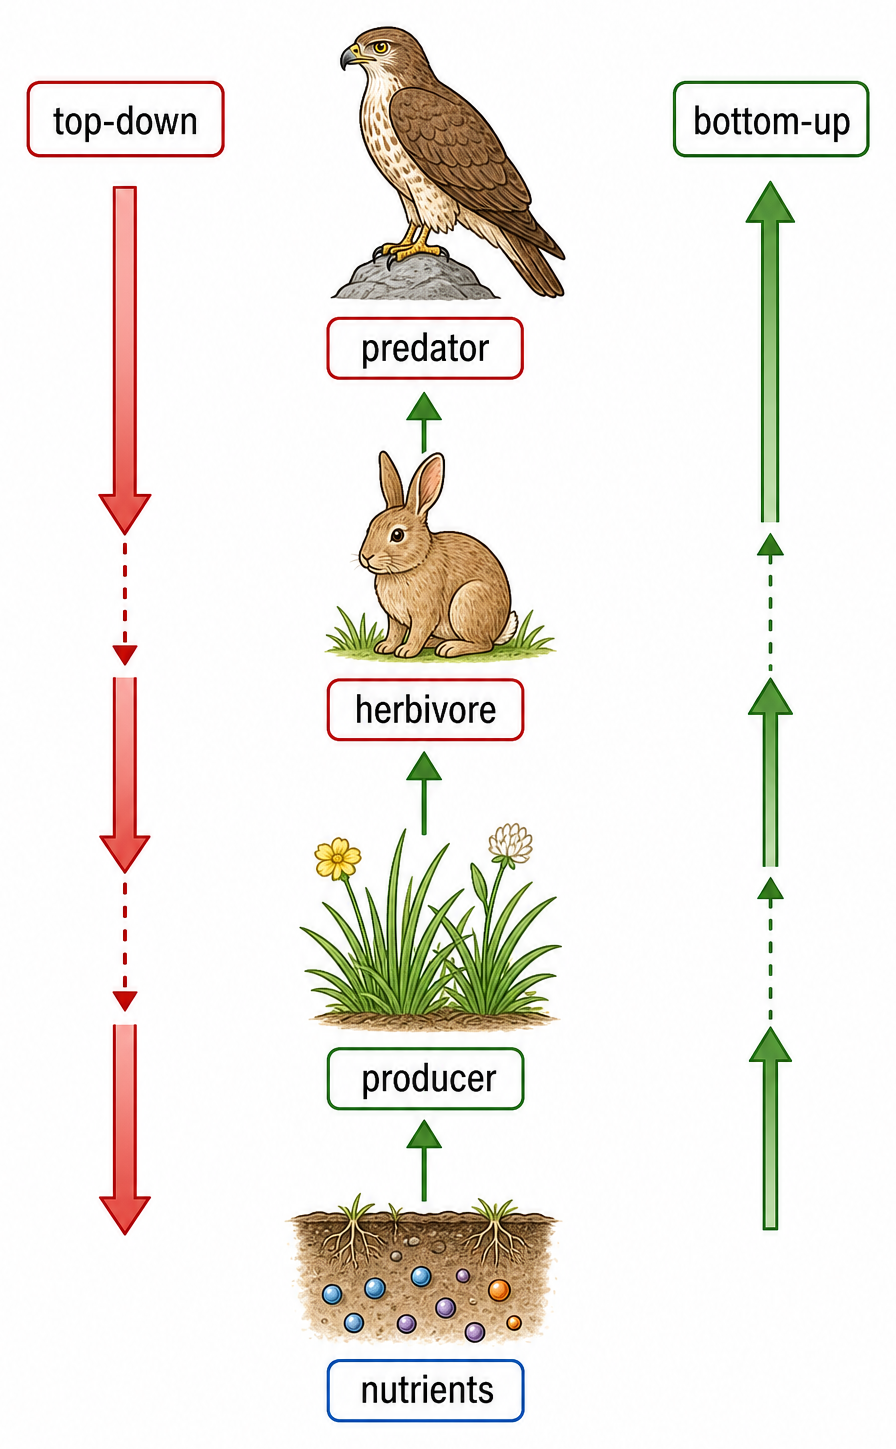
  • Predator peaks usually lag prey peaks; top-down control begins with consumers, while bottom-up control begins with resources or producers.

Concept essentials

  • Random quadrat sampling must be linked to the correct ecological unit, method or species interaction.
  • The evidence for random quadrat sampling depends on measurable abundance, distribution, survival or resource patterns.
  • Random quadrat sampling is clearest when cause, ecological process and population outcome are kept distinct.
  • Field or graph evidence for random quadrat sampling needs biological interpretation, not values alone.