EduNinja
[Maximum number: 2]

The Bengal Tiger, Panthera tigris tigris, is an endangered mammalian species of Southern Asia. It lives mostly in a forest habitat.

Fig.1.1 shows a Bengal Tiger.
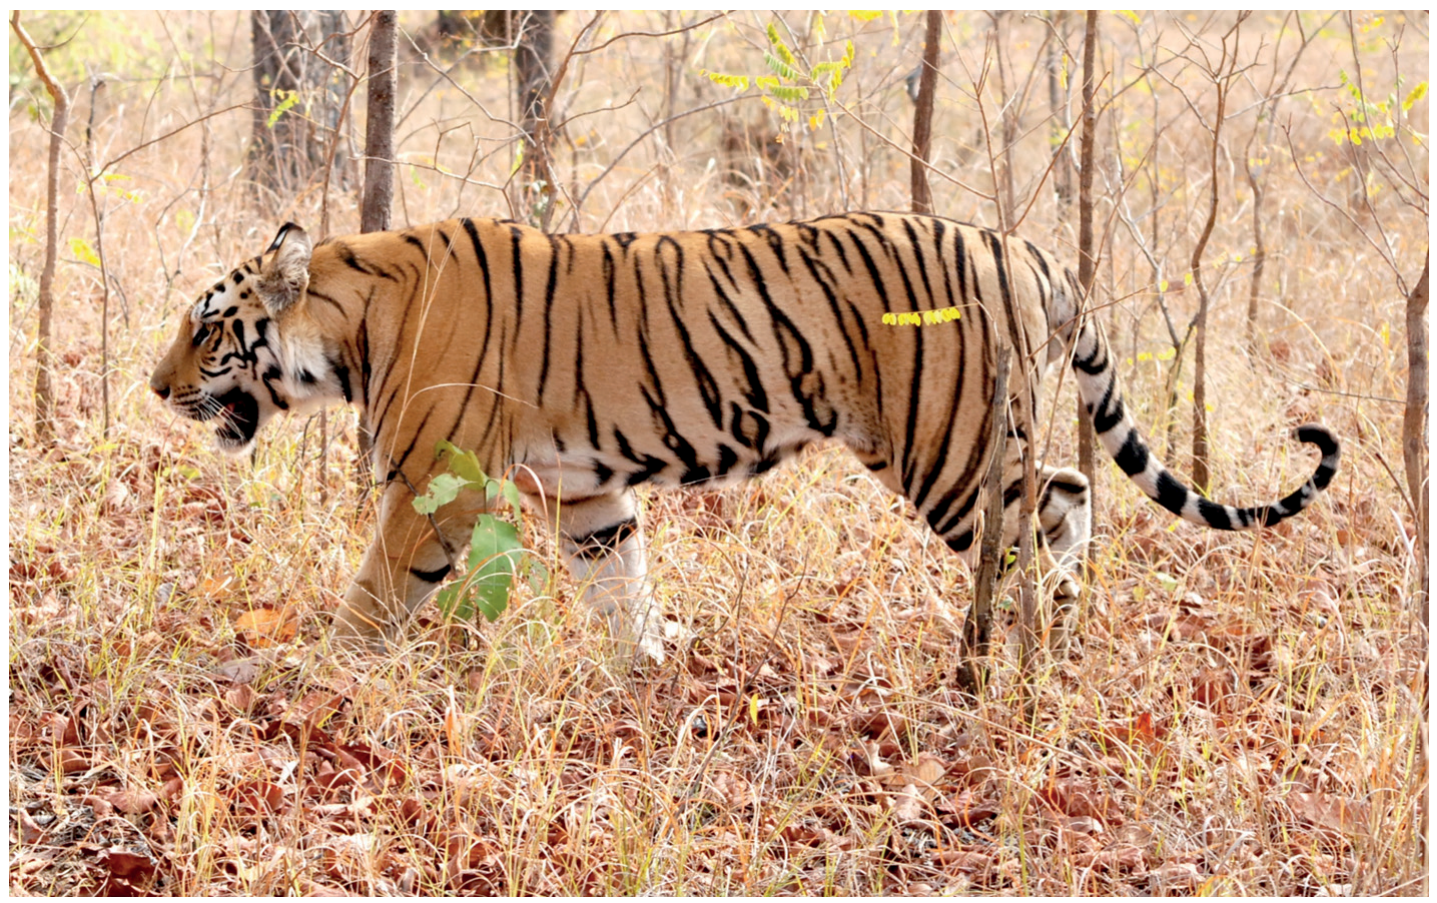
Fig. 1.1

Fig. 1.1

(a)

Table 1.1 shows the relationship between available forest habitat and Bengal Tiger numbers between 1970 and 2010.
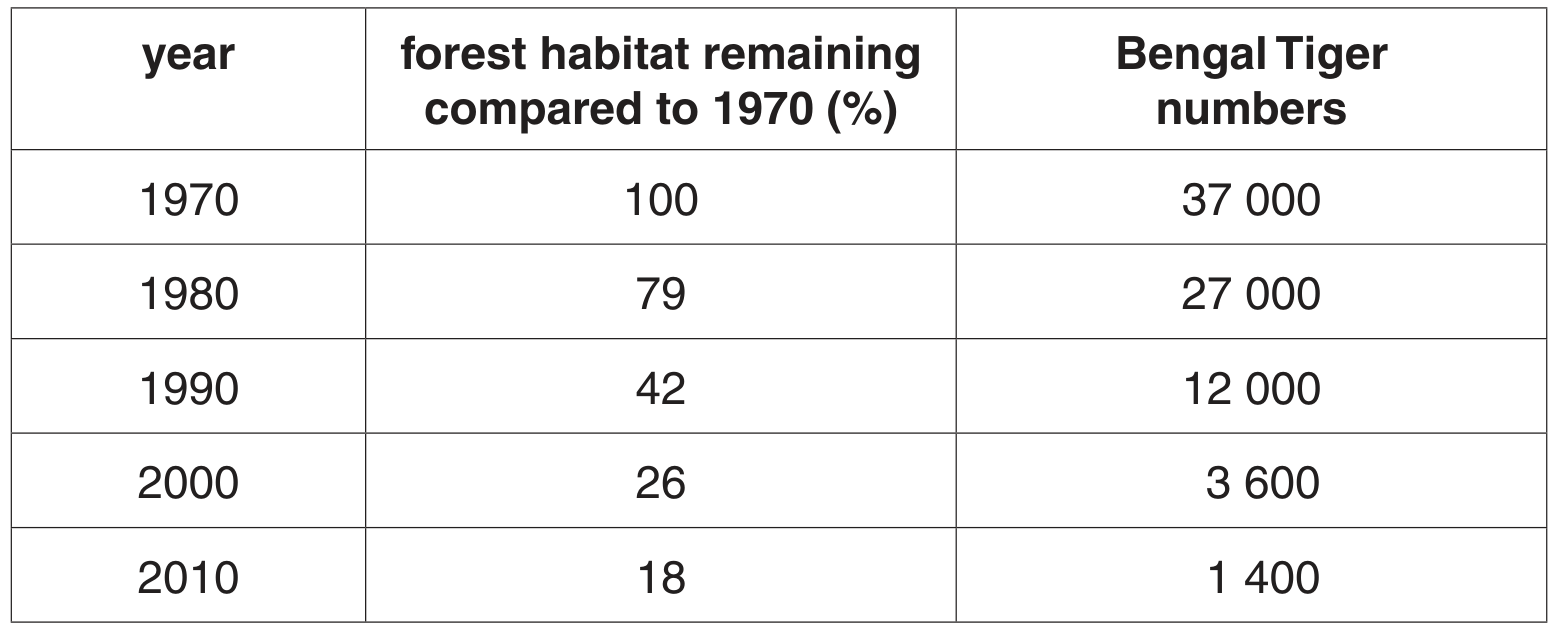
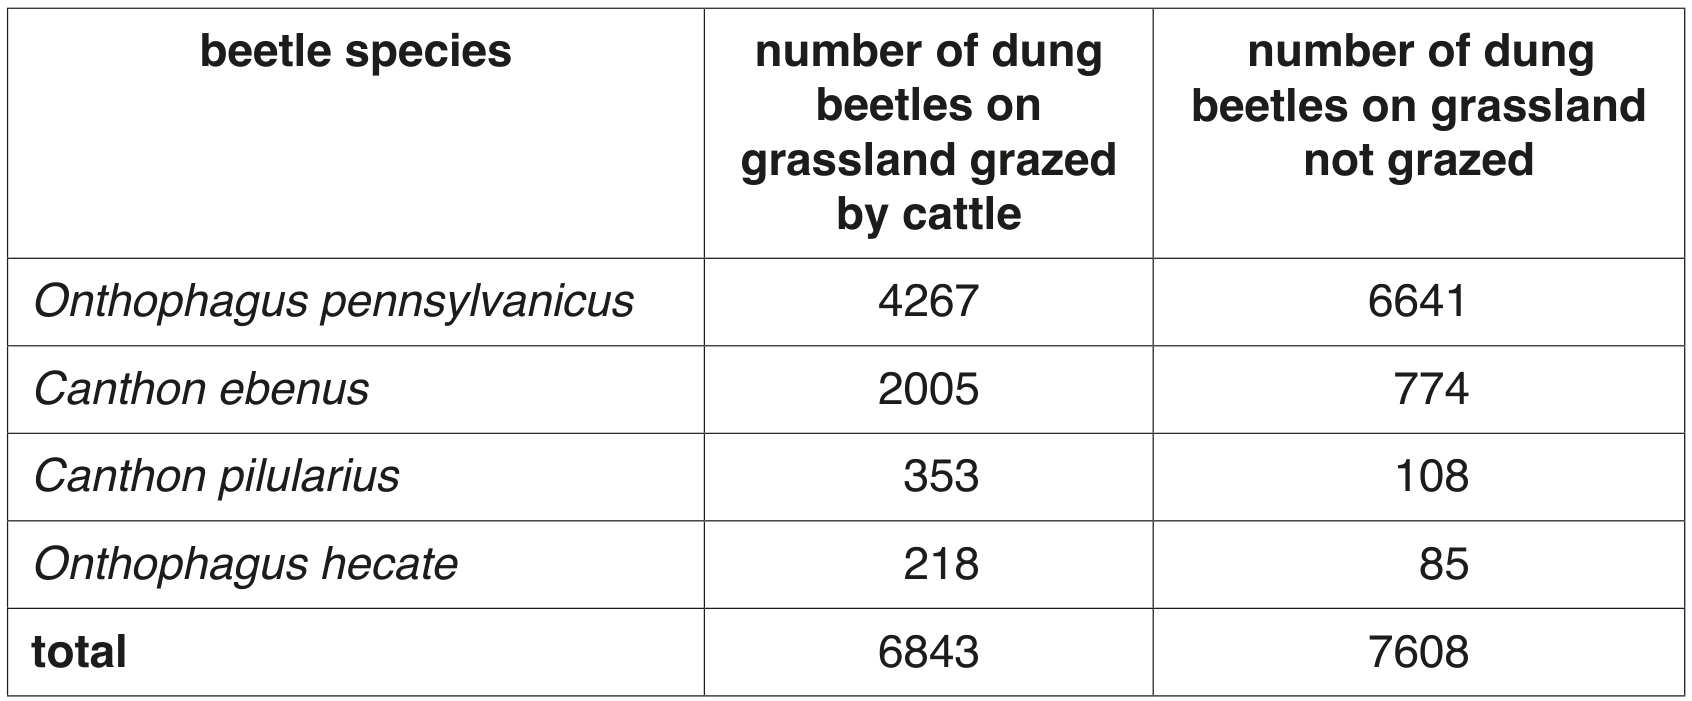
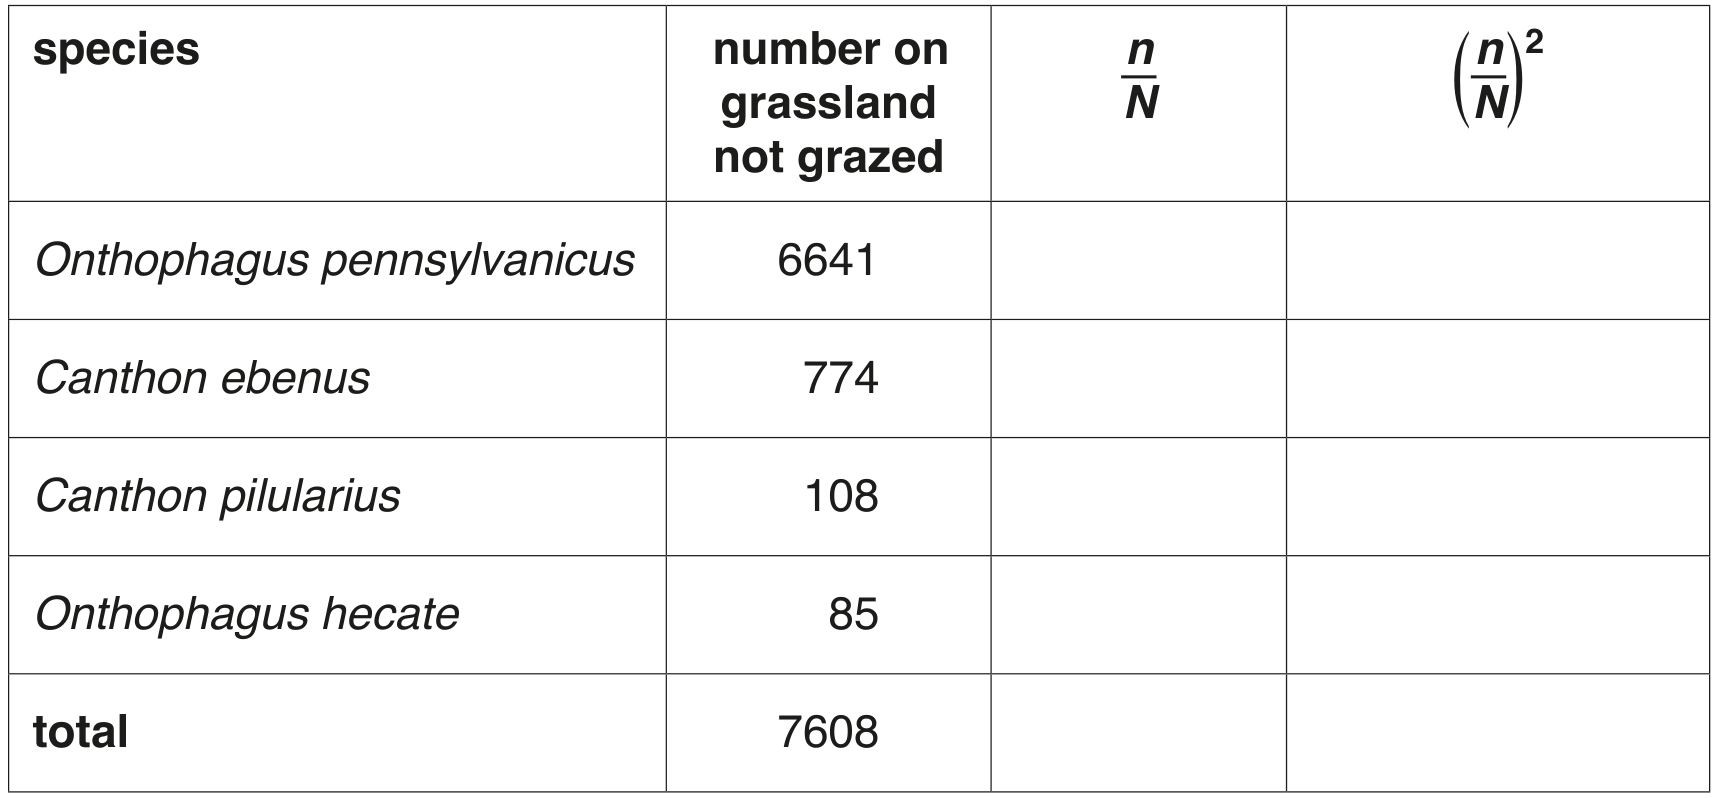
Table 1.1

Table 1.1

Calculate the percentage decrease in the number of Bengal Tigers between 1970 and 2010.

Give your answer to the nearest whole number.
answer \%

[ 2 ]
[Maximum number: 2]

The Ethiopian wolf, Canis simensis, is a member of the Canidae family of carnivores.
Fig. 1.1 shows an Ethiopian wolf.

Fig. 1.1

Fig. 1.1

(a)

According to the Red List, the number of endangered mammal species in 2007 was 349 and in 2008 was 448.

Calculate the percentage increase in endangered mammal species between 2007 and 2008.

Give your answer to the nearest whole number.
Show your working.

answer \%

[ 2 ]
[Maximum number: 2]

The main cause of tuberculosis (TB) in humans is the bacterium Mycobacterium tuberculosis. Most cases of the disease involve the lungs. The bacterium can enter cells and remain inactive in a latent (dormant) state. However, the bacterium can become active to produce symptoms of the disease.

In a person with active TB, the pathogen can be present in airborne droplets that are exhaled. Generally, a healthy person who inhales these droplets has effective defence mechanisms in the gas exchange system to prevent infection.

(a)

State the trends shown in Table 2.1.

[ 2 ]
[Maximum number: 4]

The red blood cells of people with sickle cell anaemia have reduced oxygen-carrying capacity.

(a)

People with kidney disease may be at a higher risk of TACO following a blood transfusion.

A study carried out in 2019 investigated whether there is a link between kidney disease and TACO. This study included data from:
- 200 people who developed TACO after a blood transfusion
- 405 people who did not develop TACO after a blood transfusion.

The people in the study were put into one of four categories:
- people with acute (short-term) kidney injury (AKI)
- people with chronic (long-term) kidney disease (CKD) who do not require dialysis
- people with severe chronic kidney disease who do require dialysis (CKD + D)
- people who do not have kidney disease.

In dialysis, a machine is used to carry out the function of the kidneys.
The results of this study are shown in Fig. 3.1.

key
□ percentage of the 200 people who developed TACO
□ percentage of the 405 people who did not develop TACO

key □ percentage of the 200 people who developed TACO □ percentage of the 405 people who did not develop TACO

With reference to Fig. 3.1, describe the effect of having kidney disease on the risk of developing TACO.

Suggest reasons for this effect.

[ 4 ]
(a)

One way to measure global biodiversity is to count the number of species of organisms.
Table 3.1 shows estimates for 2009 of the number of species in some taxa of animals.
The numbers in brackets are the numbers that were updated in 2019 from the International Union for Conservation of Nature and Natural Resources (IUCN) for three intensively studied taxa.

Table 3.1

Table 3.1

[ 2 ]
(i)

With reference to Table 3.1, identify the class of animals that is most diverse then calculate the percentage of animal species that belongs to this class.

Show your working and give your answer to two significant figures.
answer = \%

[ 2 ]
[Maximum number: 1]

The Hawaiian archipelago is a group of volcanic islands in the Pacific ocean.
Fig. 4.1 shows the relative locations of five of these islands.

Fig. 4.1

Fig. 4.1

Table 4.1 shows the size and age of these five islands and the total number of Mecyclothorax ground beetle species and their species density, on each island.

Data for the island of Maui is shown as two distinct regions, West and Haleakalã. This is because they formed at different times from two separate volcanoes.

Table 4.1

Table 4.1

Fig. 4.2 shows a ground beetle of the genus Mecyclothorax. All the beetle species of this genus on the Hawaiian archipelago form a monophyletic group, descended from one original colonising species that reached Maui from Australia.

Fig. 4.2

Fig. 4.2

(a)
(i)

Complete Table 4.1 by calculating the density of Mecyclothorax beetle species on the island of O'ahu.

[ 1 ]
[Maximum number: 5]

An investigation was carried out in a temperate woodland that contained a number of areas with two different types of ground cover vegetation.
- On higher ground where the soil was drier, the dominant ground cover plant was bracken, Pteridium aquilinum.
- On lower ground where the soil was wetter, the dominant ground cover plant was bramble, Rubus fruticosus.

(a)

Soil from under bracken and under brambles was collected and placed in two funnels. A bright light was placed over each funnel so that small invertebrate animals moved down the funnels and were collected in two collecting vessels.

The main groups of invertebrates present were identified and counted. Some of the results are shown in Table 8.1.

Table 8.1

Table 8.1

[ 5 ]
(i)

Simpson's Index of Diversity for invertebrates from the soil under bracken was calculated as 0.663 using the formula:

D=1((nN)2)D=1-\left(\sum\left(\frac{n}{N}\right)^{2}\right)

n= number of individuals of each species present in the sample
N= the total number of all individuals of all species.
Calculate Simpson's Index of Diversity for the invertebrates from the soil under brambles. Complete Table 8.2 and use the space provided to show your working. Show all working to three decimal places. Write your final answer on the dotted line.

Table 8.2

Table 8.2

Simpson's Index of Diversity =

[ 3 ]
(ii)

Describe what Table 8.1 and the calculated figures for Simpson's Index of Diversity show about the effect of bracken and bramble vegetation cover on the diversity and abundance of soil invertebrates in the woodland.
Answer one question.

[ 2 ]
(a)

Over the past 200 years, many species of animals and plants have become extinct.
Fig. 8.1 shows the changes between the years 1800 and 2000 in:
- the number of species becoming extinct
- the size of the world human population.

number of known extinct species

number of known extinct species

world human population ( ×106\times 10^{6} )

[ 2 ]
(i)

Calculate the rate of species extinction per year between 1950 and 2000.

Show your working.
answer =

[ 2 ]
[Maximum number: 5]

There is considerable variation in the ecosystems that occur in the continent of North America. These include coniferous forest, prairie grassland, scrub and desert. Large areas of land that once contained natural ecosystems are now used for agriculture.

(a)

The diversity of some beetle species that feed on animal dung (faeces) was investigated at two types of grassland site in North America. The first type of grassland site was grazed by cattle and the second type of site was not grazed.

Dung beetles were collected, identified and counted from two areas of the same total size. Some of the results are shown in Table 8.1.

Table 8.1

Table 8.1

[ 5 ]
(i)

Simpson's Index of Diversity for the beetles on the grassland grazed by cattle was calculated as 0.521 using the formula:

D=1((nN)2)D=1-\left(\sum\left(\frac{n}{N}\right)^{2}\right)

n= number of individuals of each species present in the sample
N= the total number of all individuals of all species
Calculate Simpson's Index of Diversity for the beetles on the grassland that was not grazed. Complete Table 8.2 to show your working. Show all working to three decimal places. Write your final answer on the dotted line.

Table 8.2

Table 8.2

Simpson's Index of Diversity =

[ 3 ]
(ii)

Describe what the results in Table 8.1 and both figures for Simpson's Index of Diversity show about the effect of grazing on the diversity of dung beetles.
Answer one question.

[ 2 ]
(a)

Fig. 9.1 shows how the mean global atmospheric carbon dioxide concentration has changed over the 800000(800×103)800000\left(800 \times 10^{3}\right) years leading up to the year 2020 .
mean global atmospheric carbon dioxide concentration /mgm3/ \mathrm{mg} \mathrm{m}^{-3}

Fig. 9.1

Fig. 9.1

[ 2 ]
(i)

Calculate the percentage increase in carbon dioxide concentration between point A and the year 2020.

Show your working. Write your answer to one decimal place.

percentage increase =2]
[ 2 ]
0