EduNinja
[Maximum number: 2]

When preparing infertile women for in-vitro fertilisation (IVF), it is necessary to stimulate the growth and maturation of several ovarian follicles. This is done by giving daily injections of the glycoprotein hormone, follicle stimulating hormone (FSH).

Each molecule of FSH has quaternary structure and consists of two different polypeptide chains, α\alpha and β\beta.

(a)

The effectiveness of r-hFSH was compared with that of u-hFSH. Women starting IVF treatment were randomly divided into two groups and given either r-hFSH or u-hFSH.

The differences between the two groups of women after FSH treatment are shown in Table 2.1.
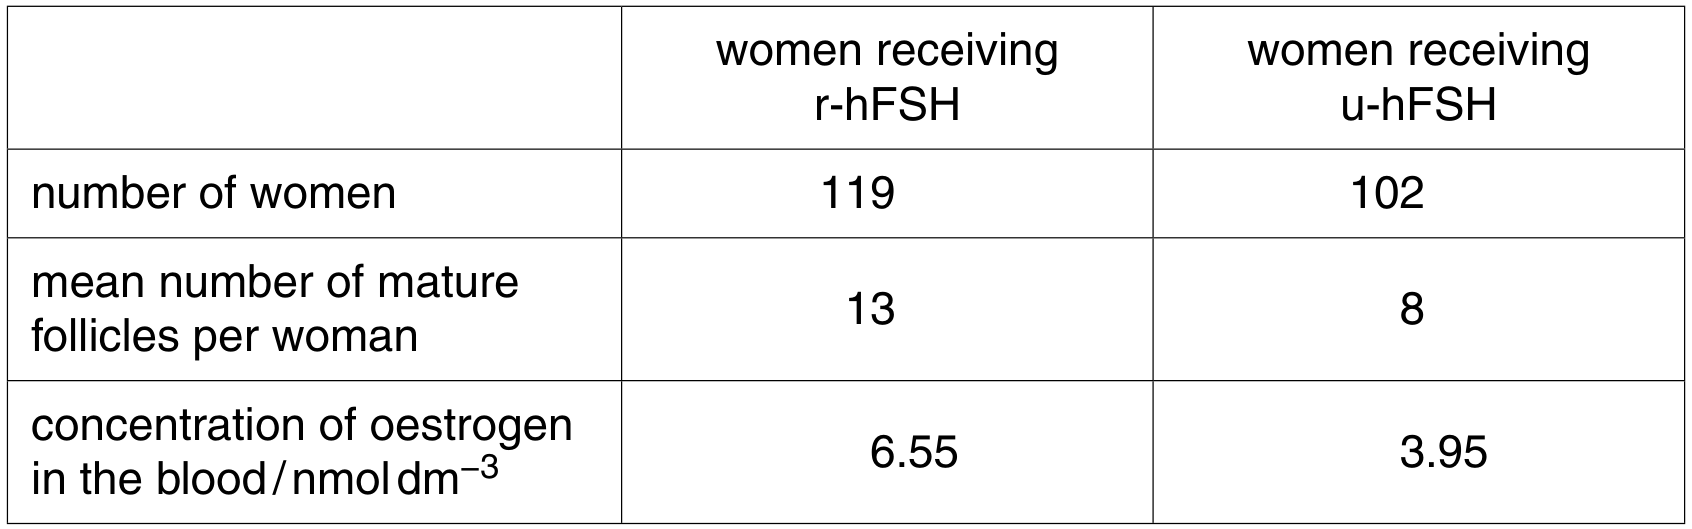
Table 2.1

Table 2.1

[ 2 ]
(i)

The probability of the results for the mean number of mature follicles per woman occurring by chance is <0.002.

Explain what is meant by this probability.

[ 2 ]
(a)

The null hypothesis states there is no significant difference between the mean times for 50 % of absorbed mesotrione to degrade in the two populations.

A t-test can be carried out to compare these two means. The critical value for t at the p=0.05 significance level is 2.23 .

[ 2 ]
(i)

Use the formula in Fig. 3.1 to calculate the value of t.

Show your working.

t=xˉ1xˉ2(s12n1+s22n2) Key = mean xˉ= standard deviation s=6 (number of readings for test population) n1=6 (number of readings for control population) n2=6 (number \boldsymbol{t}=\frac{\left|\bar{x}_{1}-\bar{x}_{2}\right|}{\sqrt{\left(\frac{s_{1}^{2}}{n_{1}}+\frac{s_{2}^{2}}{n_{2}}\right)}} \quad \begin{array}{ll} \text { Key } & =\text { mean } \\ \bar{x} & =\text { standard deviation } \\ s & =6 \text { (number of readings for test population) } \\ n_{1} & =6 \text { (number of readings for control population) } \\ n_{2} & =6 \text { (number } \end{array}
t=
(ii)

Use your calculated value of t to explain whether the null hypothesis should be accepted or rejected.
accept or reject
explanation

[ 2 ]
(a)

The null hypothesis states there is no significant difference between the mean times for 50 % of absorbed mesotrione to degrade in the two populations.

A t-test can be carried out to compare these two means. The critical value for t at the p=0.05 significance level is 2.23 .

[ 4 ]
(i)

Use the formula in Fig. 3.1 to calculate the value of t.

Show your working.

t=xˉ1xˉ2(s12n1+s22n2) Key = mean xˉ= standard deviation s=6 (number of readings for test population) n1=6 (number of readings for control population) n2=6 (number \boldsymbol{t}=\frac{\left|\bar{x}_{1}-\bar{x}_{2}\right|}{\sqrt{\left(\frac{s_{1}^{2}}{n_{1}}+\frac{s_{2}^{2}}{n_{2}}\right)}} \quad \begin{array}{ll} \text { Key } & =\text { mean } \\ \bar{x} & =\text { standard deviation } \\ s & =6 \text { (number of readings for test population) } \\ n_{1} & =6 \text { (number of readings for control population) } \\ n_{2} & =6 \text { (number } \end{array}
t=
[ 2 ]
(ii)

Use your calculated value of t to explain whether the null hypothesis should be accepted or rejected.
accept or reject
explanation

[ 2 ]
[Maximum number: 6]

Salmon can be genetically modified (GM) to produce increased quantities of growth hormone, which is a protein. GM salmon modified in this way have a faster growth rate and reach their maximum body mass at a younger age than non-GM salmon.

(a)

Scientists investigated whether injection of very young non-GM salmon with recombinant growth hormone could cause an increase in the growth rate of the salmon.

The scientists used two groups of non-GM salmon:
- a control group of salmon that were not injected with recombinant growth hormone
- an experimental group of salmon that were injected with 1.0μ g1.0 \mu \mathrm{~g} of recombinant growth hormone at the start of the experiment and once a week for the next six weeks.

The mean body mass of the salmon in the two groups at the start of the experiment was the same ( 5.3 g ).

After six weeks, the body mass of every salmon was measured again. The results are summarised in Table 3.1.

Table 3.1

Table 3.1

A student decided that a t-test should be performed on the results shown in Table 3.1.

[ 6 ]
(i)

Calculate the value of t for the results shown in Table 3.1 using the formula for the t-test:

t=xˉ1xˉ2(s12n1+s22n2)t=\frac{\left|\bar{x}_{1}-\bar{x}_{2}\right|}{\sqrt{\left(\frac{s_{1}^{2}}{n_{1}}+\frac{s_{2}^{2}}{n_{2}}\right)}}

Give your answer to two decimal places.
Show your working.

t=
[ 3 ]
(ii)

The critical value at p=0.05 for these data is 2.01.

The student used the results in Table 3.1 and the t-test to conclude that the injections of recombinant growth hormone cause an increase in the growth rate of the non-GM salmon.

Comment on the extent to which the conclusion made by the student can be supported.

[ 3 ]
(a)

The null hypothesis states there is no significant difference between the mean final root lengths of the two populations of thale cress grown in low phosphate soil type.

A t-test can be carried out to compare these two means. The critical value for t at the p=0.05 significance level is 2.00 .

Table 3.1

Table 3.1

[ 4 ]
(i)

Fig. 3.2 shows the formula for calculating the value of t.

t=xˉ1xˉ2(s12n1+s22n2)xˉ= mean s= standard deviation n= sample size (number of measurements) t=\frac{\left|\bar{x}_{1}-\bar{x}_{2}\right|}{\sqrt{\left(\frac{s_{1}^{2}}{n_{1}}+\frac{s_{2}^{2}}{n_{2}}\right)}} \quad \begin{aligned} & \bar{x}=\text { mean } \\ & s=\text { standard deviation } \\ & n=\text { sample size (number of measurements) } \end{aligned}

Use the formula in Fig. 3.2 to calculate the value of t.
Show your working.

t=
[ 2 ]
(ii)

Use your calculated value of t to explain whether the null hypothesis should be accepted or rejected.
accept or reject
explanation

[ 2 ]
[Maximum number: 1]

Within a population, the variation for one characteristic is usually the result of genetic and environmental causes.

(a)

A study was carried out to investigate the effect of treating infected chickens with extracts from a plant, Bidens pilosa.

B pilosa is used in traditional medicine for the treatment of some infectious diseases. - Three populations, each containing 25 chickens infected with Eimeria were observed. - The body mass of each chicken was measured at the start of the study. - Each population was given a different treatment for 56 days: - standard diet with no B. pilosa extract - standard diet with low dose of B. pilosa extract - standard diet with high dose of B. pilosa extract. - The body mass of each chicken was measured at the end of the study and the gain in body mass over the 56 days was calculated. - The mean gain in body mass was calculated for each population. The results are shown in Table 3.1.

Table 3.1

Table 3.1

A statistical analysis of the results of the study of these three populations confirmed that there was a significant difference in mean gain in body mass between low dose B. pilosa and high dose B. Pilosa extract treatments.

[ 1 ]
(i)

Name a statistical test that could be used to analyse the results of this study.

[ 1 ]
0