EduNinja
[Maximum number: 1]

The St. Lawrence river in Canada has been identified as an area with very high biodiversity.

(a)

The St. Lawrence river is rich in species of aquatic mammals, especially whales.

In spring, thousands of whales swim from the Atlantic ocean up the St. Lawrence river. Thirteen different species of whale have been recorded. One of these is the blue whale, Balaenoptera musculus.

Fig. 1.1 is a diagram of a blue whale.
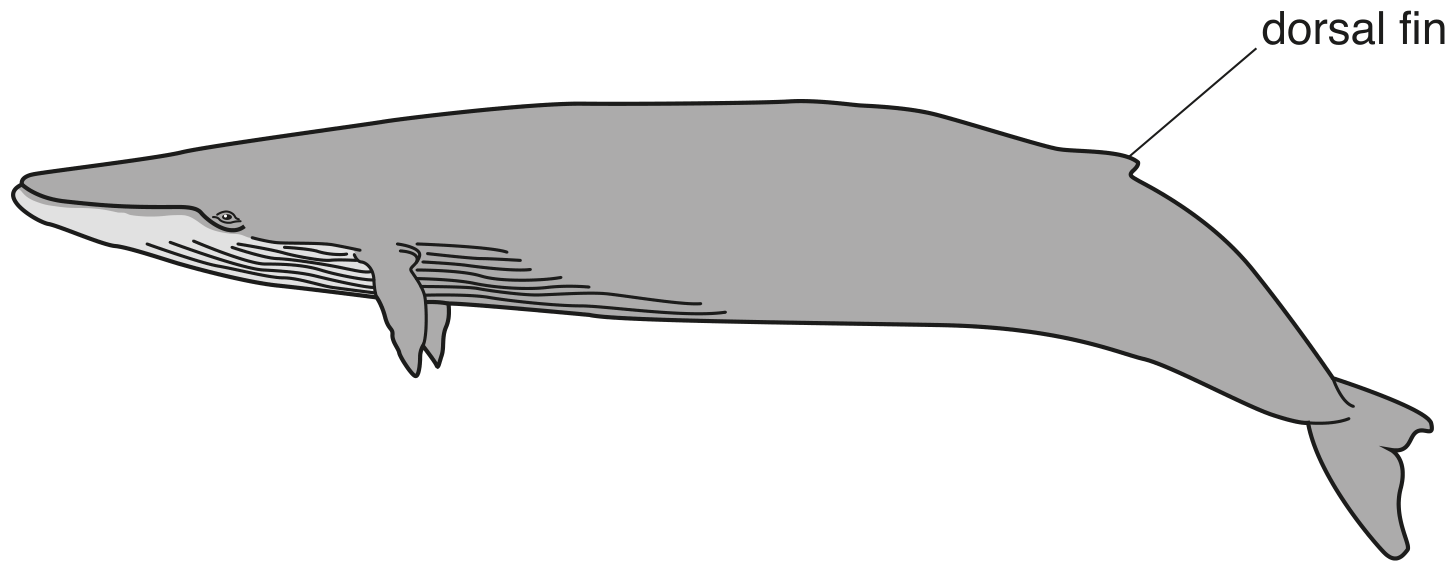
Fig. 1.1

Fig. 1.1

Photographs of blue whales are analysed by computer so that individual whales can be identified and population abundance can be estimated. Each blue whale is different in colour and in the shape of dorsal fin. Different whales also have different patterns of scarring.

[ 1 ]
(i)

State the two sources of phenotypic variation in the blue whale population.

[ 1 ]
[Maximum number: 3]

Steelhead trout, Oncorhynchus mykiss, are fish that live in streams in North America.
To increase the number of steelhead trout, captive breeding has occurred since 1992. Fish eggs and sperm are mixed and the young fish grow in large tanks of aerated water for the first year of their lives. Most are then released into the wild, however a few male and female fish are kept to become the parents of the next generation of captive-bred fish.

Each tank may hold up to 50000 fish. The young captive fish are fed processed food. Some young fish are unable to survive these conditions and a proportion die. Death is usually the result of poor wound-healing after accidents due to overcrowding and due to the spread of diseases.

(a)

Suggest and explain three ways in which the tank environment may make the phenotype of a captive fish different from a wild fish.

Two groups of fish were bred and grown in the same environment and were then compared to see if they showed differences in gene expression.

The two groups of fish came from:
- eggs and sperm from parent fish that had always lived in the wild
- eggs and sperm from parent fish that had been bred in captivity.

Results from microarray analysis showed that the offspring of the wild and captive-bred fish differed in the expression of over 700 genes.

[ 3 ]
[Maximum number: 4]

Phenotypic variation exists in many forms.

(a)

Some examples of phenotypic variation in plants and animals are described in Table 2.1.

Complete Table 2.1 by stating whether the cause of variation for each described example is likely to be due to:
- genetic factors, VG\mathrm{V}_{\mathrm{G}}
- environmental factors, VE\mathrm{V}_{\mathrm{E}}
- a combination of genetic and environmental factors, VG+VE\mathrm{V}_{\mathrm{G}}+\mathrm{V}_{\mathrm{E}}.

Table 2.1

Table 2.1

[ 3 ]
(b)

Name a spontaneous, random event occurring in cells that can be a source of phenotypic variation.

[ 1 ]
[Maximum number: 5]

The IUCN Red List provides information about the conservation status of species throughout the world, including the American badger, Taxidea taxus, and the black-footed ferret, Mustela nigripes.

Fig. 2.1 shows an American badger and Fig. 2.2 shows a black-footed ferret.

Fig. 2.1

Fig. 2.1

Fig. 2.2

Fig. 2.2

Fig. 2.3 shows the IUCN conservation status of the American badger and the black-footed ferret in 1987 and in 2013.

Fig. 2.3

Fig. 2.3

(a)

Black-footed ferrets were released at three different locations in the wild at different times. Each population was established from captive-bred animals.

Fig. 2.4 shows the population sizes of black-footed ferrets at the three release locations.

Fig. 2.4 shows the population sizes of black-footed ferrets at the three release locations.

[ 5 ]
(i)

Describe the patterns of population growth at the three locations where black-footed ferrets were released.

Table 2.1 shows information about the gene pool of the populations of black-footed ferrets and the leg sizes of the black-footed ferrets at each release location in 2004.

All three populations were started by animals from the same captive population. In this original captive population, 100 % of the genes surveyed showed polymorphism, that is, they had more than one allele. The mean number of alleles per gene locus was two.

The population at the South Dakota location in 2004 maintained the same level of genetic variation and leg size data as the original captive population, but the populations in Wyoming and Arizona showed changes.

Table 2.1

Table 2.1

[ 3 ]
(ii)

Use Table 2.1 to describe how the gene pools and leg sizes of the Wyoming and Arizona black-footed ferret populations have changed, compared to the original captive population.

[ 2 ]
[Maximum number: 3]

Variation exists in populations of a species and this may provide the opportunity for evolution to occur.

(a)

Phenotypic variation exists in many forms and has a number of possible causes.

Describe the main factors that are the cause of phenotypic variation.

[ 3 ]
[Maximum number: 4]

Domestic goats are small, herbivorous animals that provide milk for human use. This is an important source of food for people in rural South Africa.

Three Northern European goat varieties (breeds) have been imported to South Africa because they have higher milk yields than the native South African goats.

Table 2.1 compares the mean daily milk yields of these three breeds of Northern European goat in three locations, Northern Europe, Barbados and South Africa.

Table 2.1

Table 2.1

(a)
(i)

Explain how the data in Table 2.1 support the claim that some of the variation in mean daily milk yield in goats is due to genetic causes.

[ 2 ]
(ii)

The climate, vegetation and availability of veterinary care for goats in Northern Europe, Barbados and South Africa are different.

Explain how Table 2.1 shows that environmental factors can cause variation in mean daily milk yield in goats.

[ 2 ]
[Maximum number: 3]

Biodiversity can be assessed at three different levels. One of these is the genetic variation within each species.

(a)

Genetic variation is considered important in the conservation of species. Low genetic variation is assumed to decrease the chance of the long-term survival of a species.

[ 3 ]
(i)

Give reasons why low genetic variation may decrease the long-term survival of a species.

Fig. 2.1 shows how the International Union for the Conservation of Nature (IUCN) categorises species according to their conservation status.

Common species with the lowest conservation status (least risk of extinction) are categorised as Least Concern (LC).

conservation status

conservation status

[ 3 ]
[Maximum number: 2]

The cilia of ciliated epithelial cells show variation in length, within an individual and between different individuals.

Samples of ciliated epithelial tissue were removed from the airways of healthy people and the mean cilia length for each individual was calculated.

The people in the study formed two groups:
- people who were exposed to a harmful environmental factor
- people who were not exposed to a harmful environmental factor.

The results are shown in Fig. 3.1.

Fig. 3.1

Fig. 3.1

(a)
(i)

Suggest two harmful environmental factors that people might have been exposed to that could explain the difference between the two curves in Fig. 3.1.

[ 2 ]
(a)

Plants need mineral ions to grow and develop. For example, plants need phosphates and a deficiency inhibits cell division and root growth.

Mutations in individuals of some plant populations allow them to survive in mineral-deficient soils.

[ 2 ]
(i)

Name two examples of environmental conditions that affect plant phenotype, other than mineral deficiency.

For each example, describe how it affects the phenotype.

[ 2 ]
(b)

A study compared root growth of thale cress, Arabidopsis thaliana, in two different soil types:
- full nutrient
- low phosphate.

Two different populations of thale cress were used:
- thale cress with a functional enzyme X
- thale cress, with a non-functional enzyme X.

30 seedlings from each population were placed in each type of soil and left to grow for seven days. At the start all seedlings had a root of the same length. After seven days, the length of this root was measured again for each seedling.

The mean final root length and standard deviation was calculated for each population of thale cress.

The mean final root lengths are shown in Fig. 3.1.

Fig. 3.1

Fig. 3.1

With reference to Fig. 3.1, describe the effect of the low phosphate soil type compared to the full nutrient soil type on root growth, for both populations of thale cress.

[ 2 ]
[Maximum number: 3]

Within a population, the variation for one characteristic is usually the result of genetic and environmental causes.

(a)

Both genetic and environmental factors contribute to variation in body mass in a bird population.

One cause of variation in body mass in chickens is infection with the gut protoctist Eimeria. When fed with the same diet, infected chickens have a lower gain in body mass than healthy chickens in the same population.

[ 3 ]
(i)

Suggest reasons why infected chickens have a lower gain in body mass than healthy chickens.

[ 2 ]
(ii)

Suggest one environmental factor that affects the growth and reproduction of Eimeria.

[ 1 ]
0