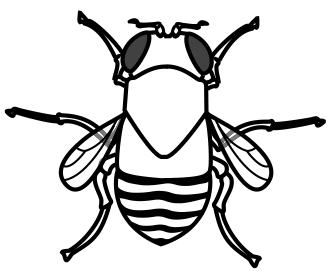
A mutation in a gene in the fruit fly, Drosophila melanogaster, gives rise to white-eyed flies instead of the normal red-eyed flies. The allele for red eyes (R) is dominant to the allele for white eyes (r).
A student crossed a red-eyed fly with a white-eyed fly.
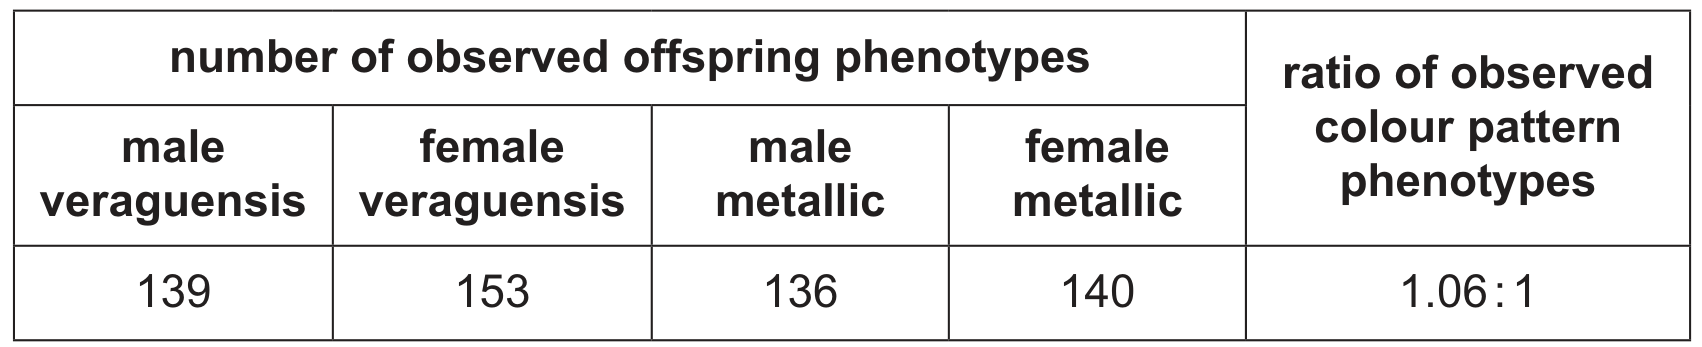
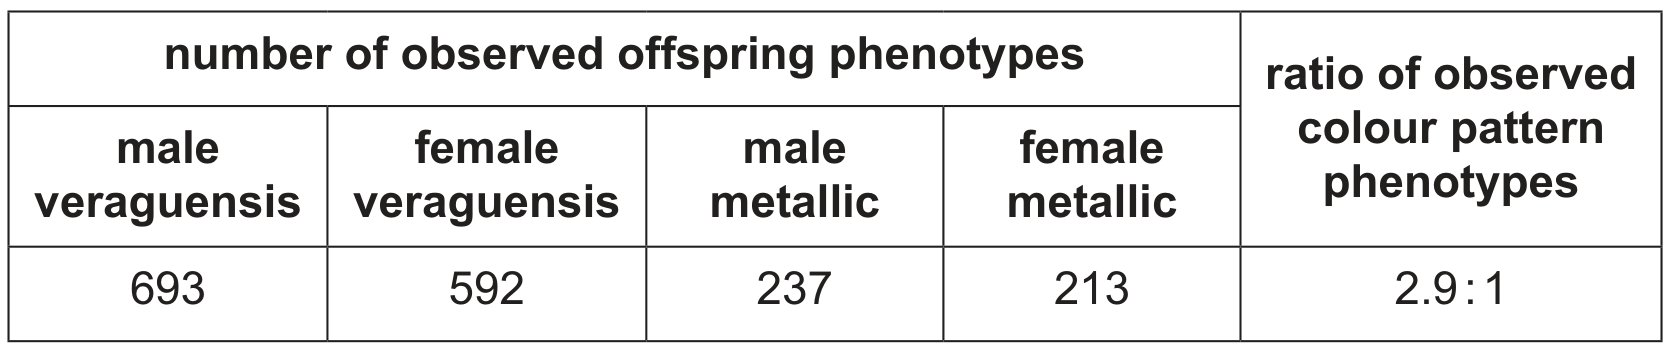
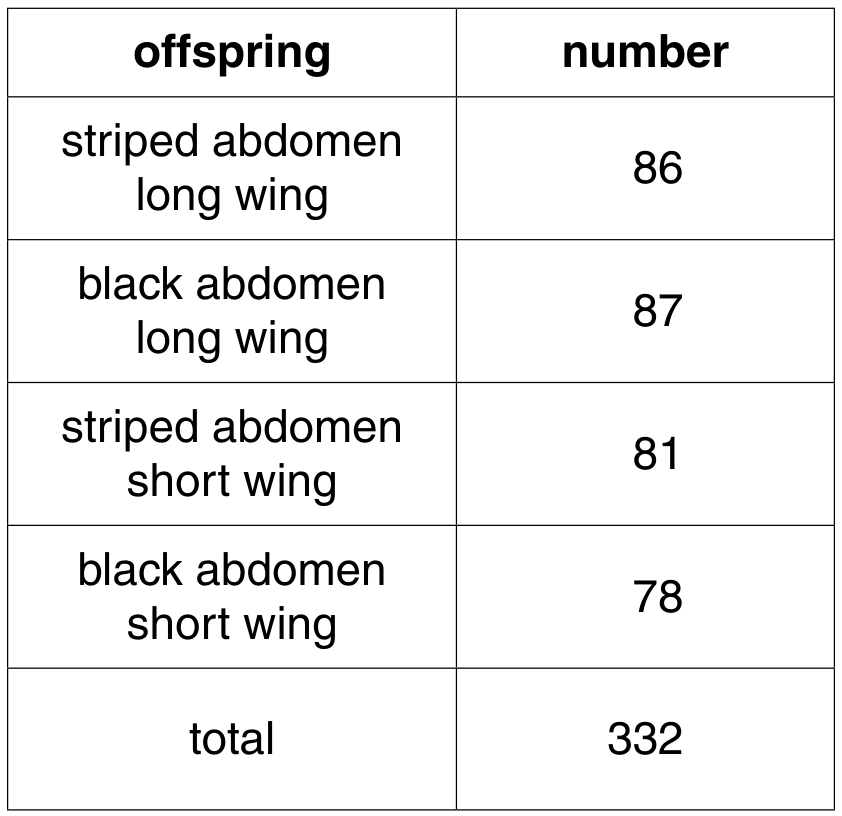
The results are shown in Table 1.1.
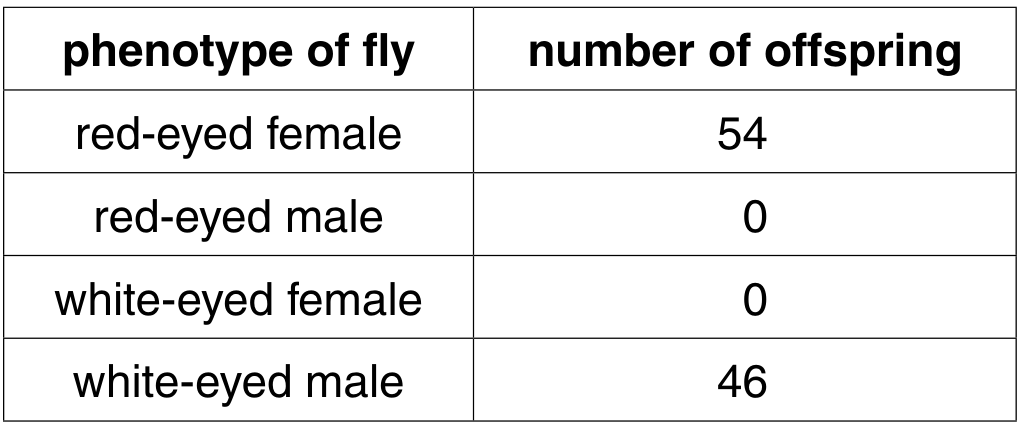
Table 1.1
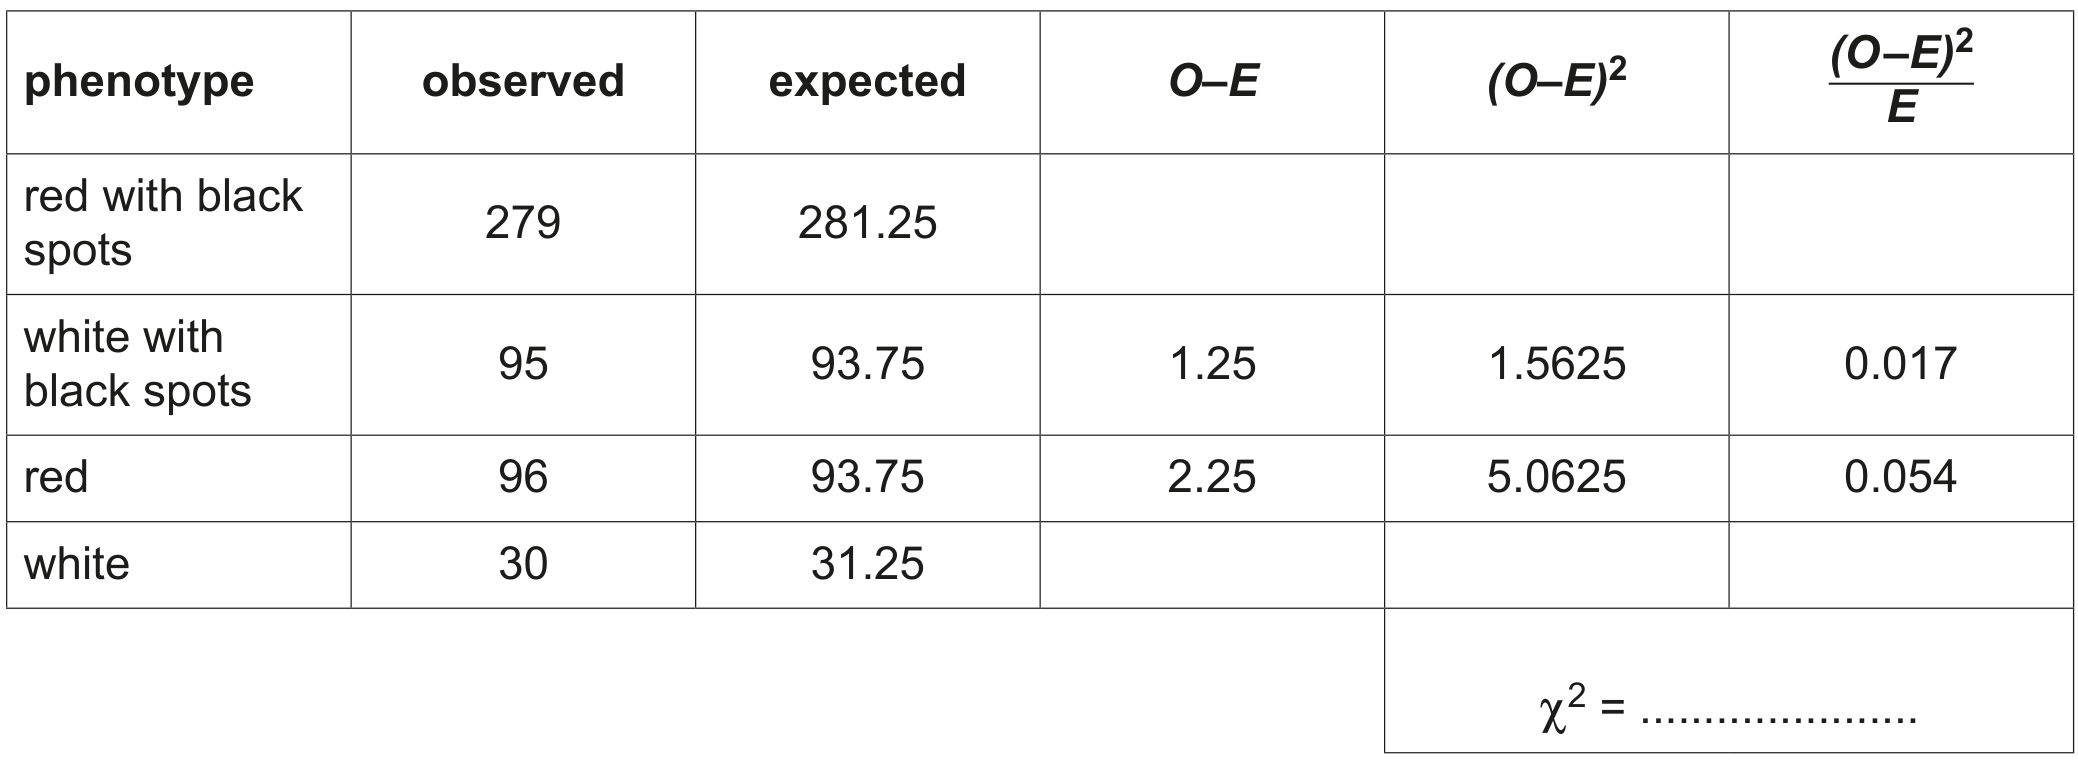
The chi-squared test can be used to analyse the results in Table 1.1.
The expected ratio of red-eyed females to white-eyed males is 1: 1.
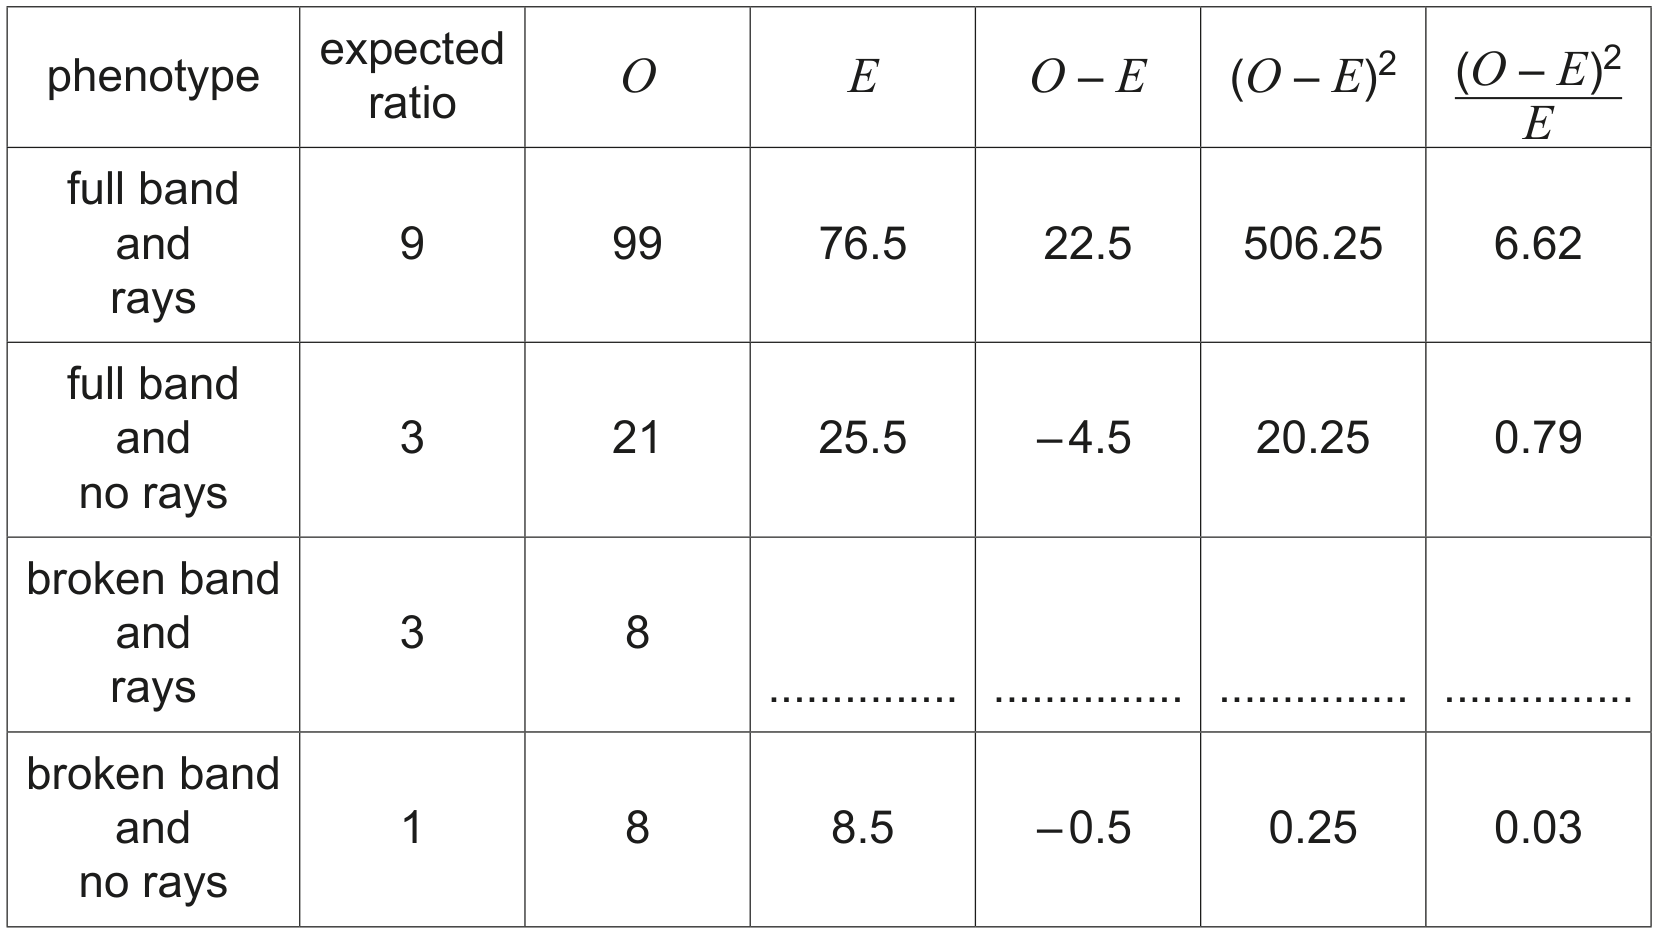
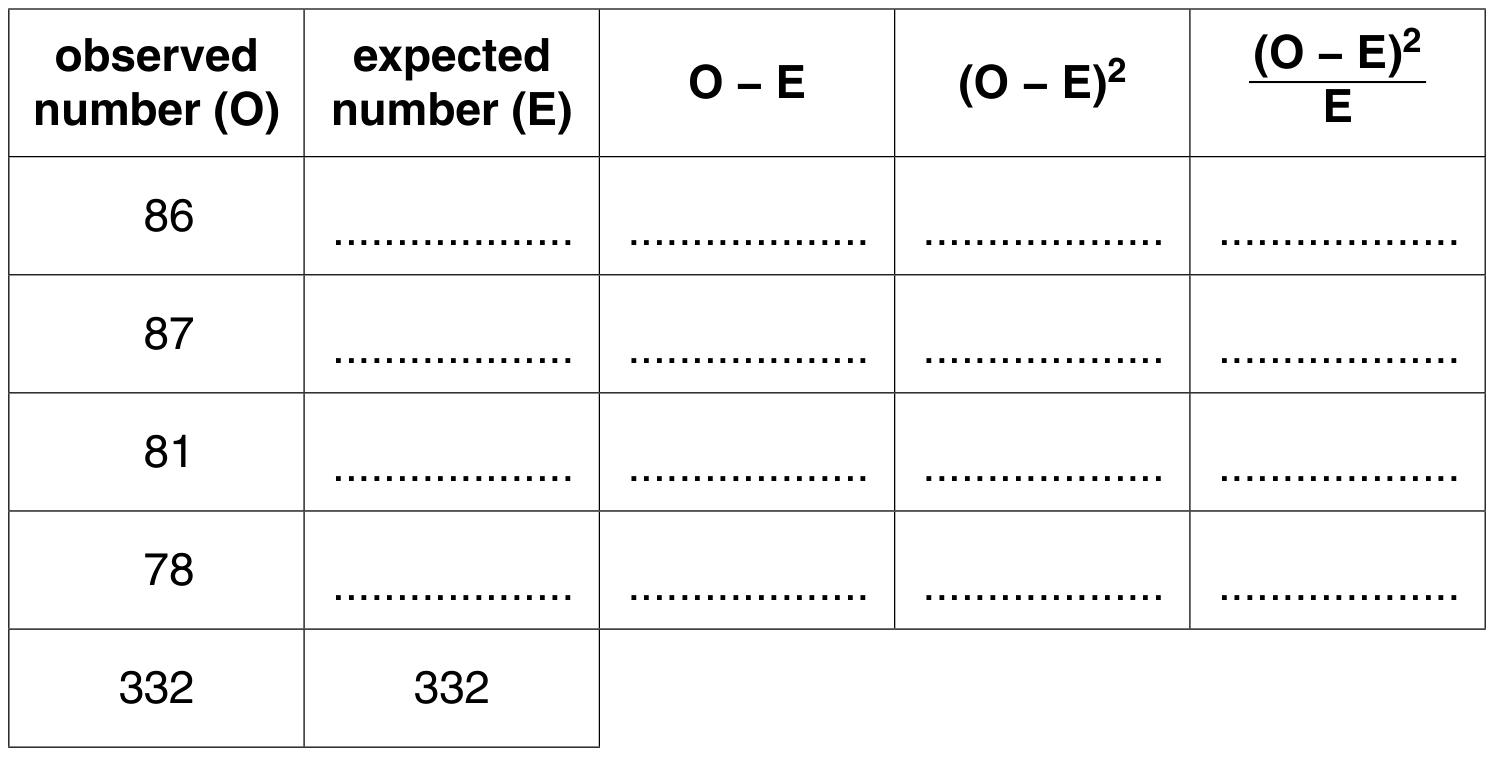
Complete Table 1.2 and use this to calculate a value for chi-squared .
key
sum of
v= degrees of freedom
n= number of classes
O = observed value
E = expected value
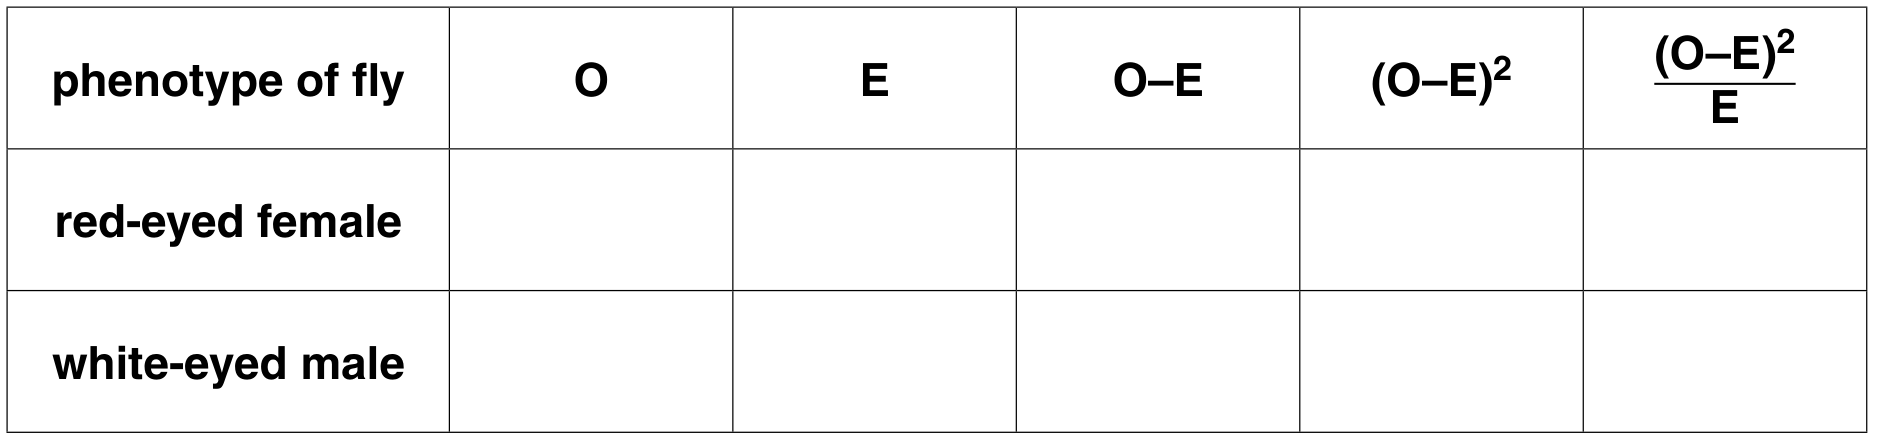
Table 1.2
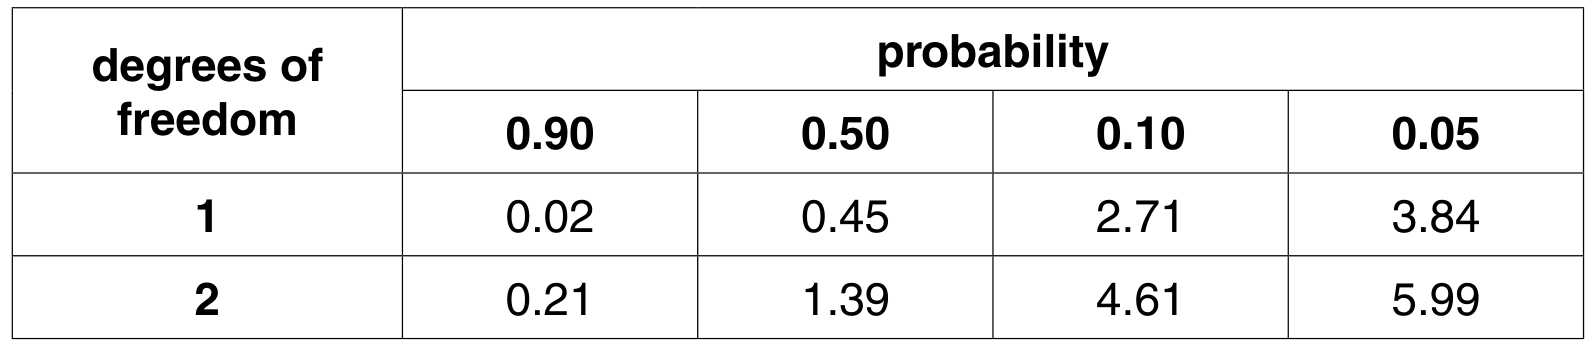
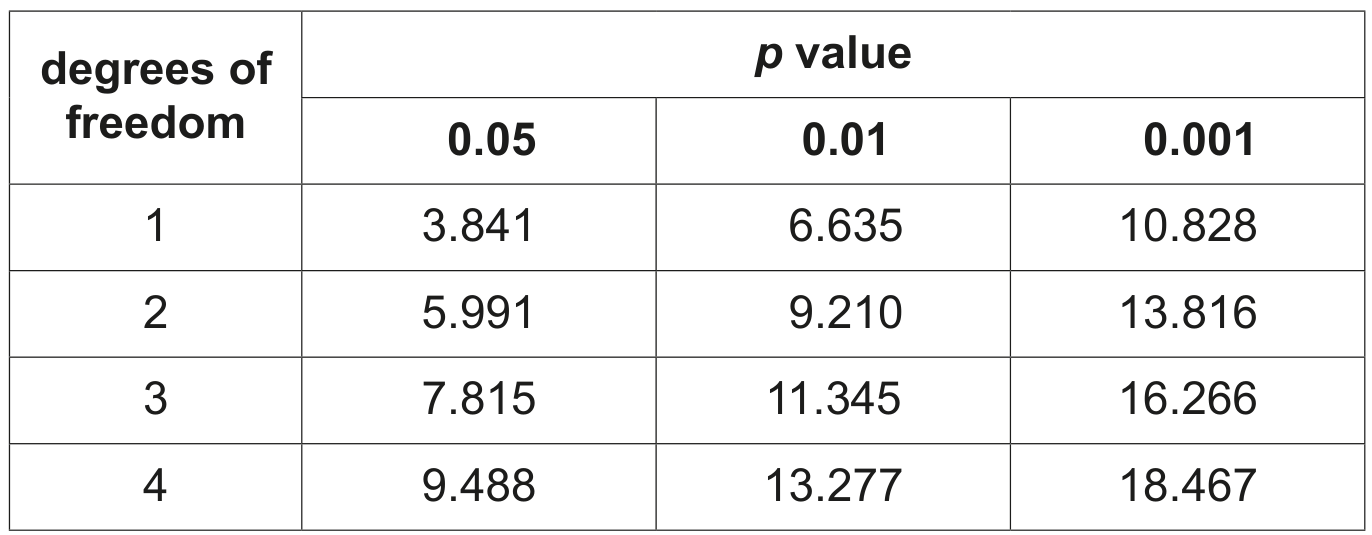
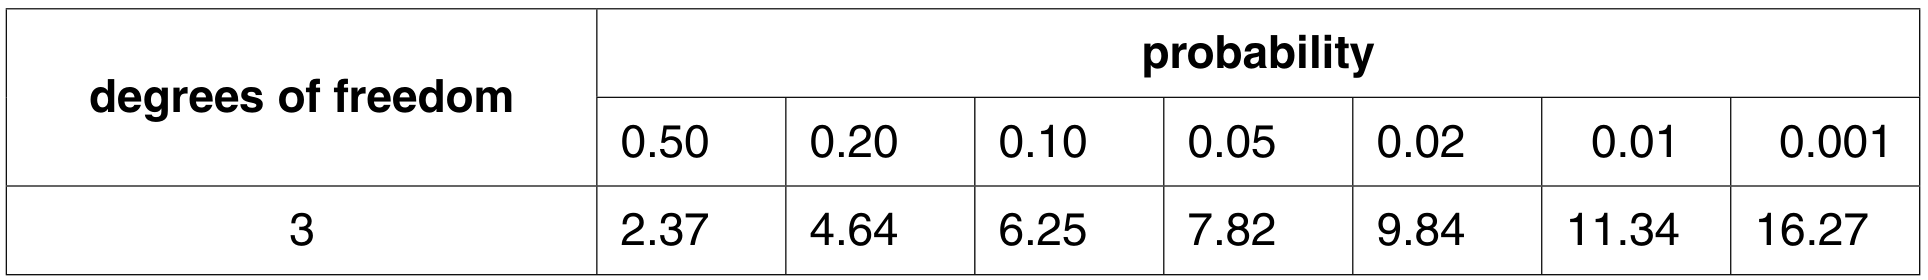
Use your calculated value of and the table of probabilities below, to test the significance of the difference between observed and expected results.