Question 4
Question 4(a)
(a)
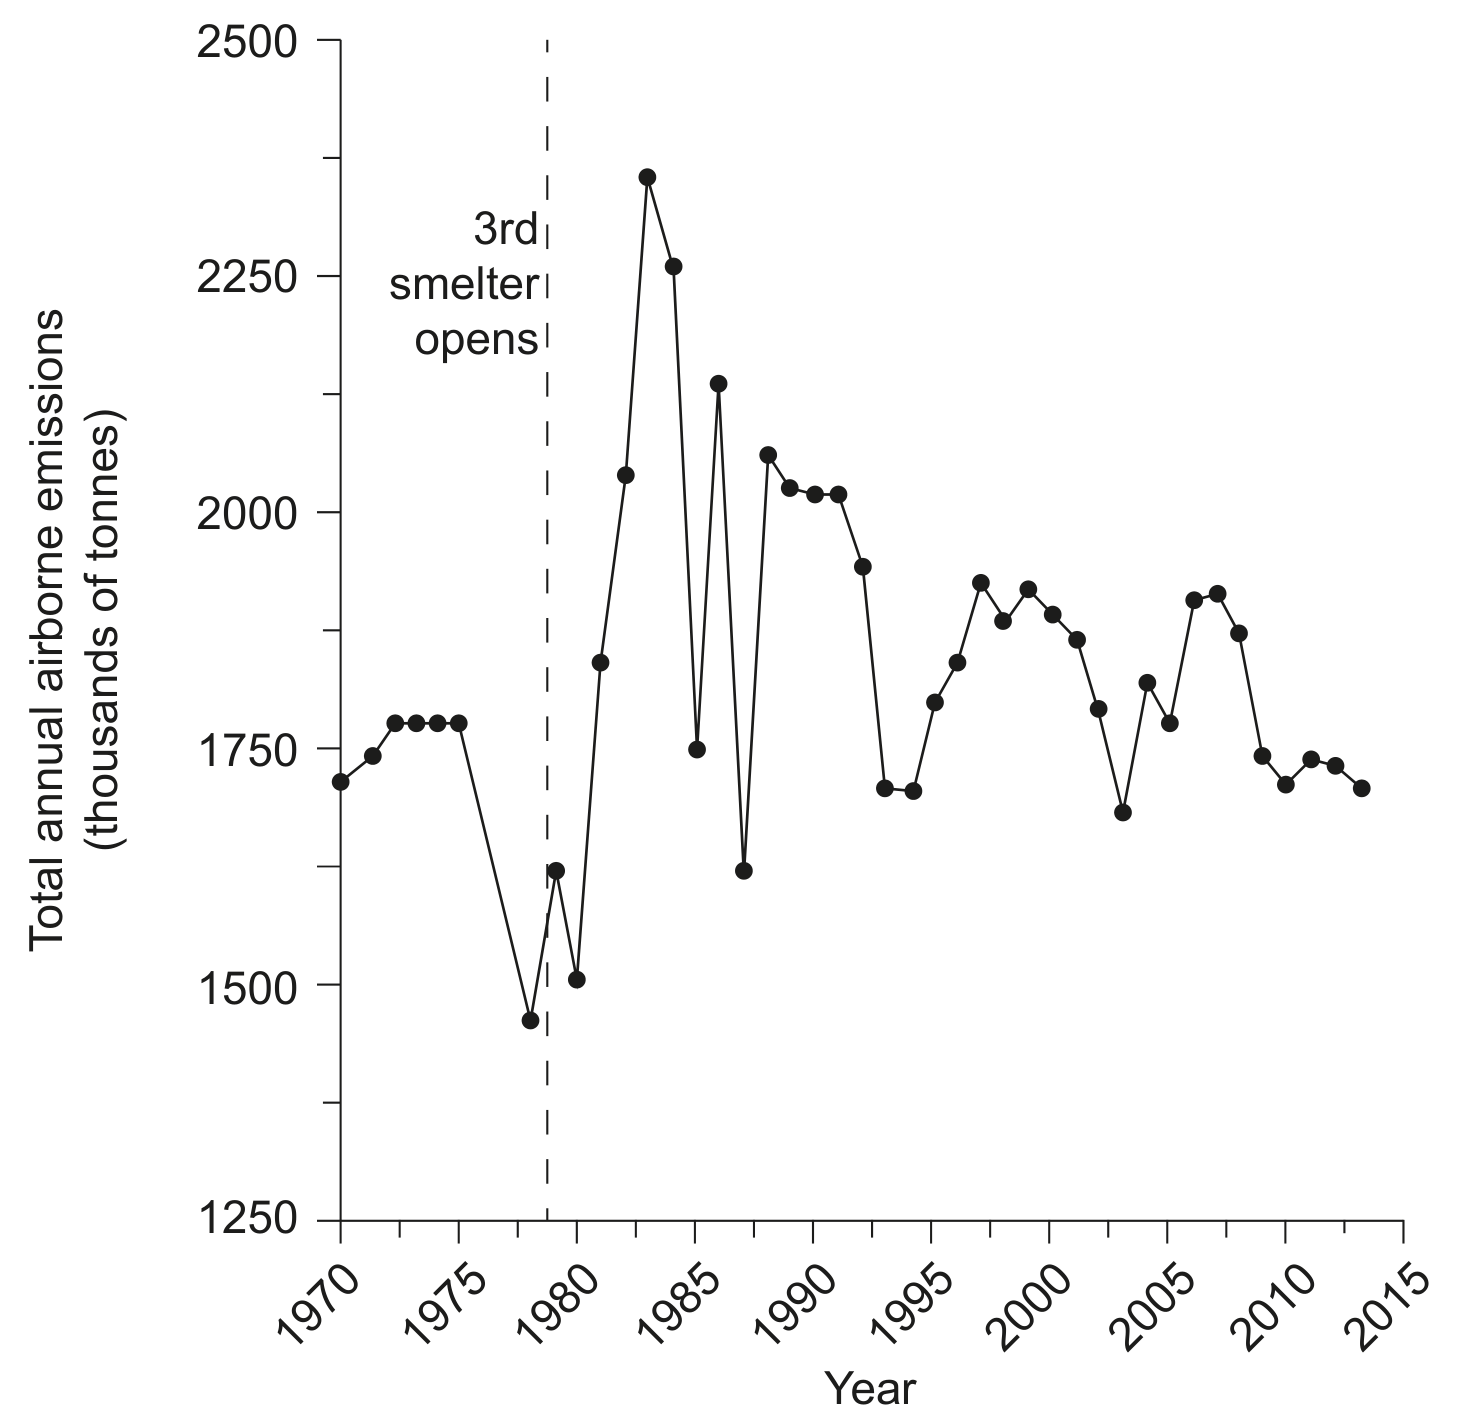
Figure 6(b): Total annual sulphur dioxide and particulate emissions from smelting factories in Norilsk
With reference to Figure 6(b), identify one strategy that might have been used to achieve the trend in sulphur dioxide emissions since the early 1980s.
[ 1 ]
Question 4(b)
(b)
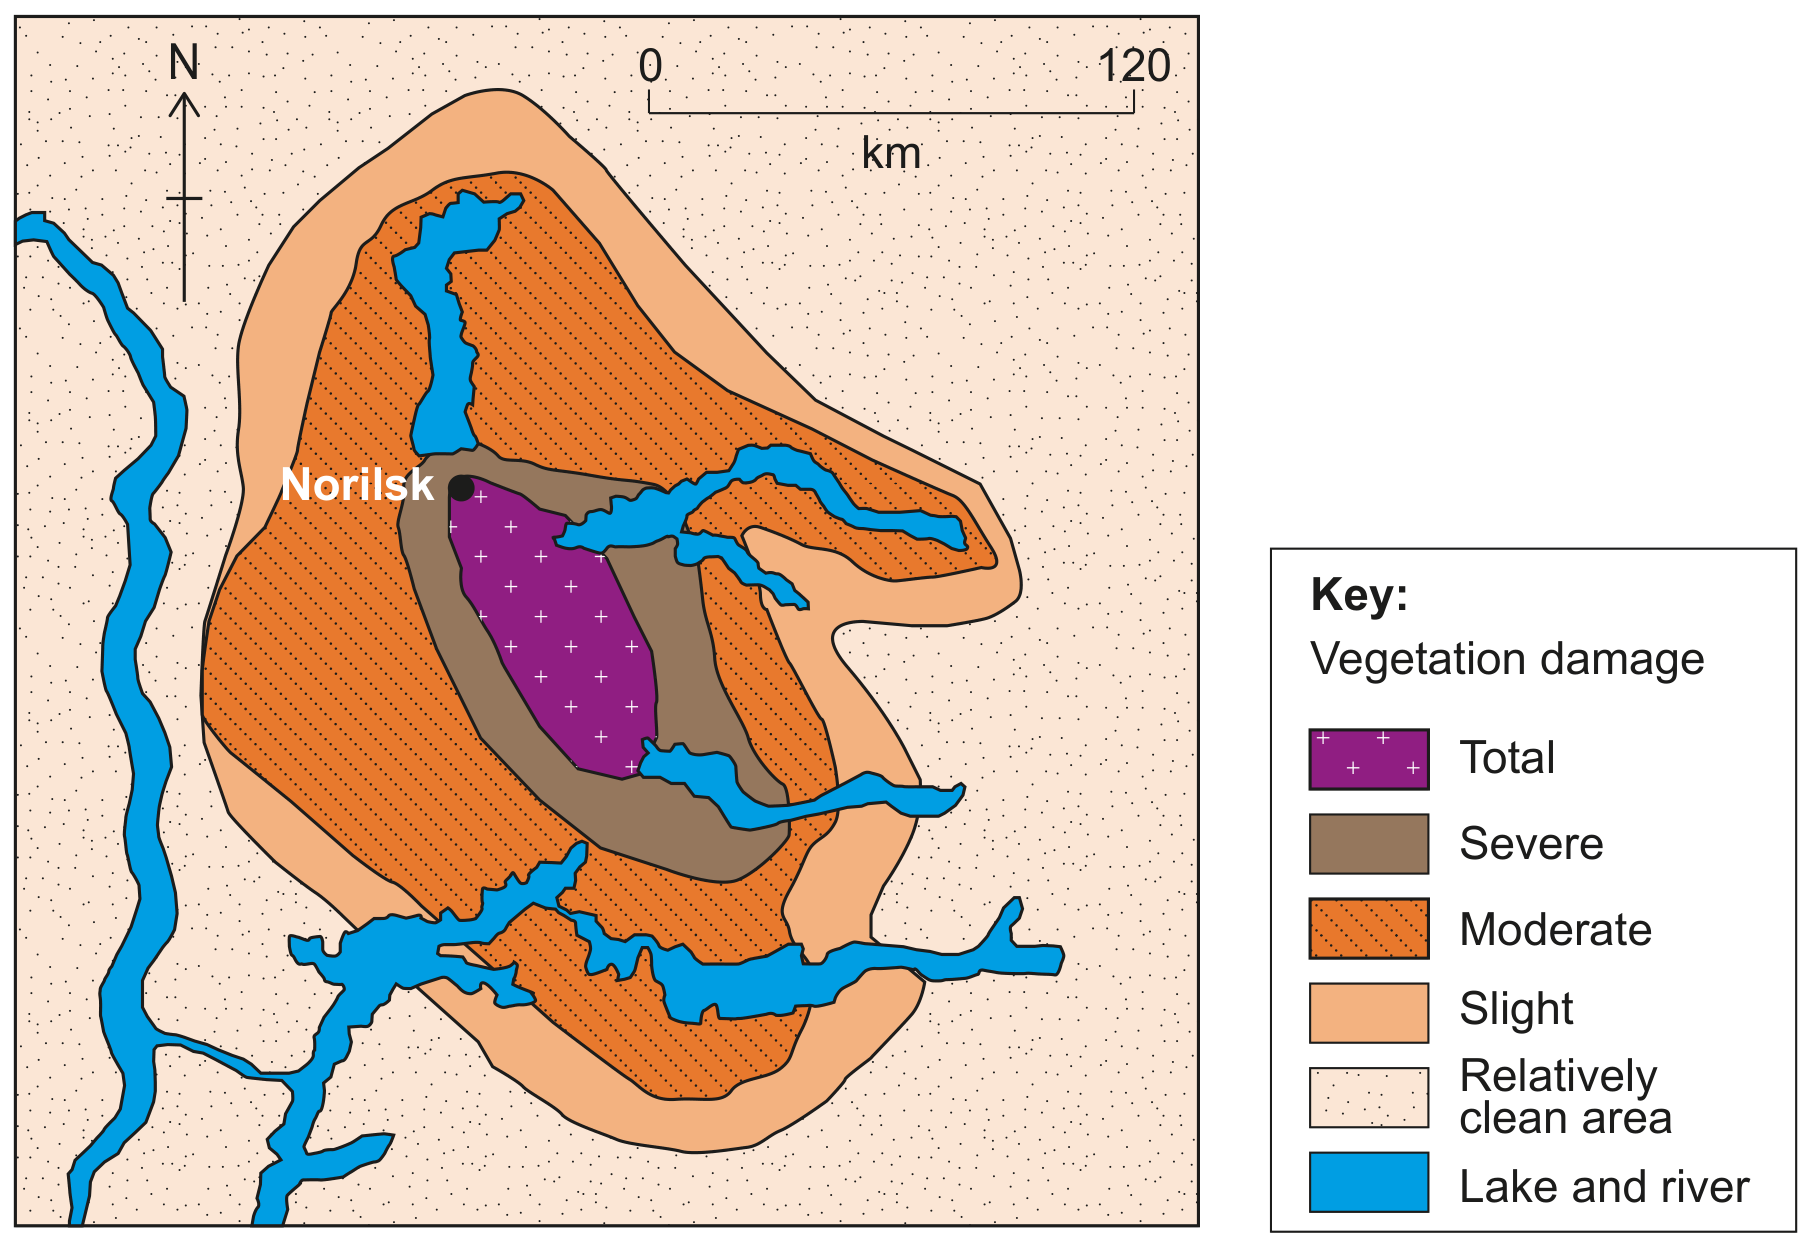
Figure 6(c): Vegetation damage associated with smelting factories in Norilsk
Explain the distribution of vegetation damage shown in Figure 6(c).
[ 3 ]