IB ESS 3.2 Human Impact on Biodiversity Topic Practice

EduNinja

Question 1

[Maximum number: 8]
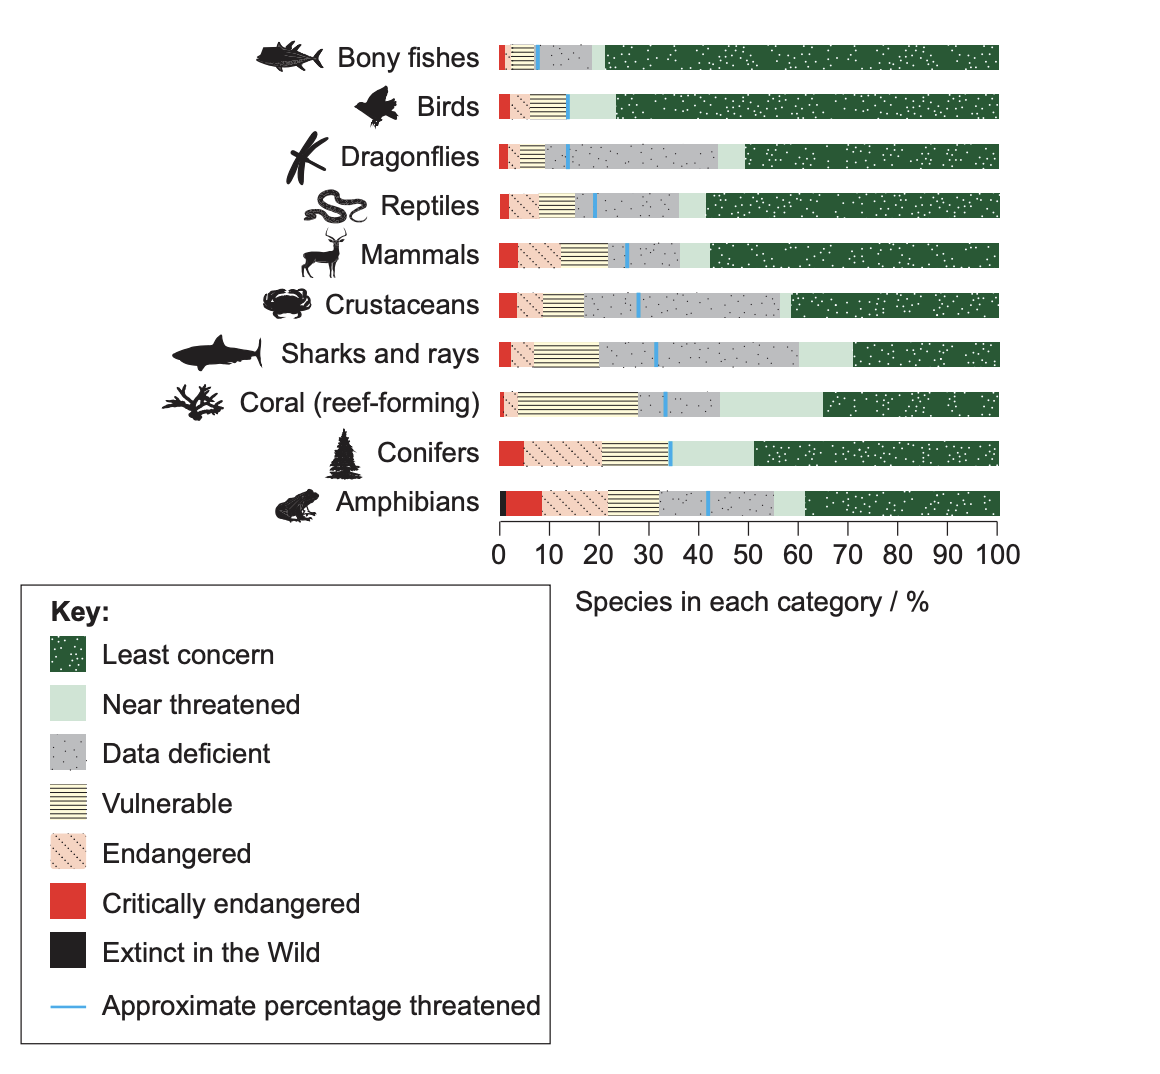
Figure 1(a): Extinction risk levels in global biodiversity
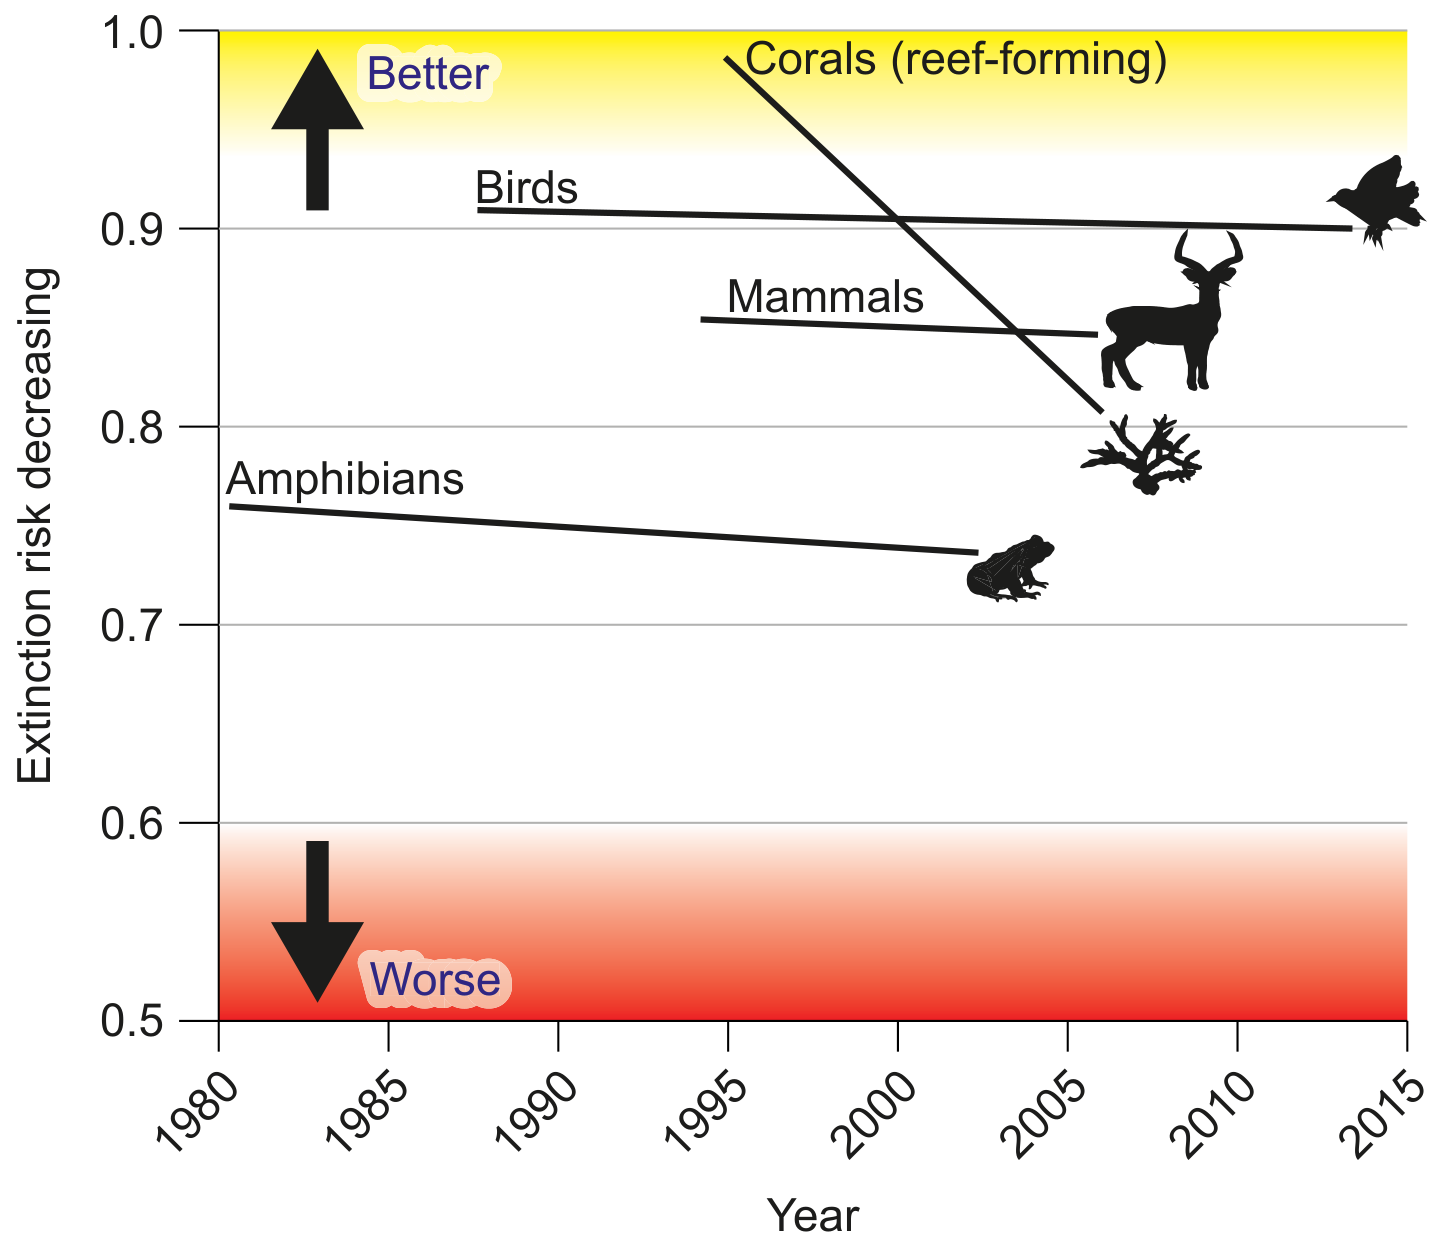
Figure 1(a): Extinction risk levels in global biodiversity

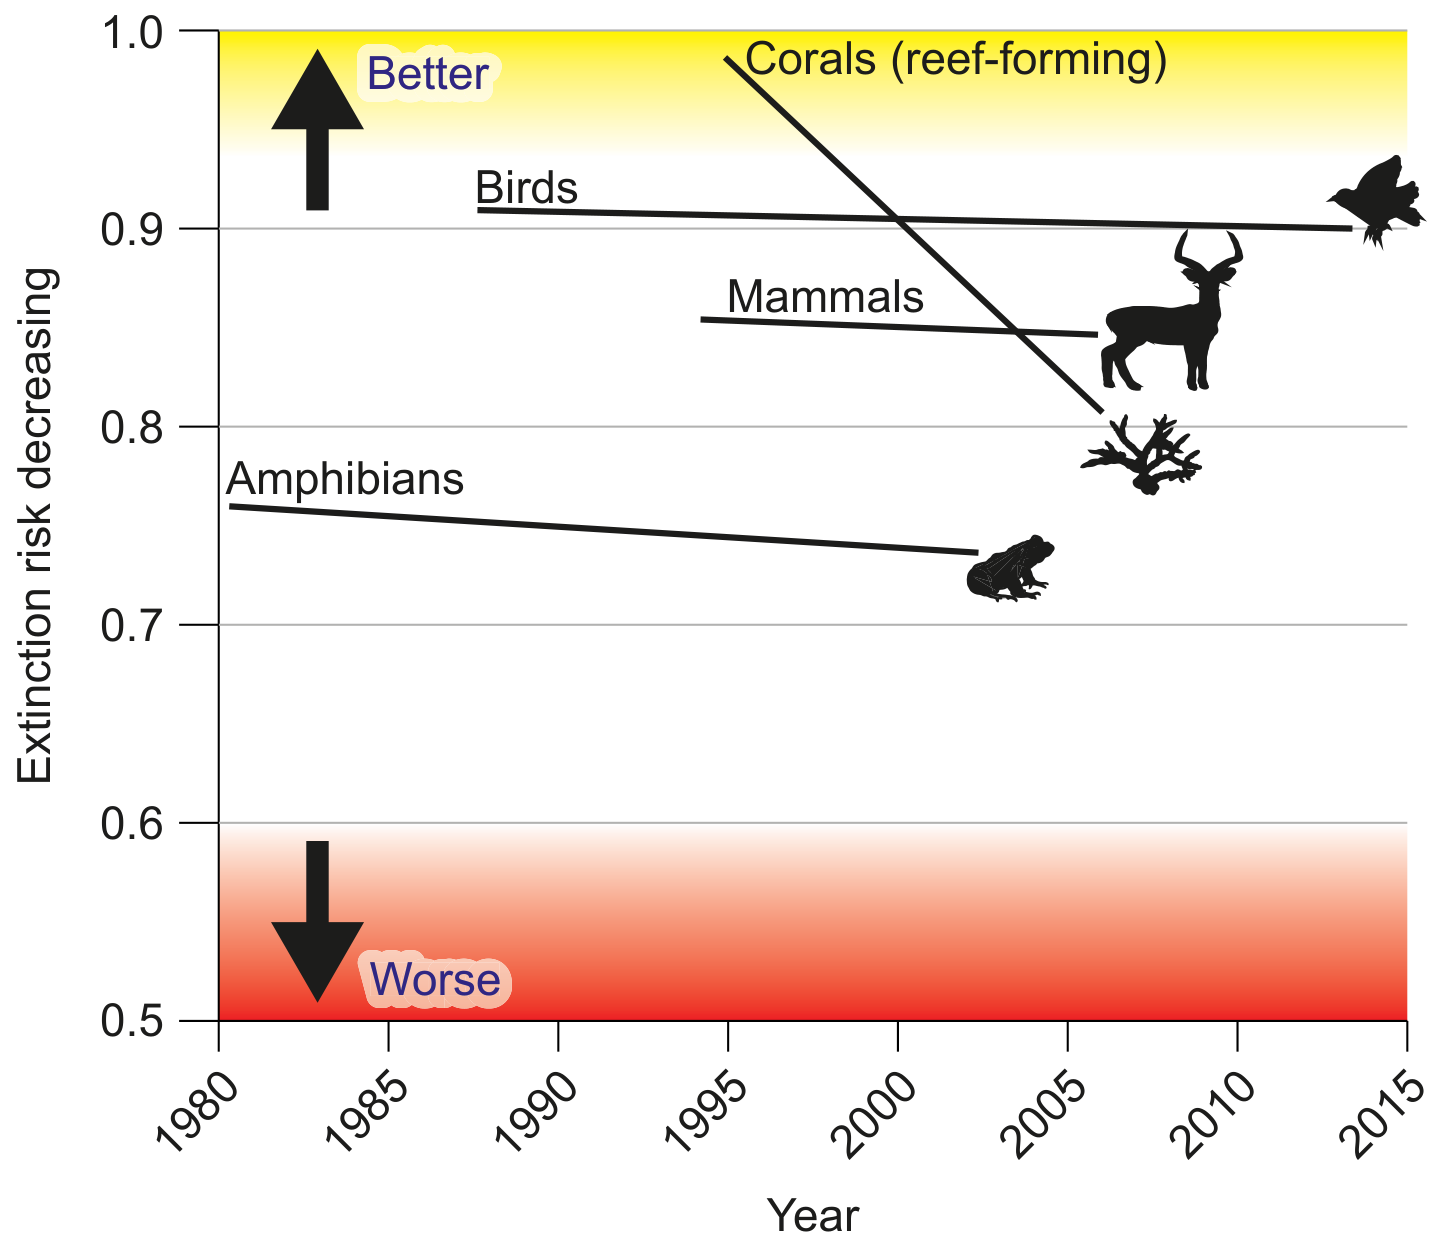
Figure 1(b): Changing species extinction risk 1980-2015

Figure 1(b): Changing species extinction risk 1980-2015

Question 1(a)

(a)

State the category with the lowest approximate percentage of threatened species in Figure 1(a).

[ 1 ]

Question 1(b)

(b)

Outline two reasons why amphibians have the highest approximate percentage of threatened species, as shown in Figure 1(a).

[ 2 ]

Question 1(c)

(c)

Using Figure 1(a), state the approximate percentage of sharks and rays that are threatened.

[ 1 ]

Question 1(d)

(d)

Describe one reason why there is a lack of available data for sharks and rays.

[ 1 ]

Question 1(e)

(e)

Outline three reasons why the trend for corals is different to the other categories shown in Figure 1(b).

[ 3 ]
Question 1

[Maximum number: 8]
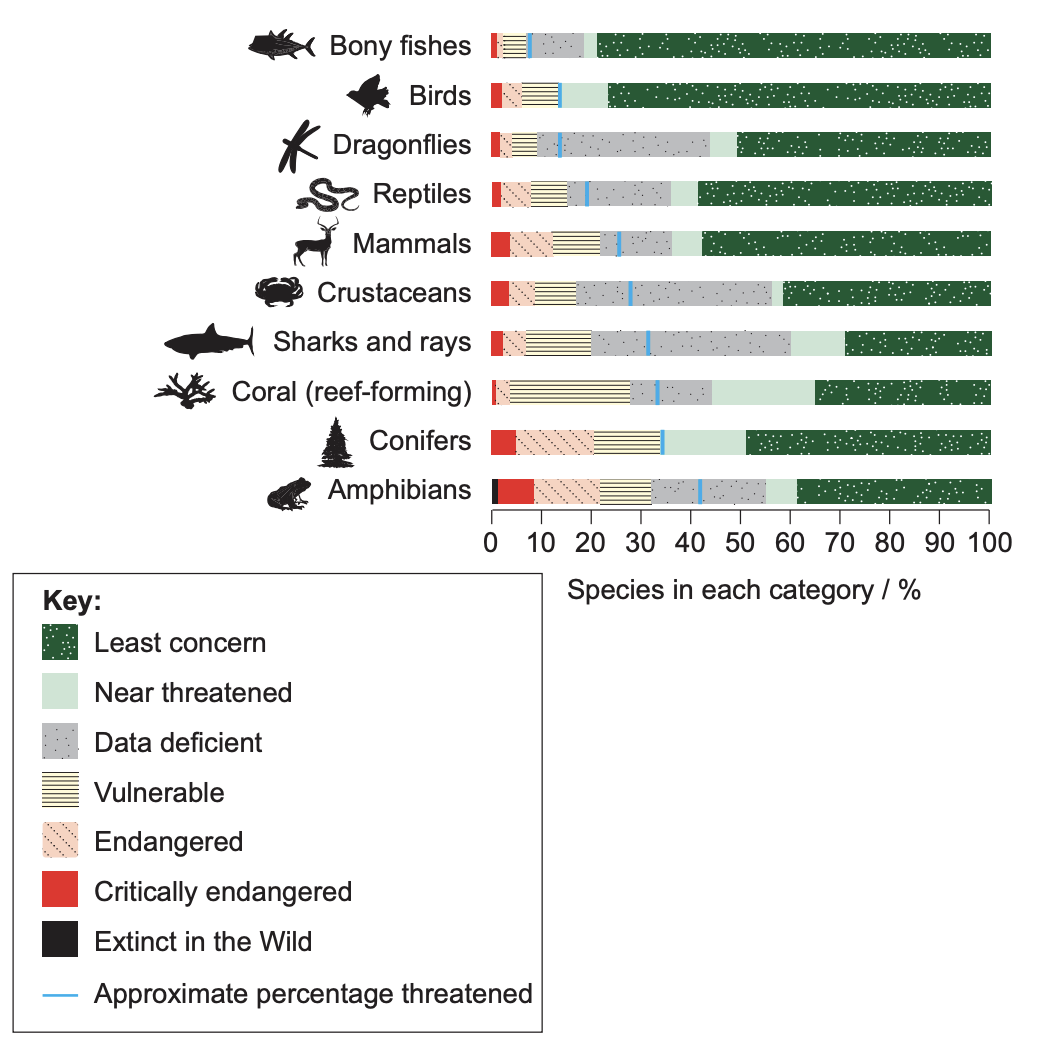
Figure 1(a): Extinction risk levels of species in global biodiversity by category

Figure 1(a): Extinction risk levels of species in global biodiversity by category

Figure 1(b): Changing species extinction risk by category 1980-2015

Figure 1(b): Changing species extinction risk by category 1980-2015

Question 1(a)

(a)

State the category with the highest percentage of vulnerable species in Figure 1(a).

[ 1 ]

Question 1(b)

(b)

Outline two reasons why Amphibians have the highest percentage of critically endangered species in Figure 1(a).

[ 2 ]

Question 1(c)

(c)

Using Figure 1(a), state the approximate percentage of threatened crustaceans.

[ 1 ]

Question 1(d)

(d)

Describe one reason for the lack of available data for crustaceans.

[ 1 ]

Question 1(e)

(e)

Outline three reasons why the trend for corals is different to the other categories shown in Figure 1(b).

[ 3 ]
Question 2

Question 2(c)(i)

(a)
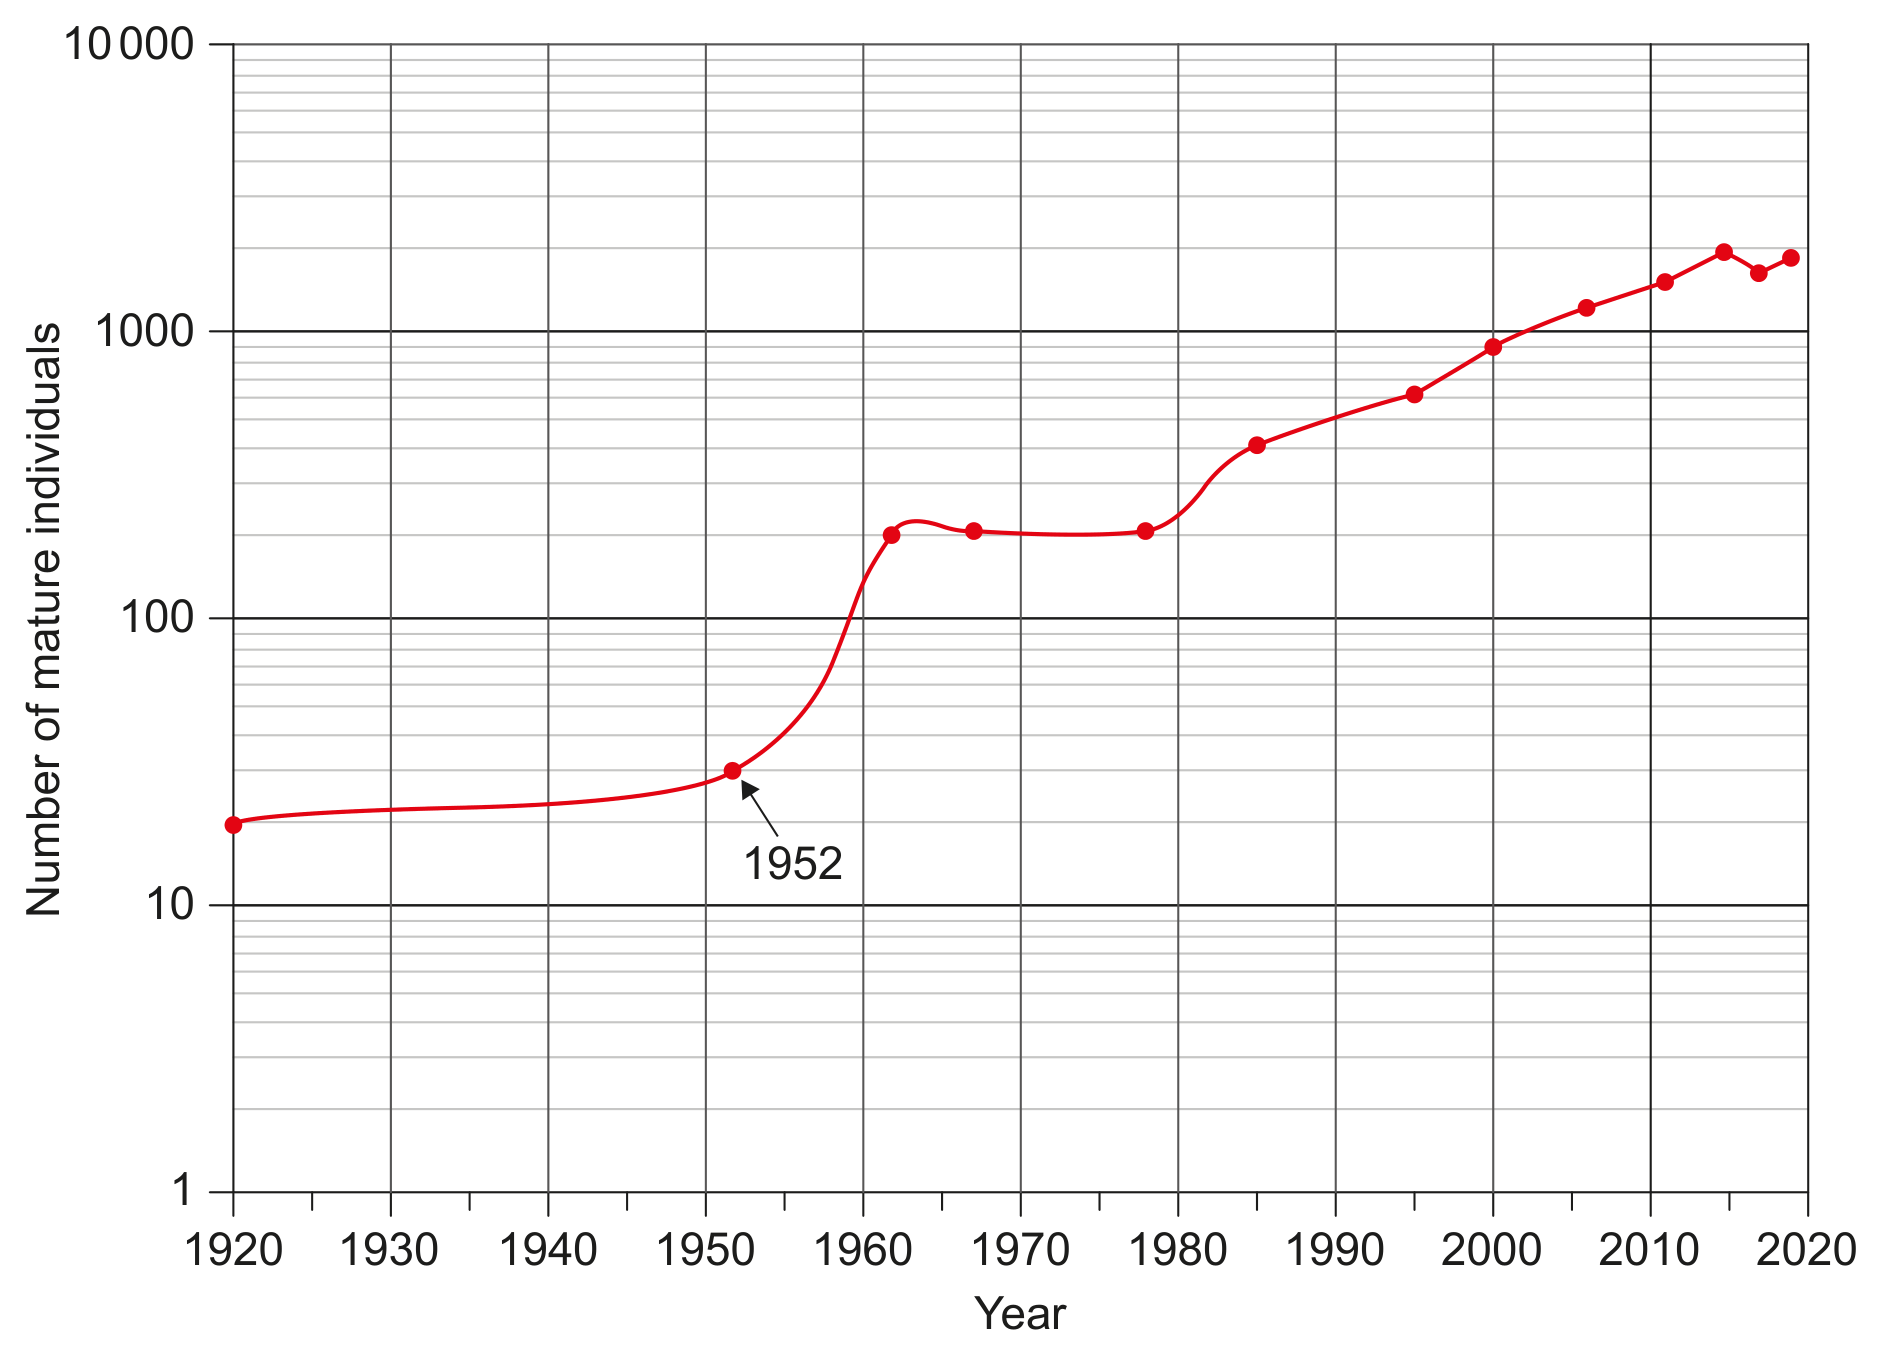
Figure 6(b): Population graph of mature red-crowned cranes

Figure 6(b): Population graph of mature red-crowned cranes

Using Figure 6(b), identify the number of mature red-crowned cranes in 1952 and 2000.

[ 1 ]

Question 2(c)(ii)

(b)

Calculate the average annual increase of mature red-crowned cranes between 1952 and 2000.

[ 1 ]

Question 2(d)

(c)

Figure 6(a): Fact file on red-crowned cranes
In 2000, the IUCN listed red-crowned cranes as Endangered; in 2020 it recommended changing status to Vulnerable.
50% of the world's population is found on Hokkaido; breeding in captivity has been unsuccessful.
Habitat loss occurred because wetlands were drained for agriculture; they are protected from hunting across their habitat.
Winter feeding stations are overcrowded; the Hokkaido resident population has lower genetic variability than the migratory Eurasian population.
They feed on fish, frogs, salamanders, cereal crops and insects, and are considered pests by some farmers.

The IUCN uses criteria to classify a species as Endangered. With reference to Figures 6(a) and 6(b), list two criteria that were met by the red-crowned cranes in 2000.

[ 2 ]

Question 2(e)

(d)

With reference to Figure 6(a), explain why some conservationists disagree with changing the status of the red-crowned crane from Endangered to Vulnerable.

[ 3 ]

Question 2(a)(ii)

[Maximum number: 2]
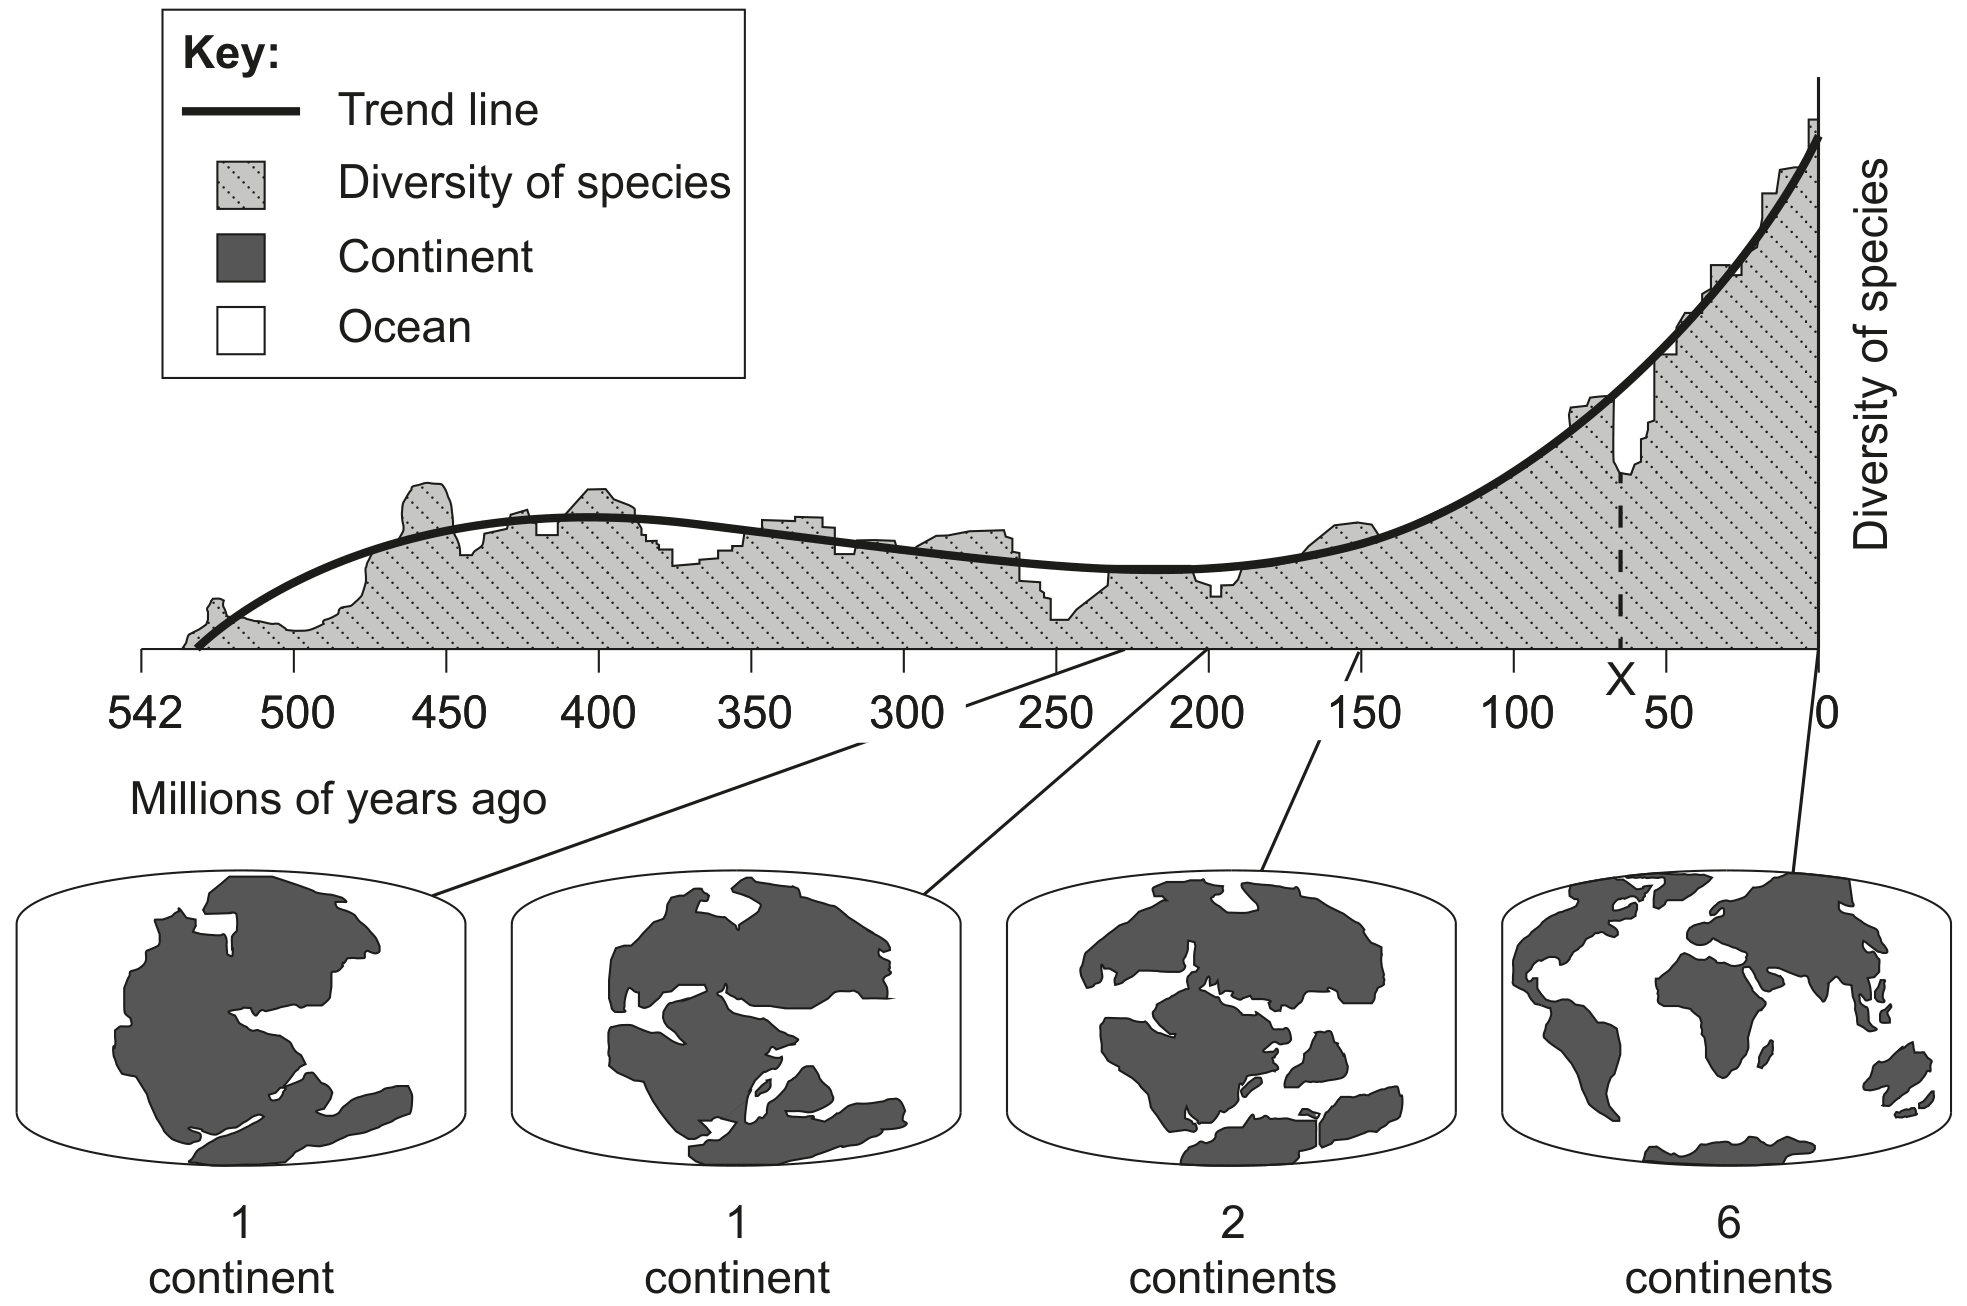
Figure 2: Distribution of continents and diversity of species over time

Figure 2: Distribution of continents and diversity of species over time

Describe what may have caused the deviation from the trend line at point X in

Question 4(a)

[Maximum number: 1]
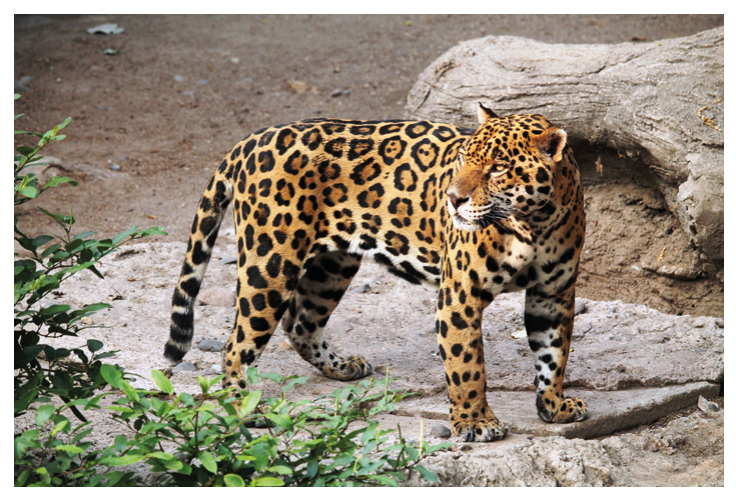
Figure 6(a): Jaguar (Panthera onca)

Figure 6(a): Jaguar (Panthera onca)

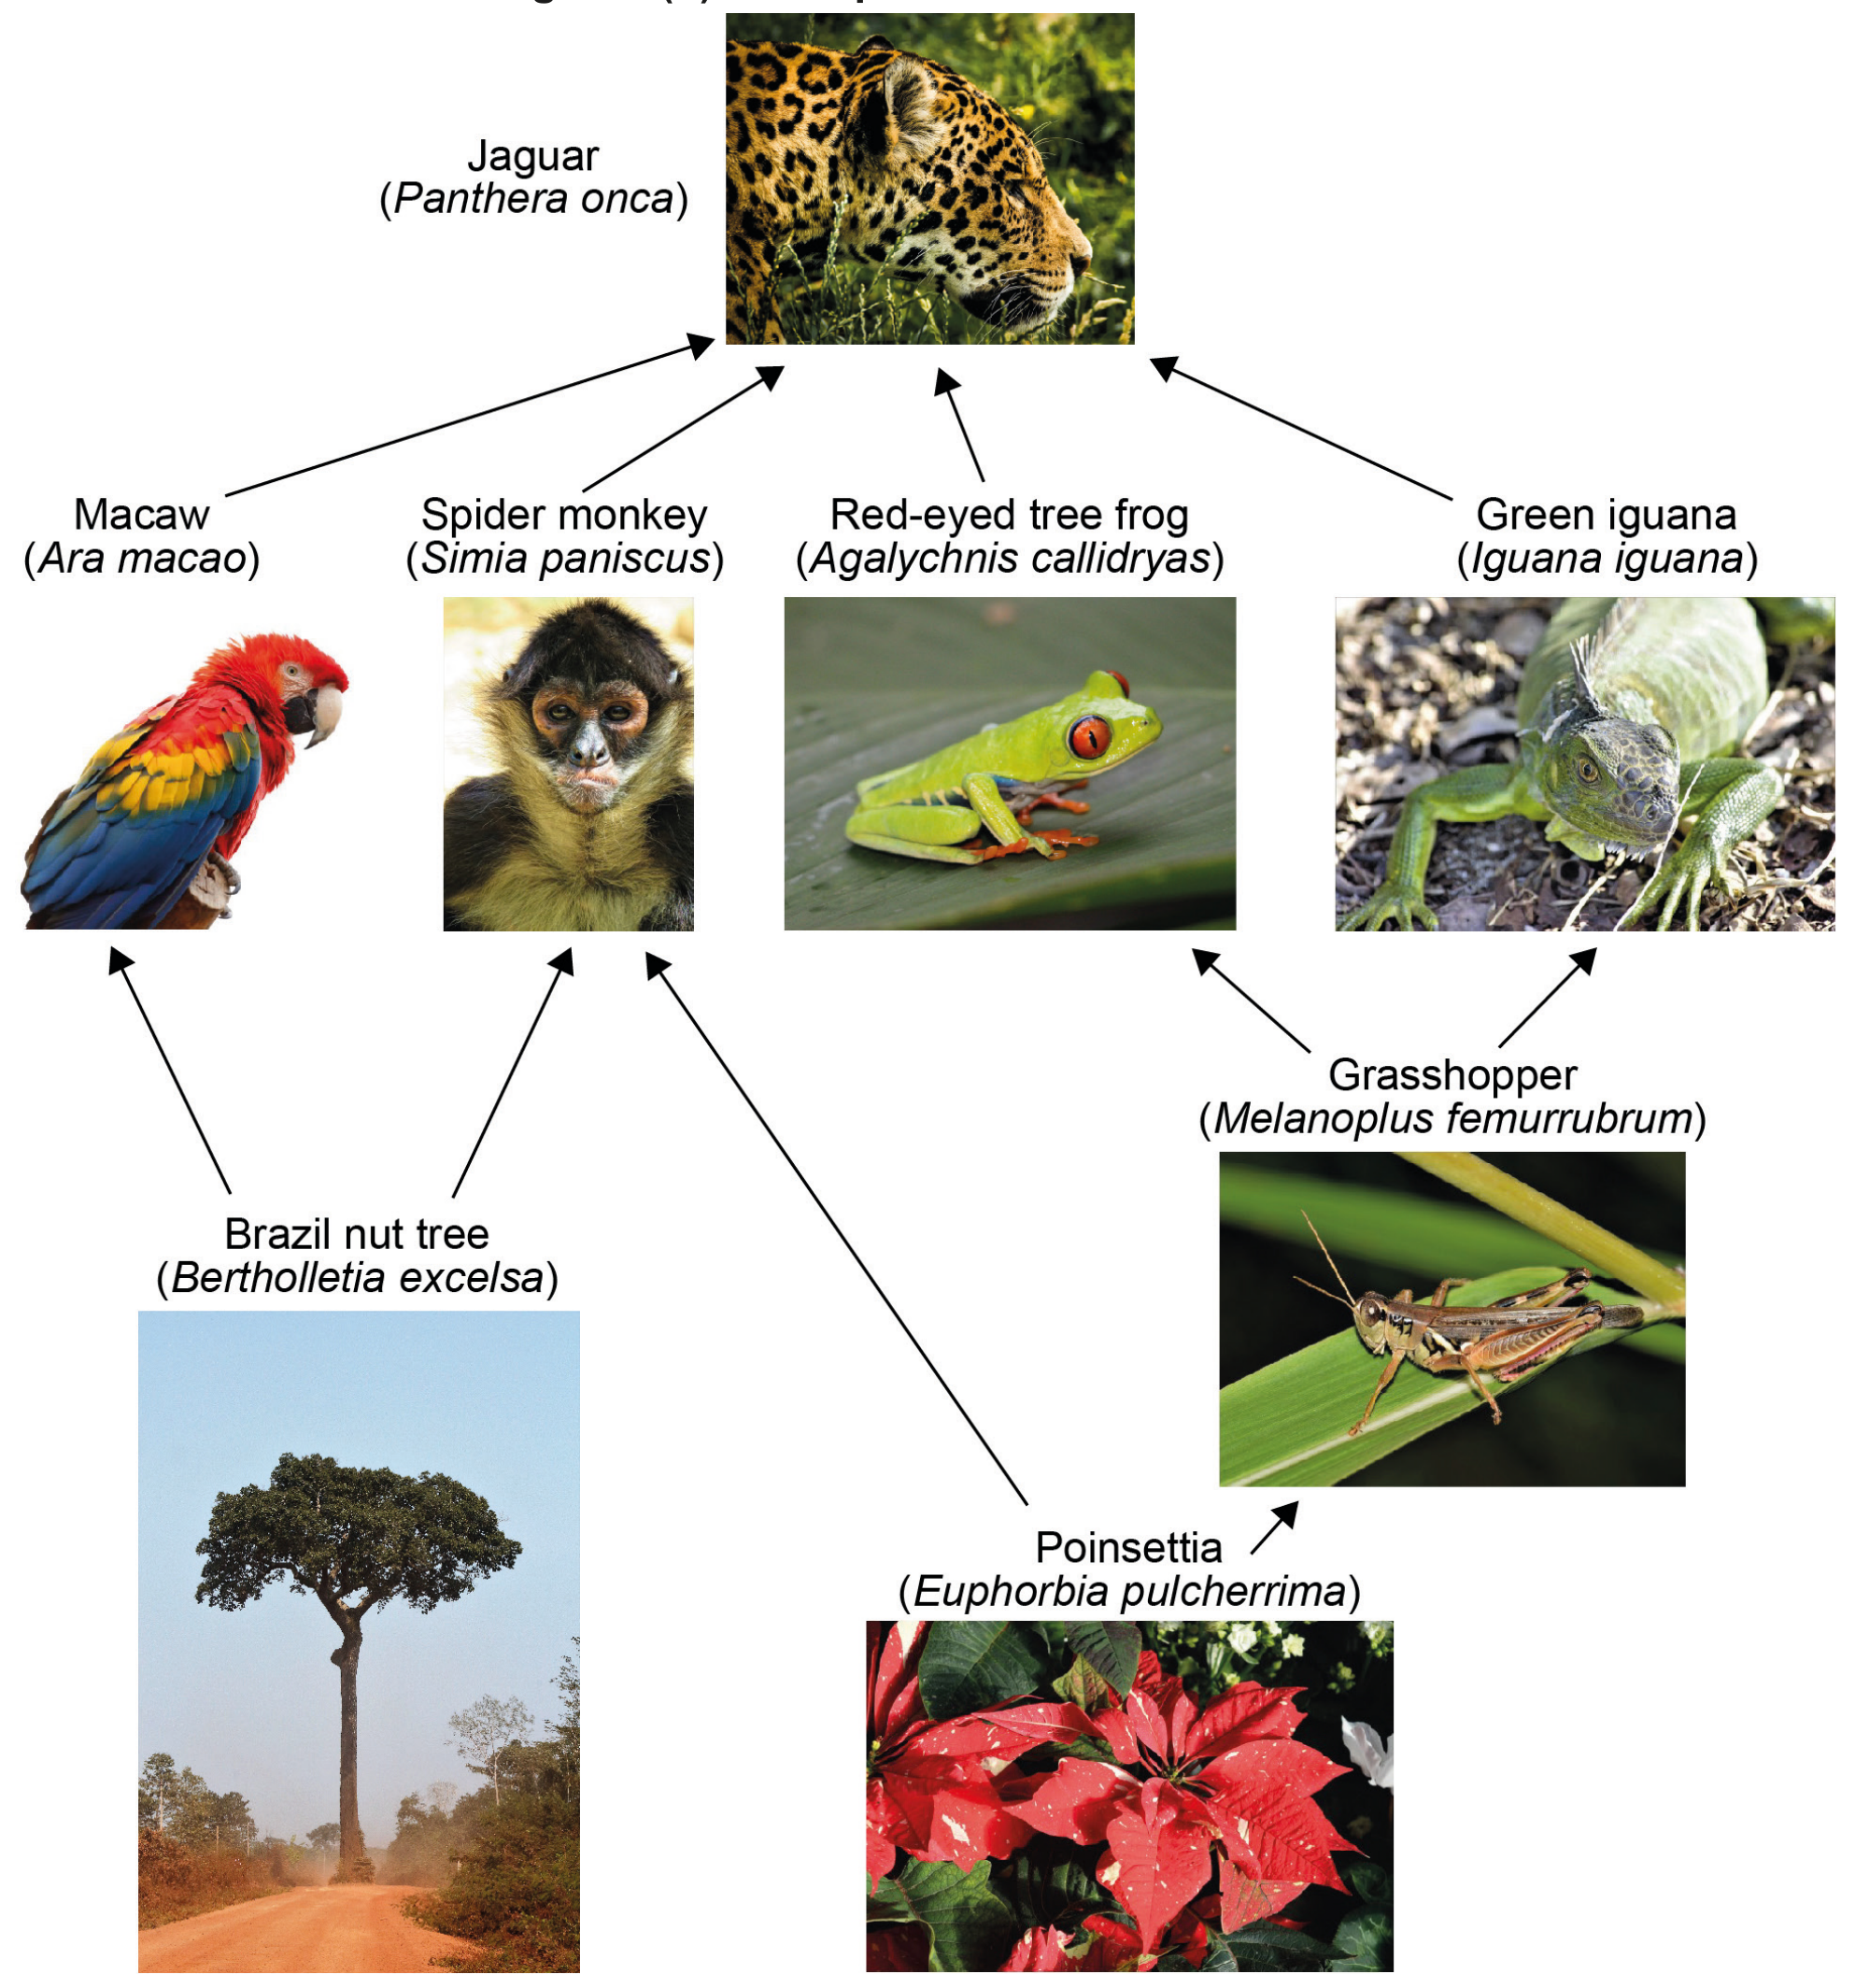
Figure 6(b): Example of a Costa Rican web

Figure 6(b): Example of a Costa Rican web

State one criterion used to determine the IUCN Red List status of the jaguar shown in Figure 6(a).

Question 7(b)

[Maximum number: 2]
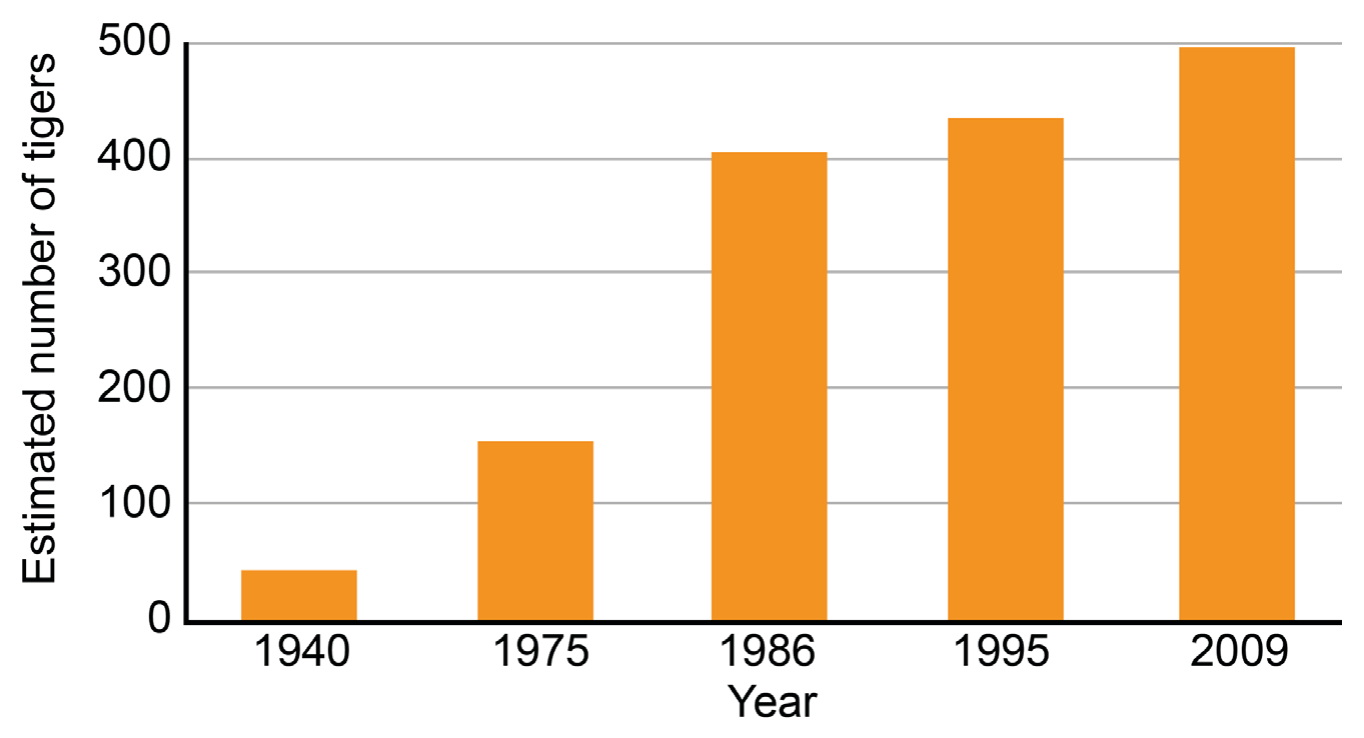
Figure 8(d): Siberian tiger population in Russia

Figure 8(d): Siberian tiger population in Russia

Figure 8(a): Fact file on Siberian tiger
- Historically found in Korea, Eastern China and Siberia; now mainly within Sikhote-Alin mountain range.
- Reduction in tiger population has occurred due to habitat loss from logging/mining, poaching and loss of prey.
- Fewer than 50 individuals remained in the wild in the 1940s; by 2010 this increased to about 500.
- Conservation measures include hunting bans, CITES trade bans, radio-collaring, national parks, policing and enforcement.

Outline why a reduction in the Siberian tiger's population may increase its probability of extinction.

Question 5(c)

[Maximum number: 9]

To what extent is the need for conservation more significant in tropical biomes?

0 selected