Question 2(a)

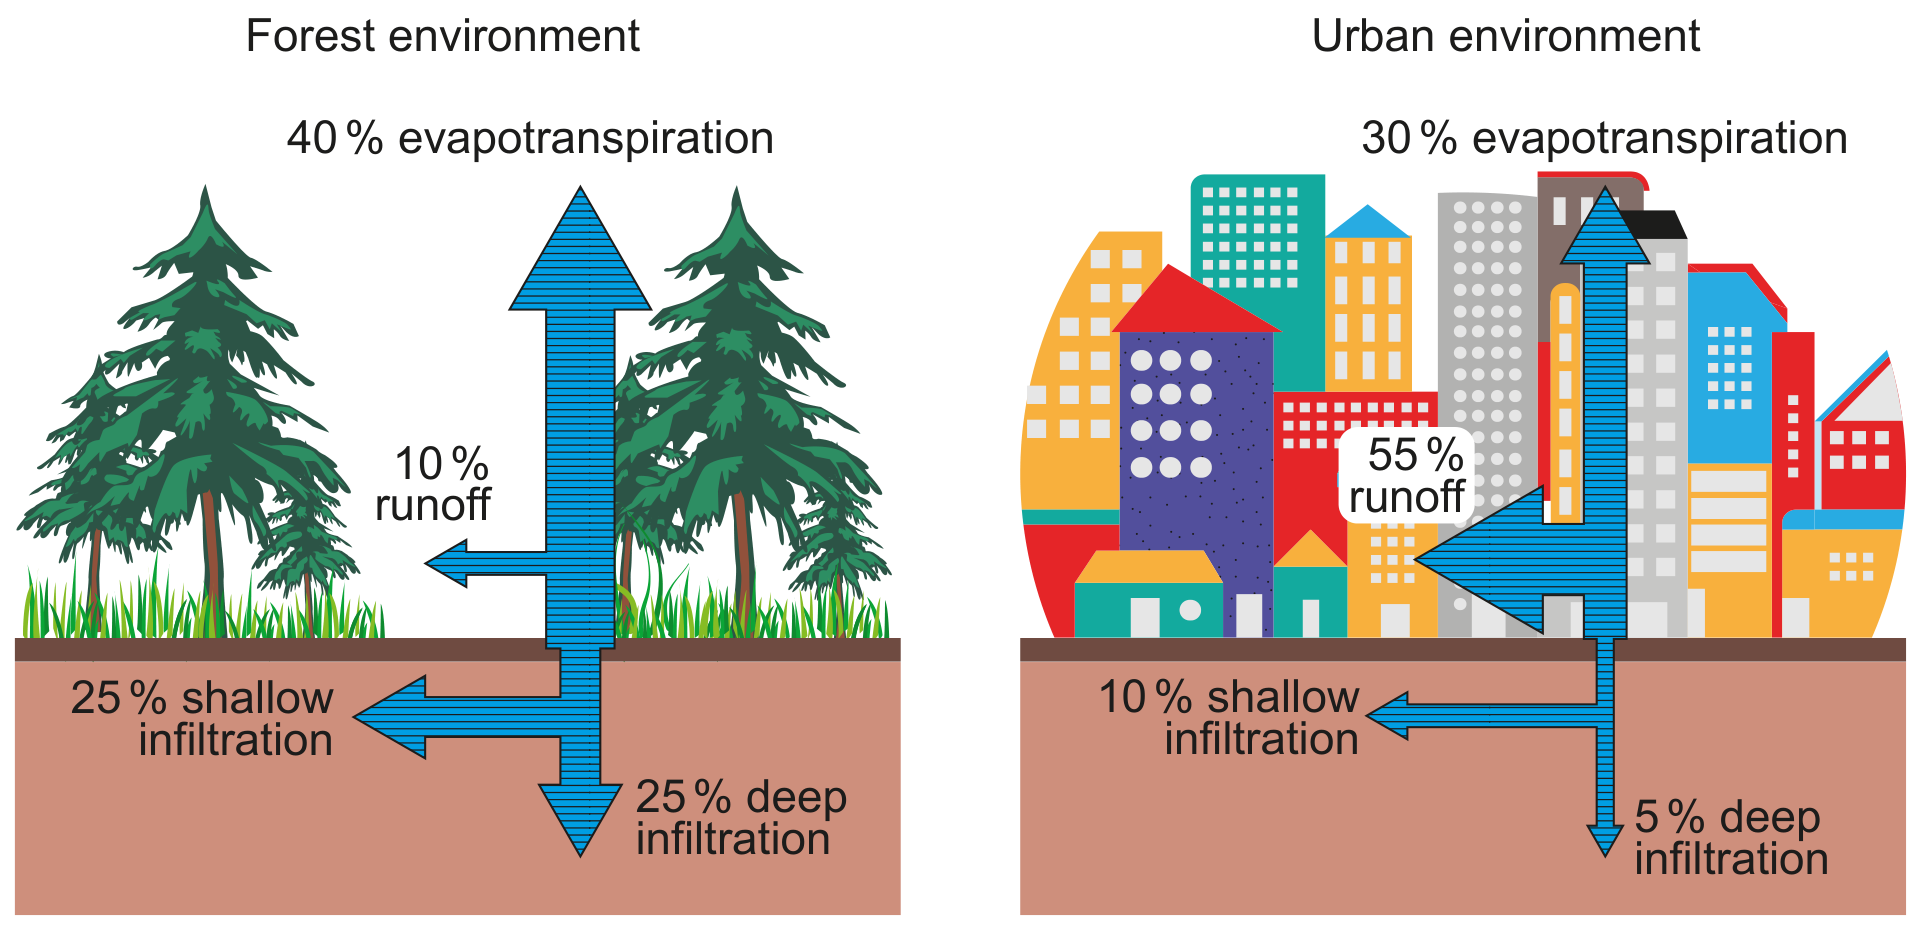
Figure 2(a): Water transfers and transformations after rainfall in forest and urban environments
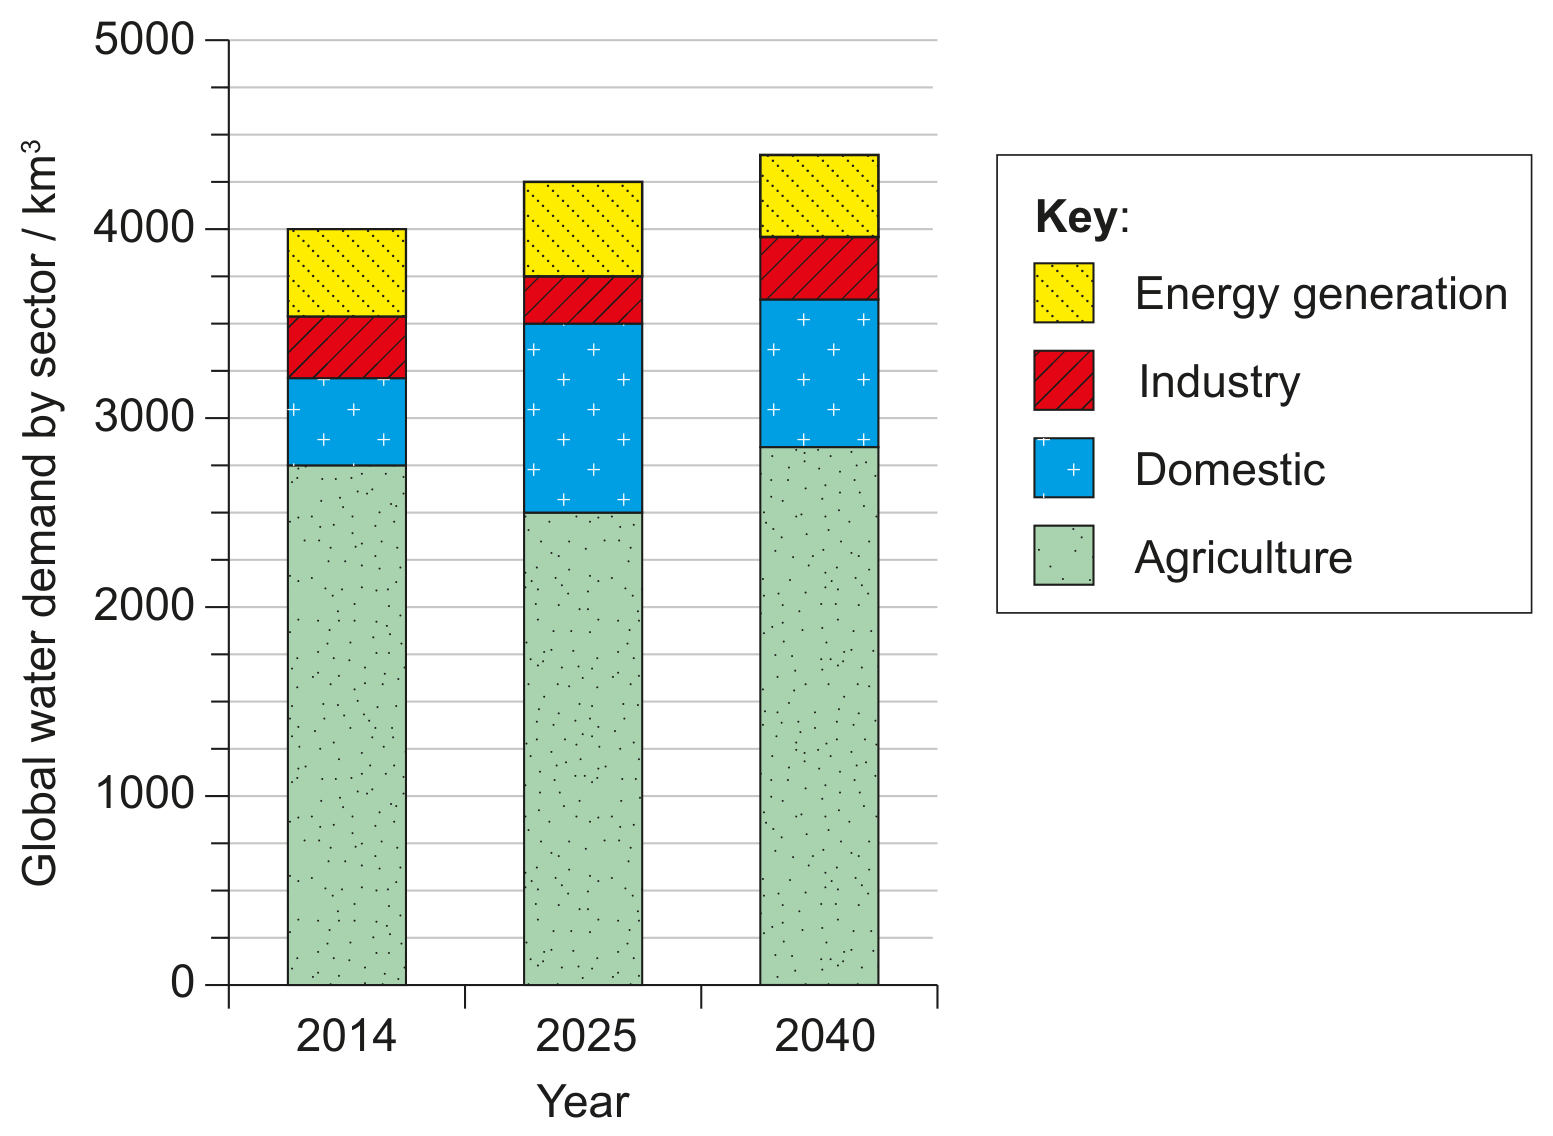
Figure 2(b): Global water demand by sector for 2014, and projected for 2025 and 2040
Identify one transformation shown in Figure 2(a).
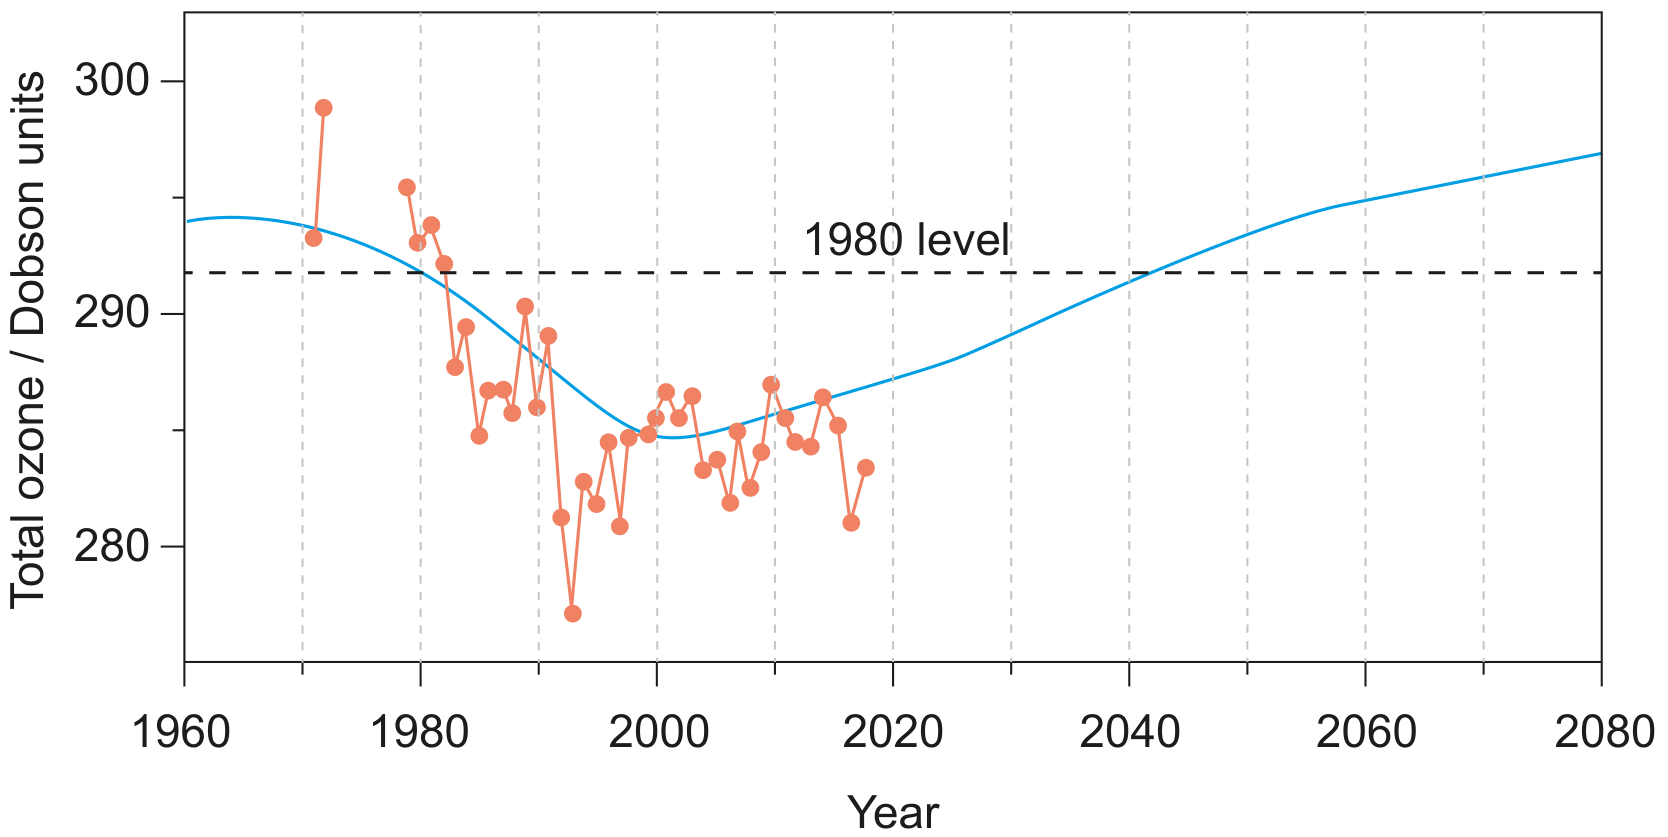
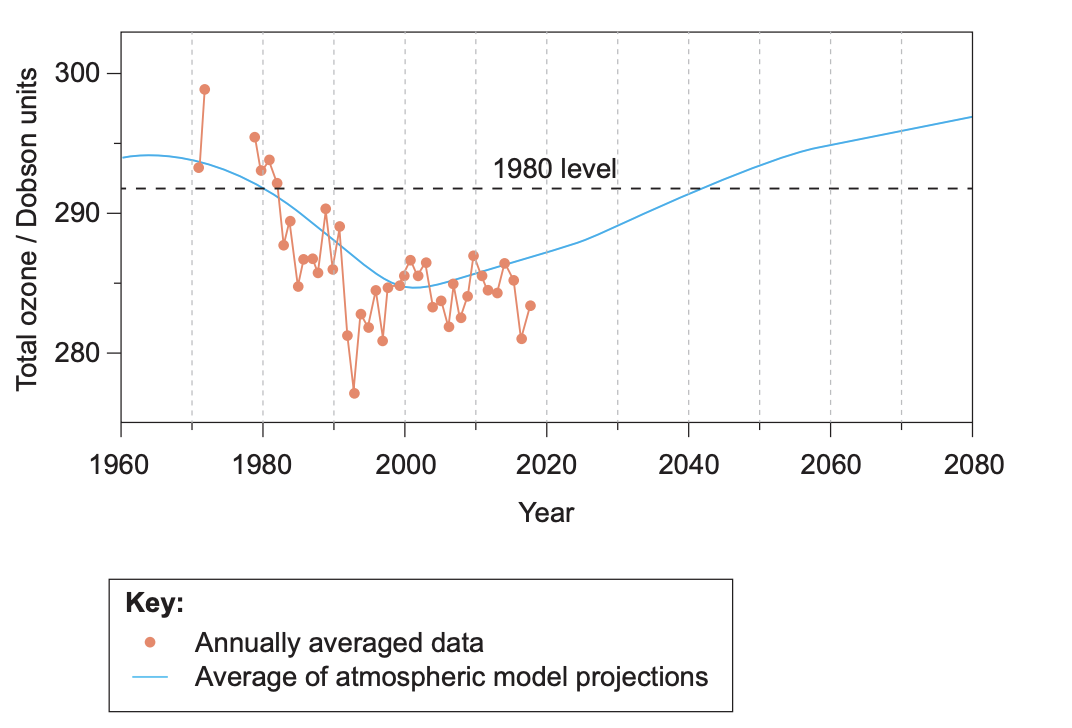
Figure 2(a): Water transfers and transformations after rainfall in forest and urban environments

Figure 2(b): Global water demand by sector for 2014, and projected for 2025 and 2040
Identify one transformation shown in Figure 2(a).
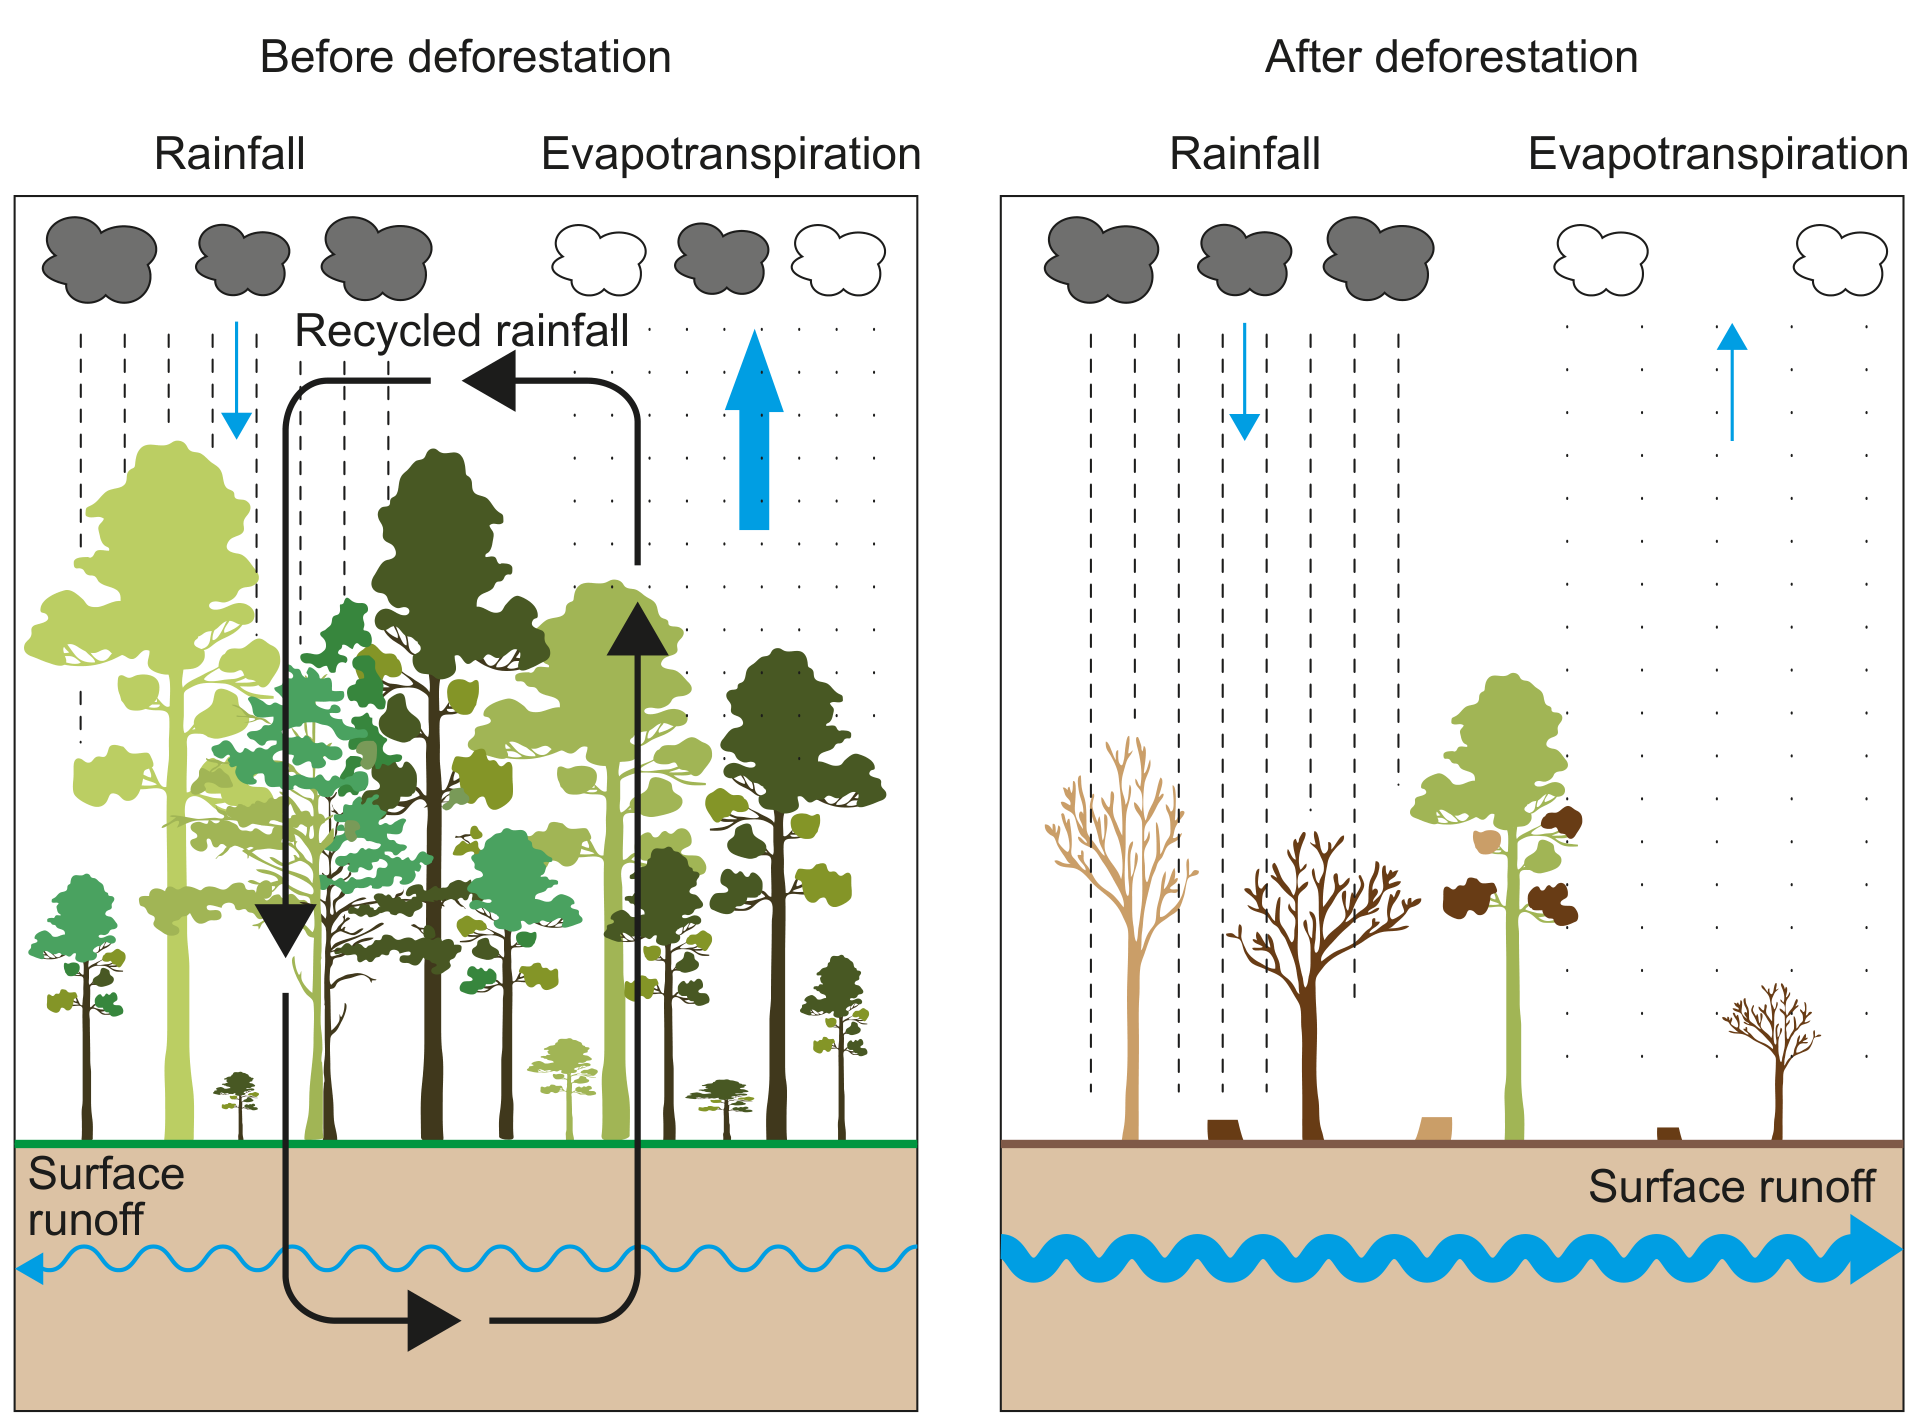
Figure 2: Observed and projected changes in global stratospheric ozone
Key:
- Annually averaged data
- Average of atmospheric model projections
Outline one factor that may affect the reliability of the model projections in Figure 2.

Figure 2: Observed and projected changes in global stratospheric ozone
Outline one factor that may affect the reliability of the model projections in Figure 2.
Figure 7(a): Fact file on Hokkaido's forests
Since the 1950s, natural forests have been replaced by coniferous forest monocultures.
71% of Hokkaido land area is forest; 30% of forest area is coniferous forest monoculture.
A 2006 plan proposed returning one third of coniferous monocultures to natural forests or grasslands to protect biodiversity, protect aquatic recharge areas and improve recreation.
Explain why coniferous forest monocultures have low resilience.

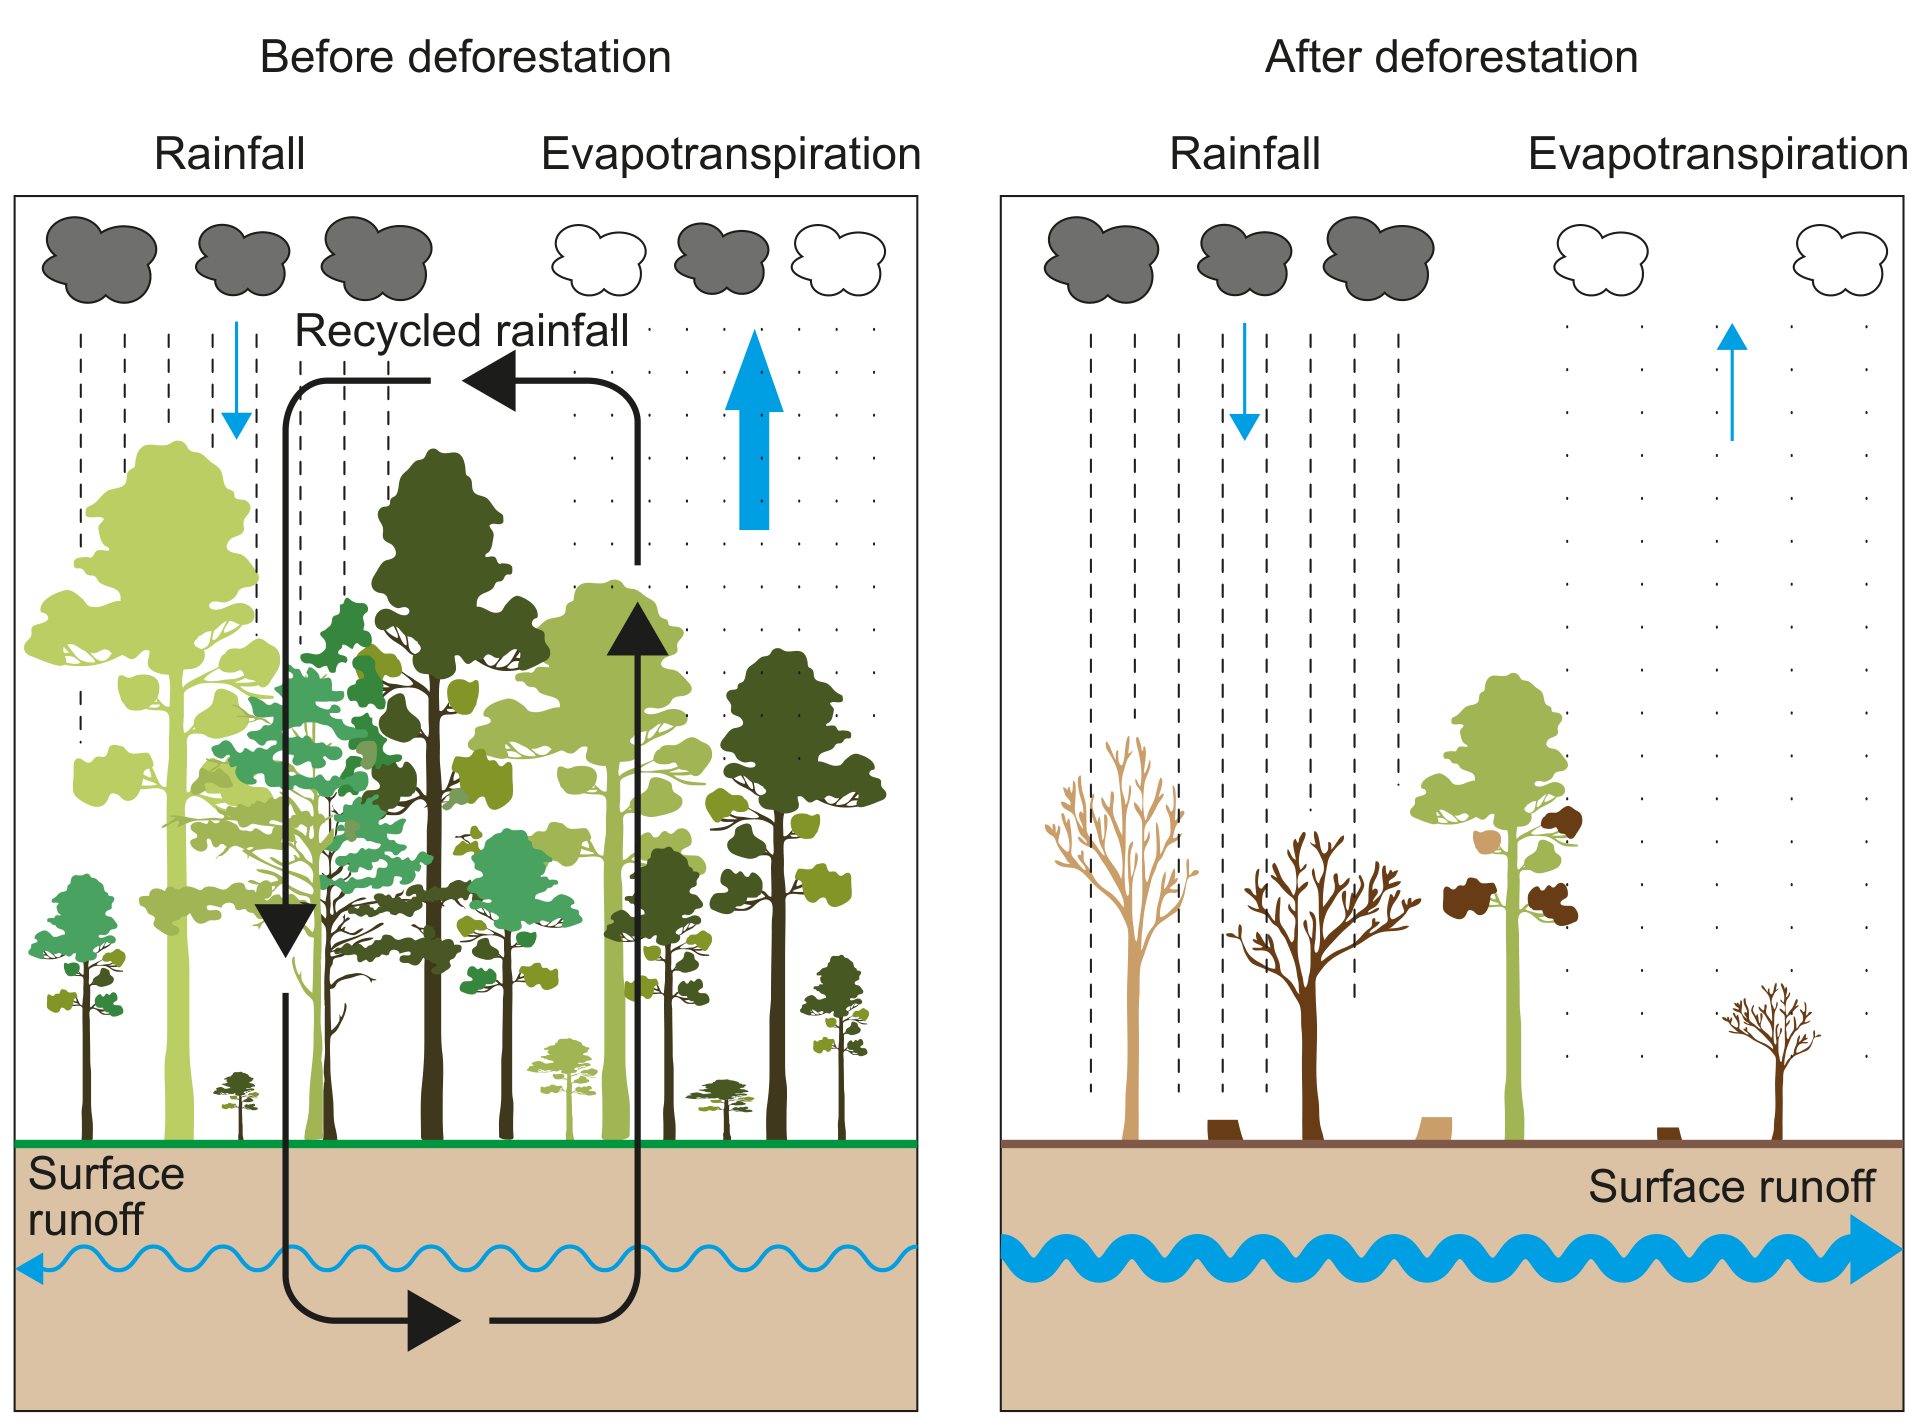
Figure 3: Impact of deforestation on the water cycle
Describe the positive feedback mechanism by which deforestation may decrease the availability of water in certain regions.

Figure 3: Impact of deforestation on the water cycle
Describe the negative feedback mechanism by which cloud formation may moderate global temperature.
Explain how negative and positive feedback mechanisms may influence the growth of decomposer populations in the soil.