
IB ESS 6.2 Climate Change Causes and Impacts Topic Practice

EduNinja

Question 4

[Maximum number: 5]

Land area 103000 km². Terrain is mountainous and volcanic. Iceland is isolated, with low biological diversity and few endemic species. Only 0.7% of land is suitable for growing crops; harsh climate limits farming to livestock and geothermally heated greenhouses. 60% of the population live in Reykjavik. Total fertility rate is two children per woman. Important industries include fishing, aluminium smelting and tourism. Ecological footprint is 7.4 GHa compared with a world average of 2.6 GHa. Iceland is a high income representative democracy ranked 13th on the HDI. It was badly affected by the global financial crisis in 2008. Hydroelectric and geothermal power provide 85% of primary energy. Iceland expects to be energy independent using 100% renewable energy by 2050. The government recently approved oil exploration in Icelandic waters.
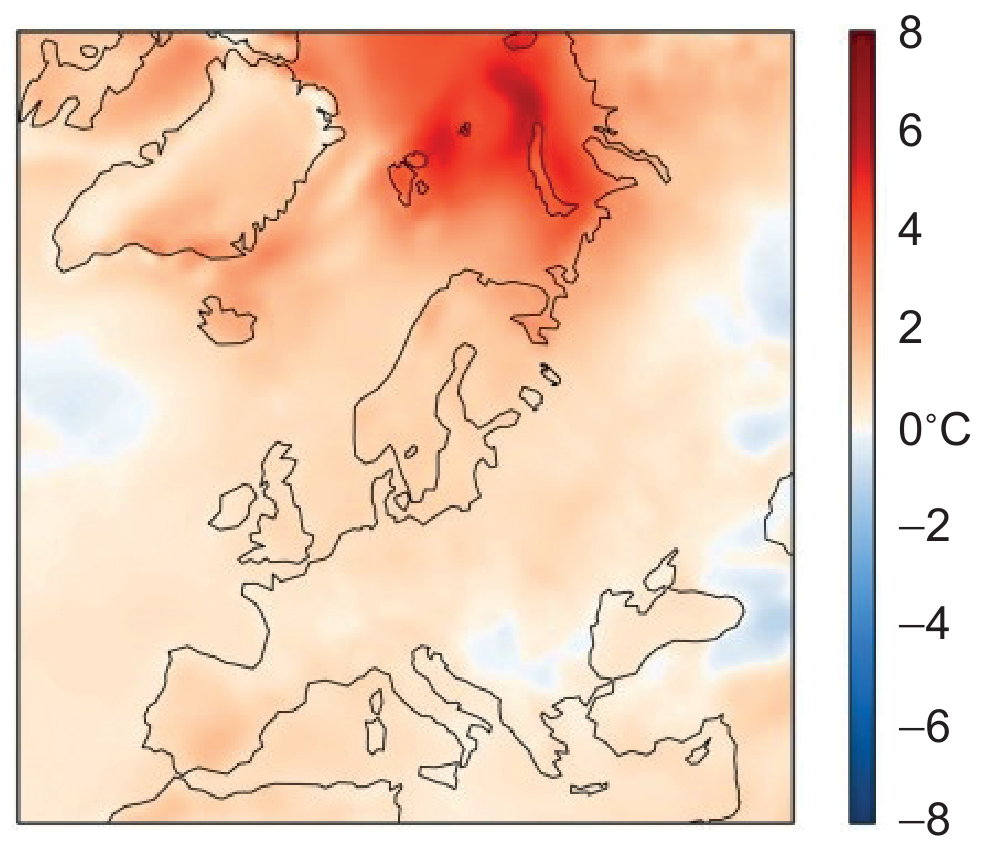
Figure 4(b): Surface air temperature anomaly for May 2016 to April 2017

Figure 4(b): Surface air temperature anomaly for May 2016 to April 2017

Estimated worldwide population is twelve million. 60% of the world’s puffins live in Iceland. Puffins lay one egg per year in cliff burrows in June-July and adults bring small fish to their young. They are classified as vulnerable on the IUCN Red List and the current population is in decline. Threats include overfishing, native predators, introduced predators, hunting and egg collection by humans, oil spills, extreme weather and tourist disturbance. Puffins can be hunted legally in Iceland in April by sky fishing; their meat and eggs are commonly featured on hotel menus. Puffin populations are affected by extreme weather and food availability.
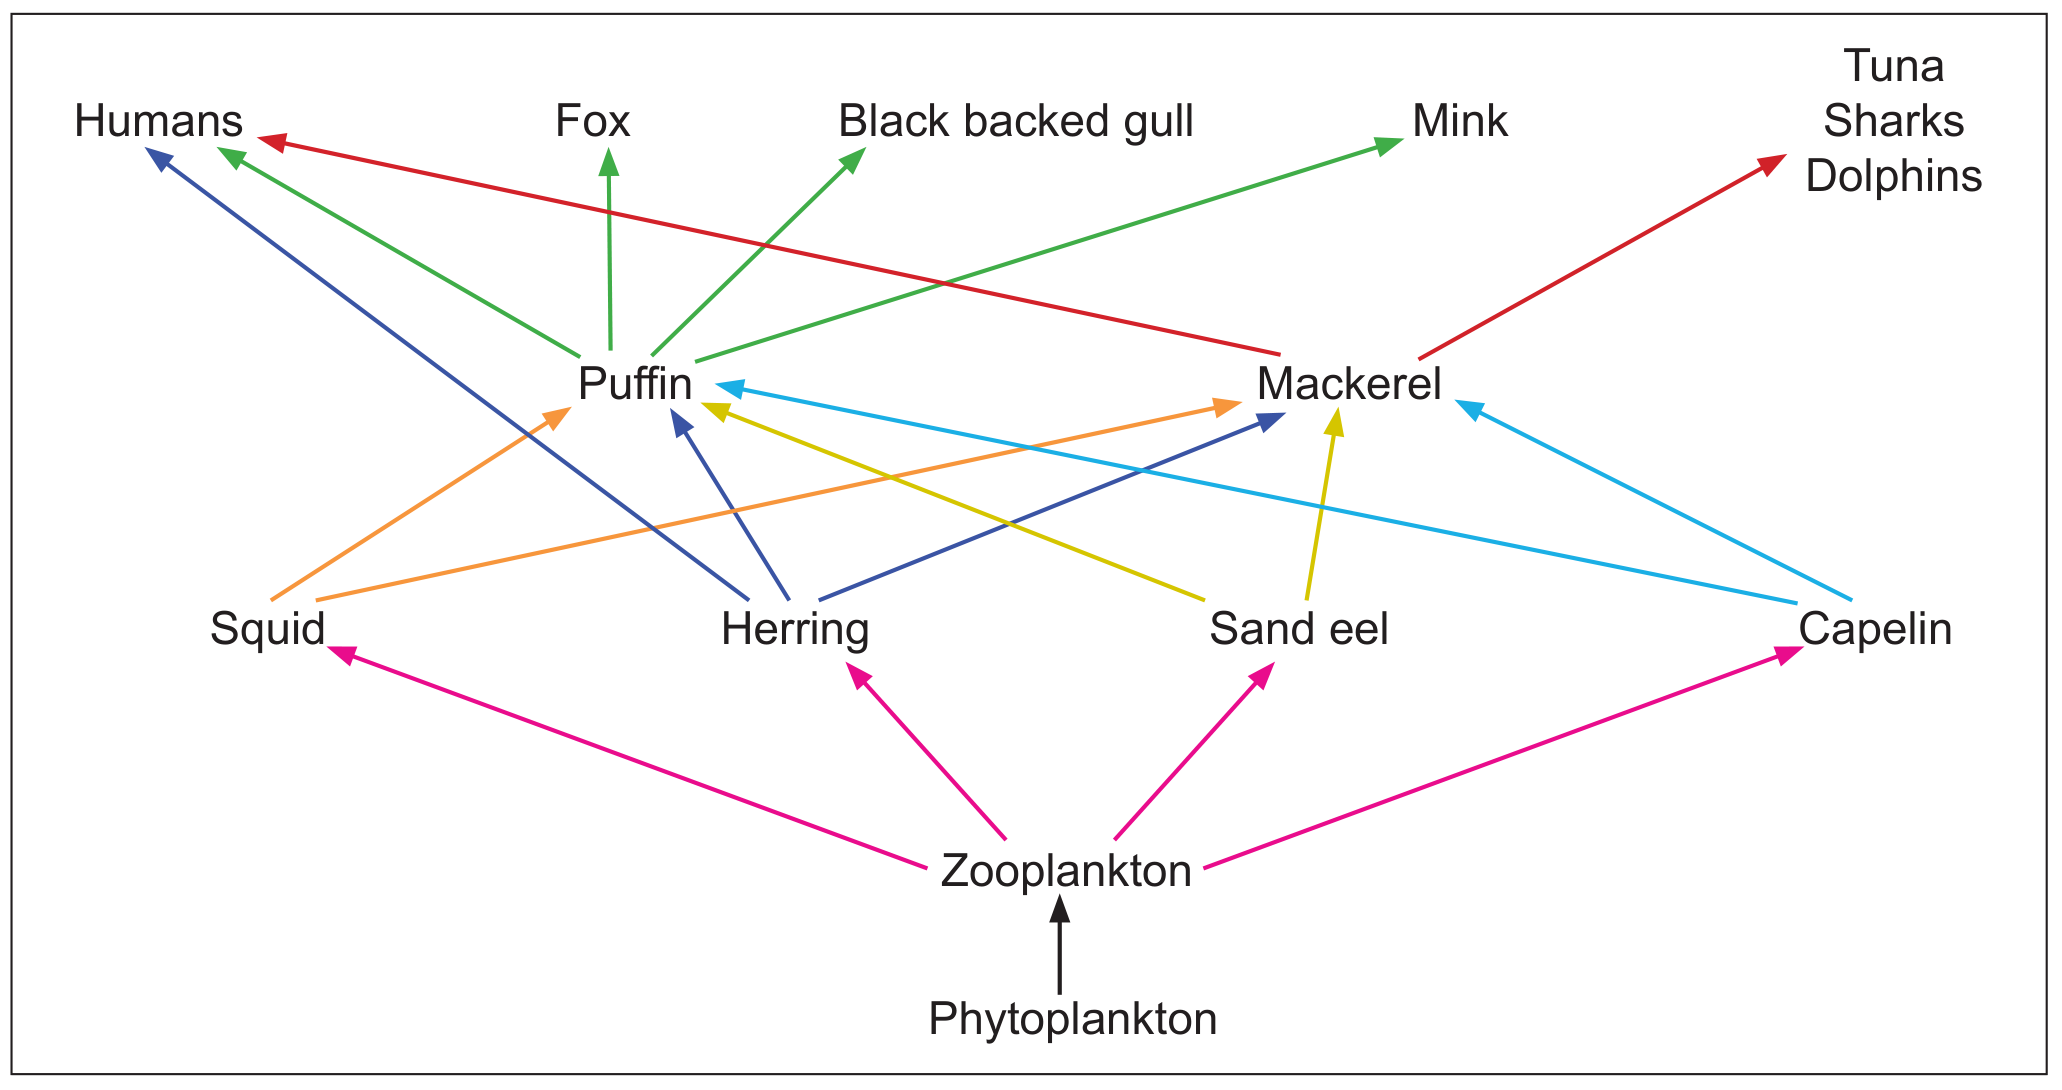
Figure 8(c): Food web for the Atlantic puffin
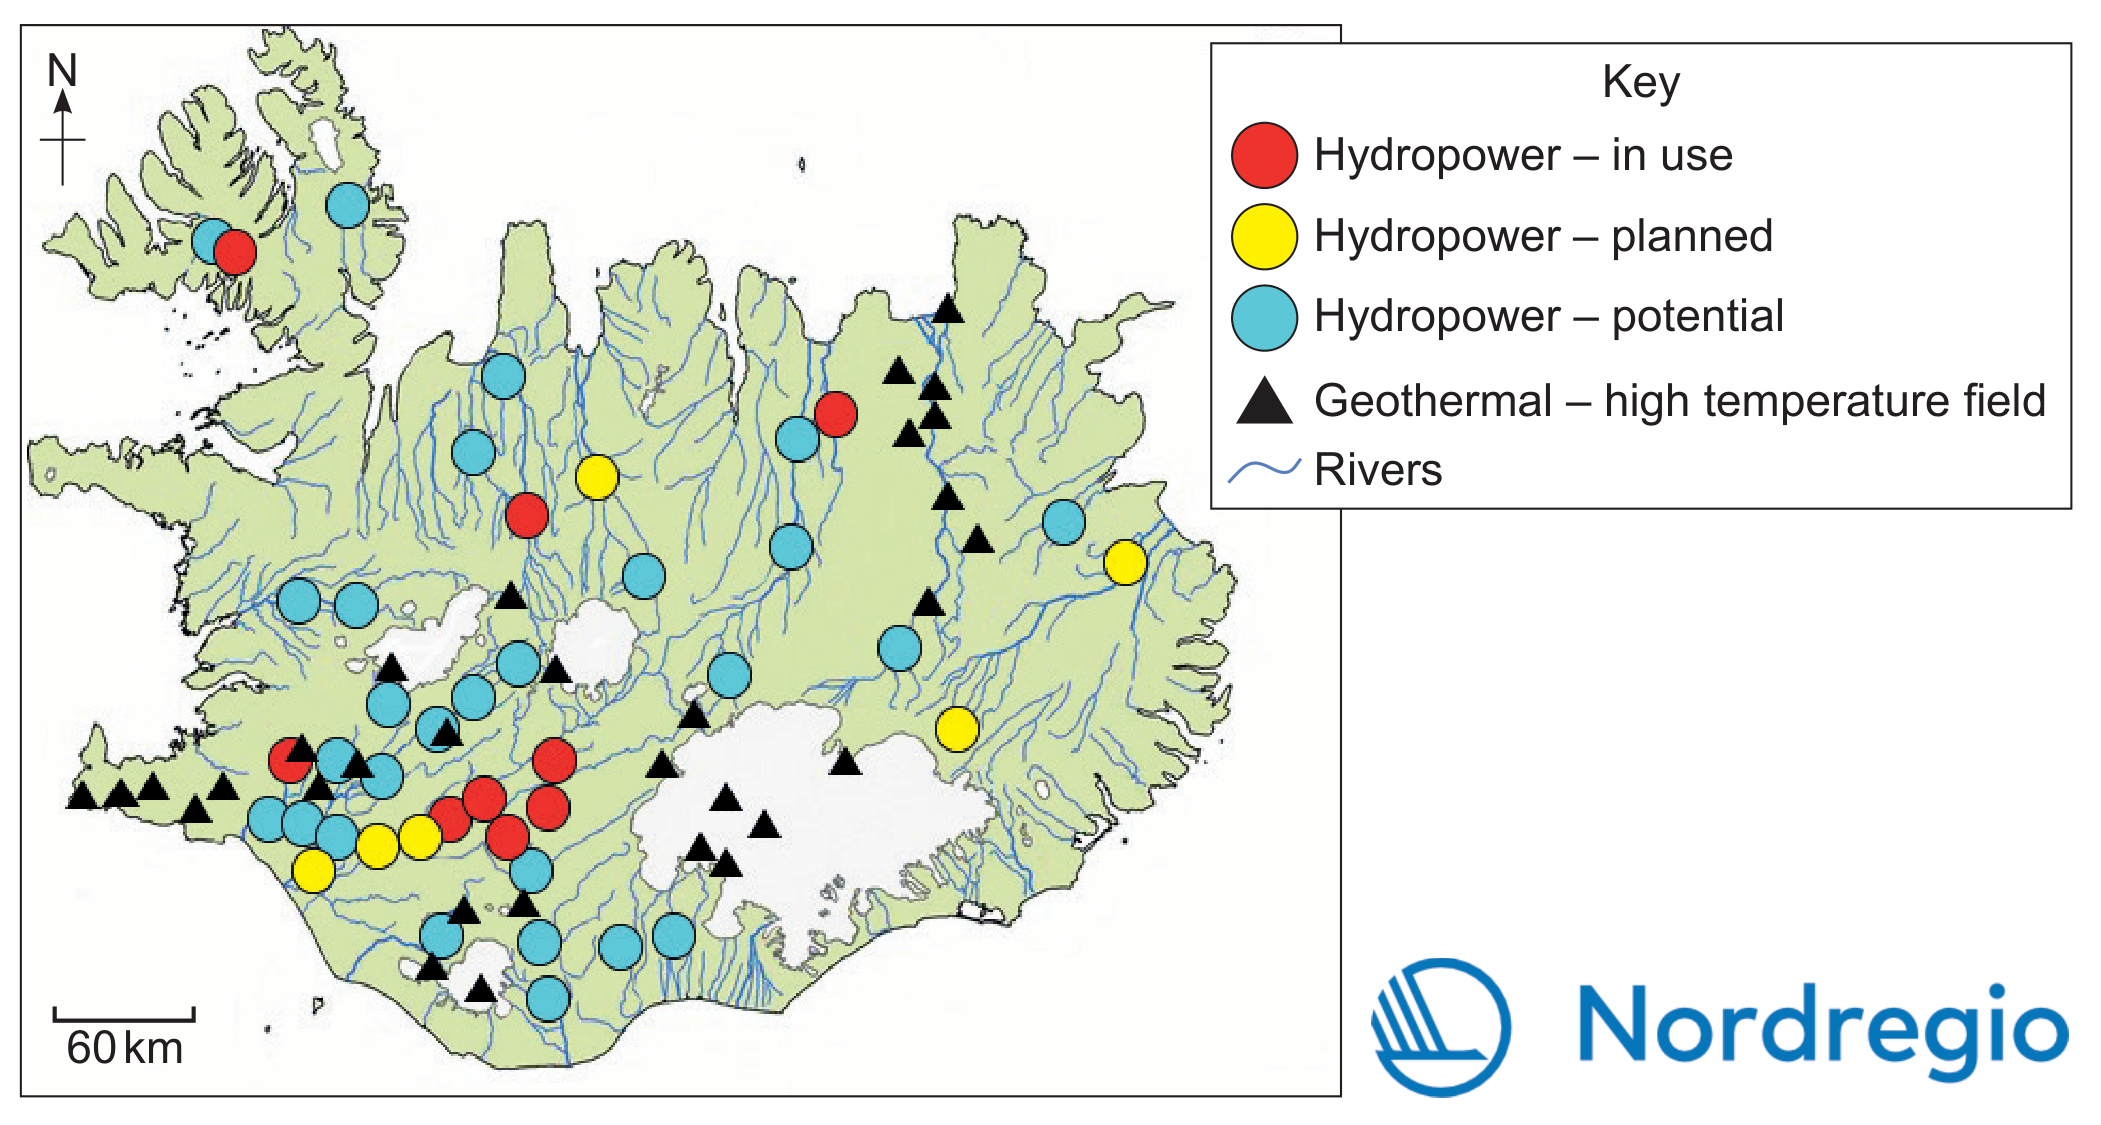
Figure 8(c): Food web for the Atlantic puffin

Figure 9(b): Hydropower and geothermal energy resources in Iceland

Figure 9(b): Hydropower and geothermal energy resources in Iceland

Evaluate the possible impacts of climate change on Iceland.
Question 9

[Maximum number: 2]

Figure 7: Threats to biodiversity and ecosystems within the Coral Triangle
- Coral reefs and mangroves in the Coral Triangle have declined by over 40%40 \% since the 1970 s.
- Over 85%85 \% of coral reefs are under threat from population growth and human activity.
- Mangroves have commonly been removed to make way for agriculture, aquaculture or urban development.
- Increase in unsustainable fishing practices, because of the demand for marine resources, has led to the decline of many species, such as bigeye tuna (Thunnus obesus) and yellowfin tuna (Thunnus albacares).
- Destructive fishing methods that impact marine habitats have been used throughout the region, such as use of dynamite and cyanide.
- Demand for wildlife goods such as turtle products and shark fins (used to make shark-fin soup) has caused a reduction in population numbers of some species.
- Land-based pollution from agriculture, logging, mining and urban development has damaged habitats within the Coral Triangle.

Large-scale tourism development also threatens the Coral Triangle through:
- pollution produced by tourists, such as sewage effluent, plastic waste materials
- coral trampling by snorkelers and divers
- physical damage caused by boat anchors ripping up corals and seagrass
- stress to marine wildlife caused by tourists following them too closely
- collection of wildlife souvenirs, such as corals, shellfish or turtle shells.

Climate change is a major threat to the Coral Triangle. The World Wide Fund for Nature (WWF) estimates that at current rates of global temperature increase, most coral reefs could be destroyed by 2050 .

Outline two possible effects of climate change on marine coastal ecosystems within the Coral Triangle.

Question 5(b)

[Maximum number: 7]

Explain how human impacts on the atmosphere may influence the productivity of terrestrial biomes.

Question 6(c)

[Maximum number: 9]

Using examples, discuss the potential impacts of climate change on ecosystem services.

Question 5(a)(i)

[Maximum number: 1]

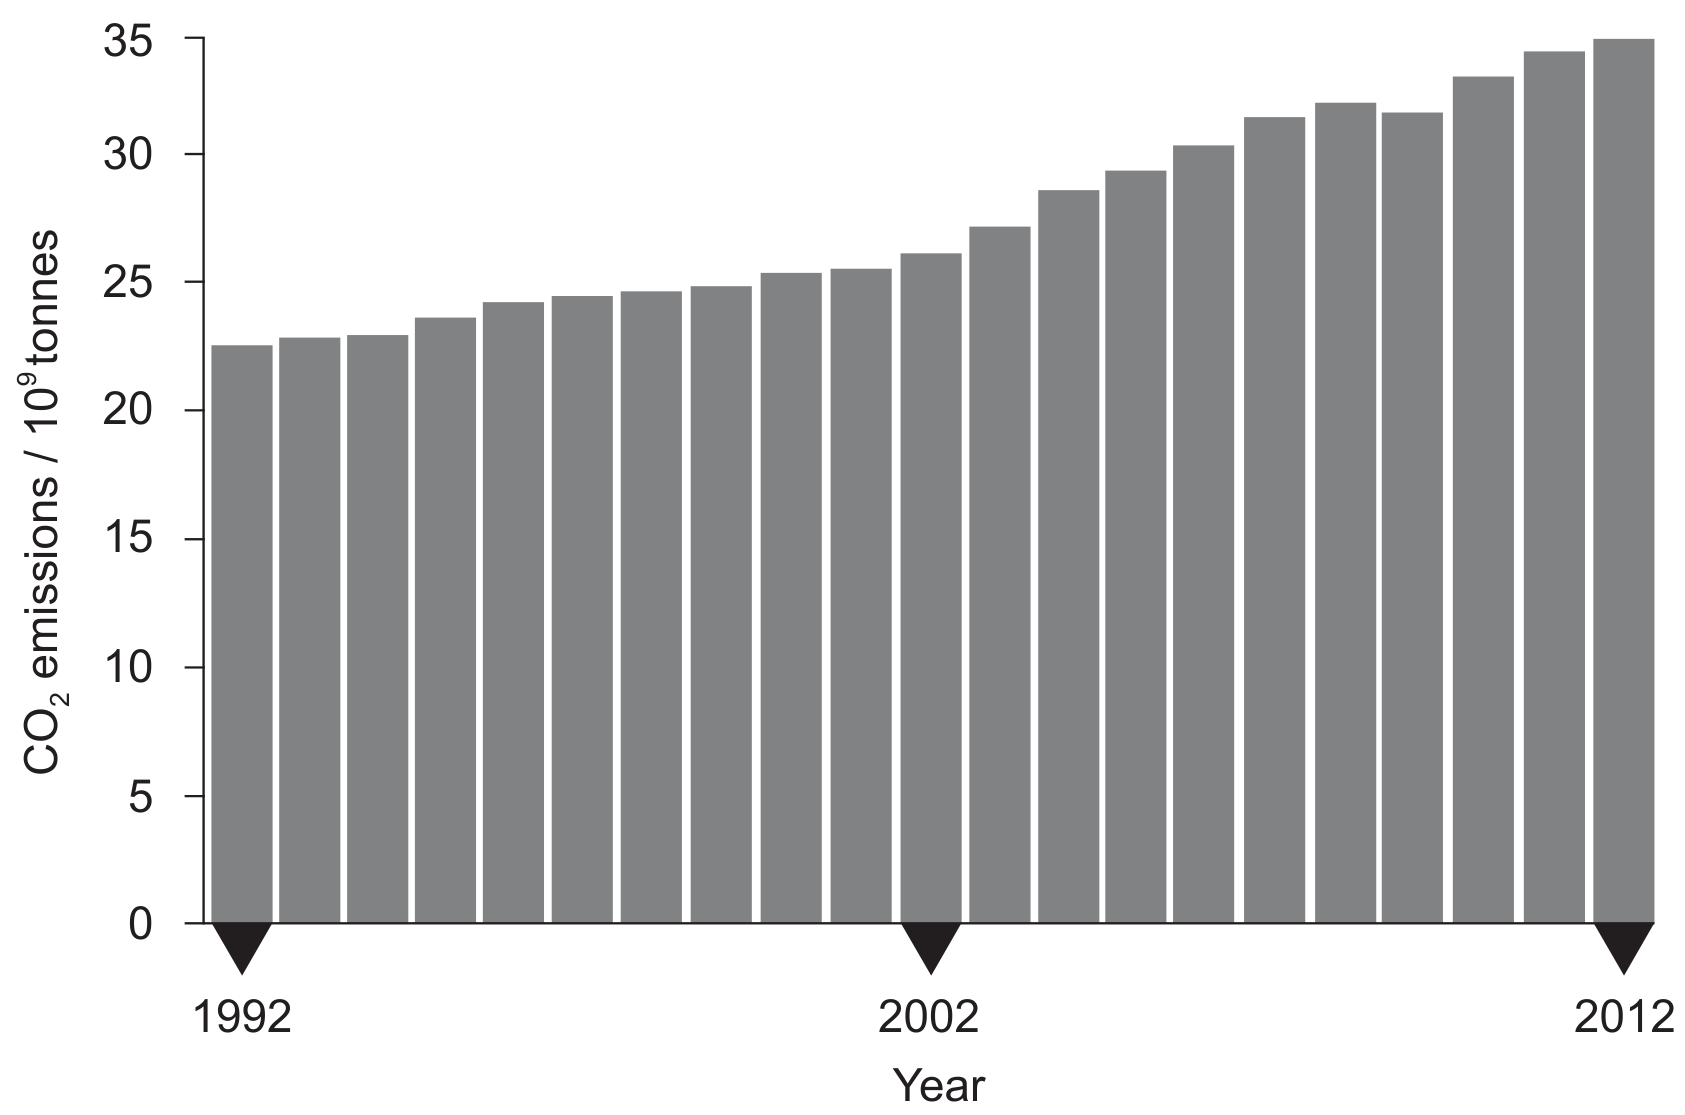
Figure 6: The graph below shows the global CO2\mathrm{CO}_{2} emissions from 1992 to 2012.

Figure 6

Figure 6

Calculate the percentage increase of global CO2\mathrm{CO}_{2} emissions from 1992 to 2012.

Question 6(b)

[Maximum number: 7]

In 2016, the Earth's atmospheric levels of carbon dioxide reached 400 ppm .

Suggest the potential impacts of high levels of greenhouse gases on human societies in different locations.

Question 6(a)

[Maximum number: 4]

Outline the albedo effect and its role in regulating the Earth's global temperature.

0 selected