IB ESS 2.4 Climate and Biomes Topic Practice

EduNinja

Question 1

Question 1(a)

(a)

Using Figure 2(b), state the annual temperature range for Sapporo.

[ 1 ]

Question 1(b)

(b)
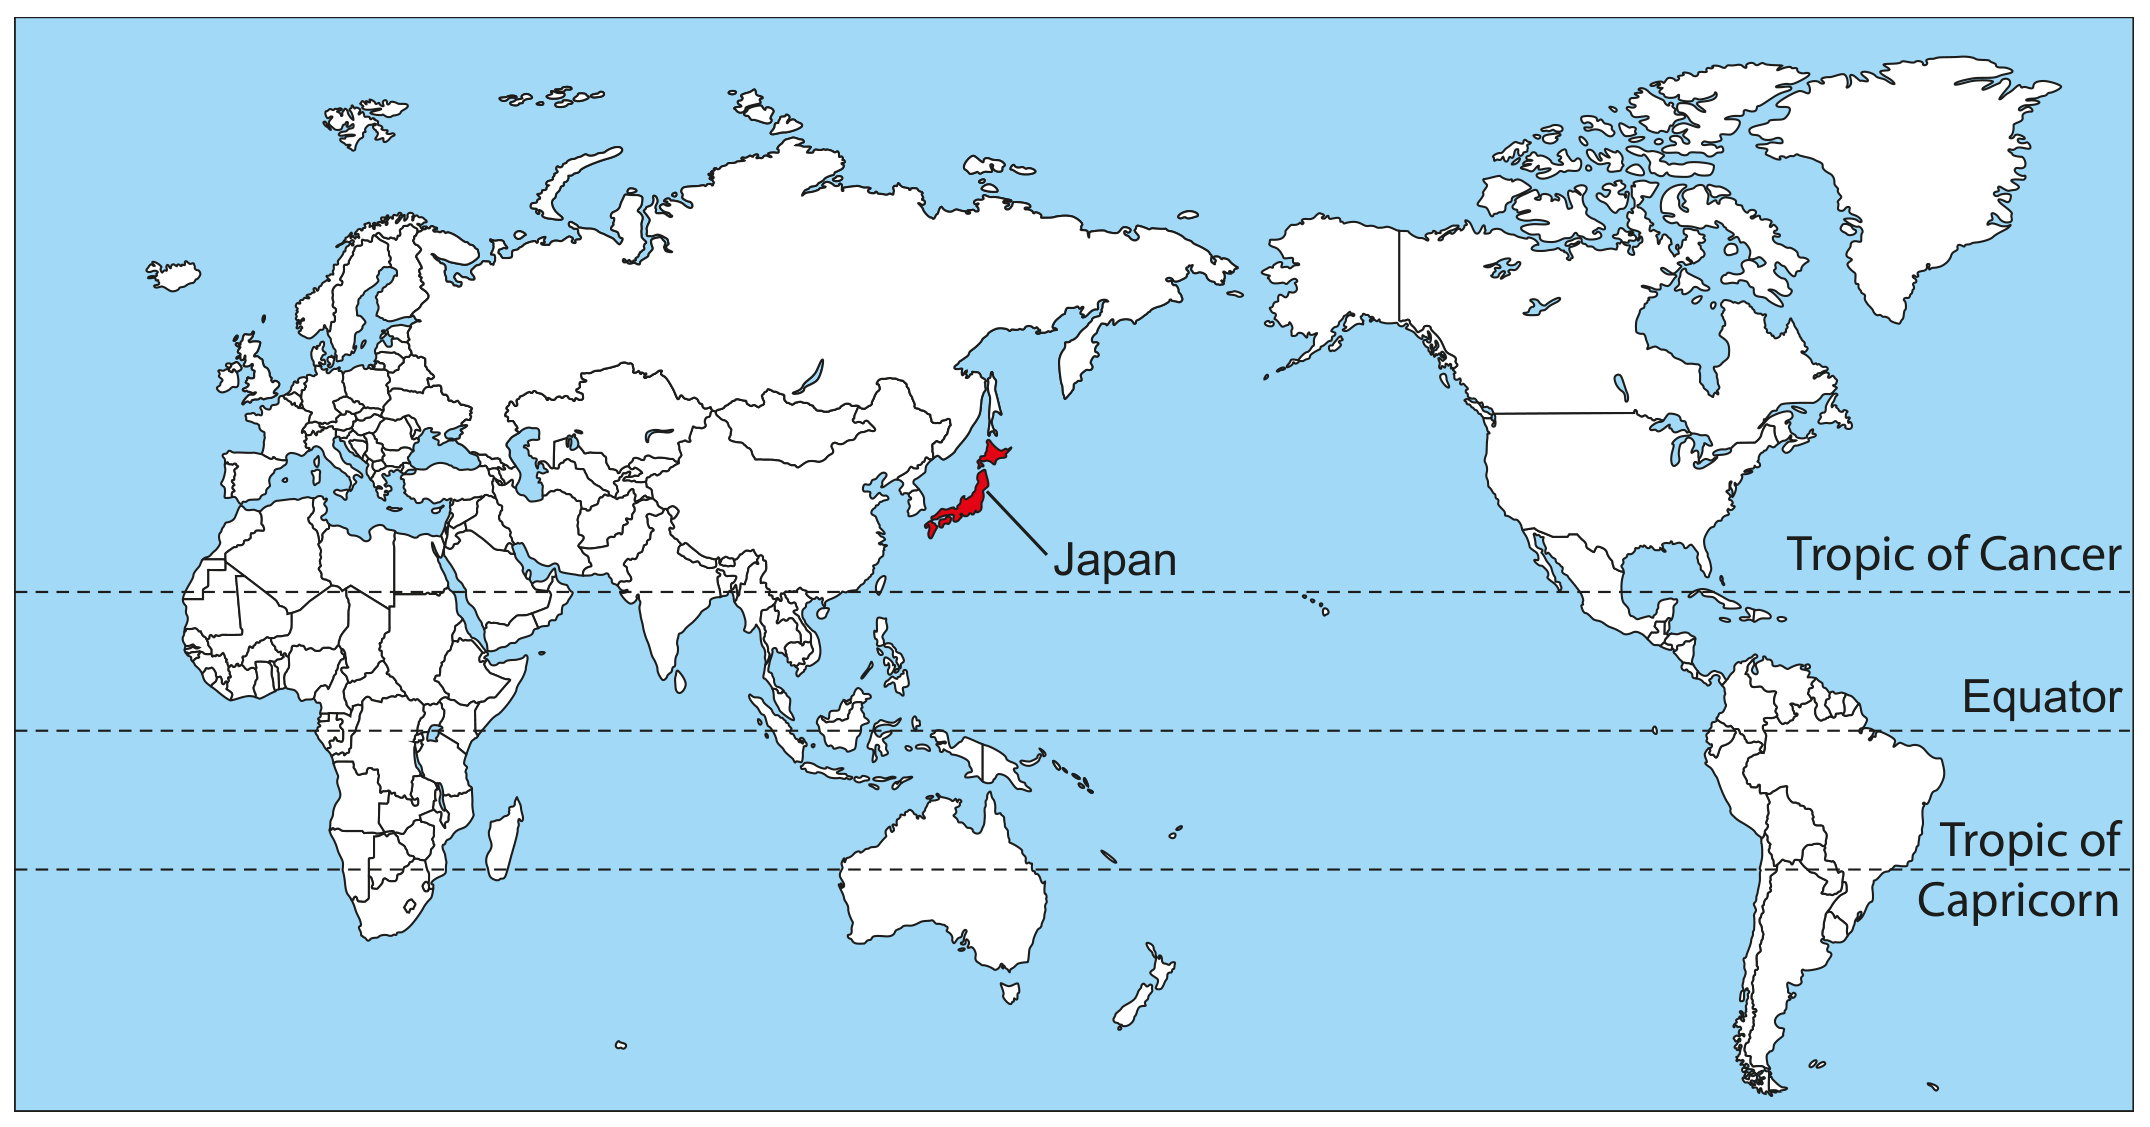
Figure 1(a): World map showing location of Japan
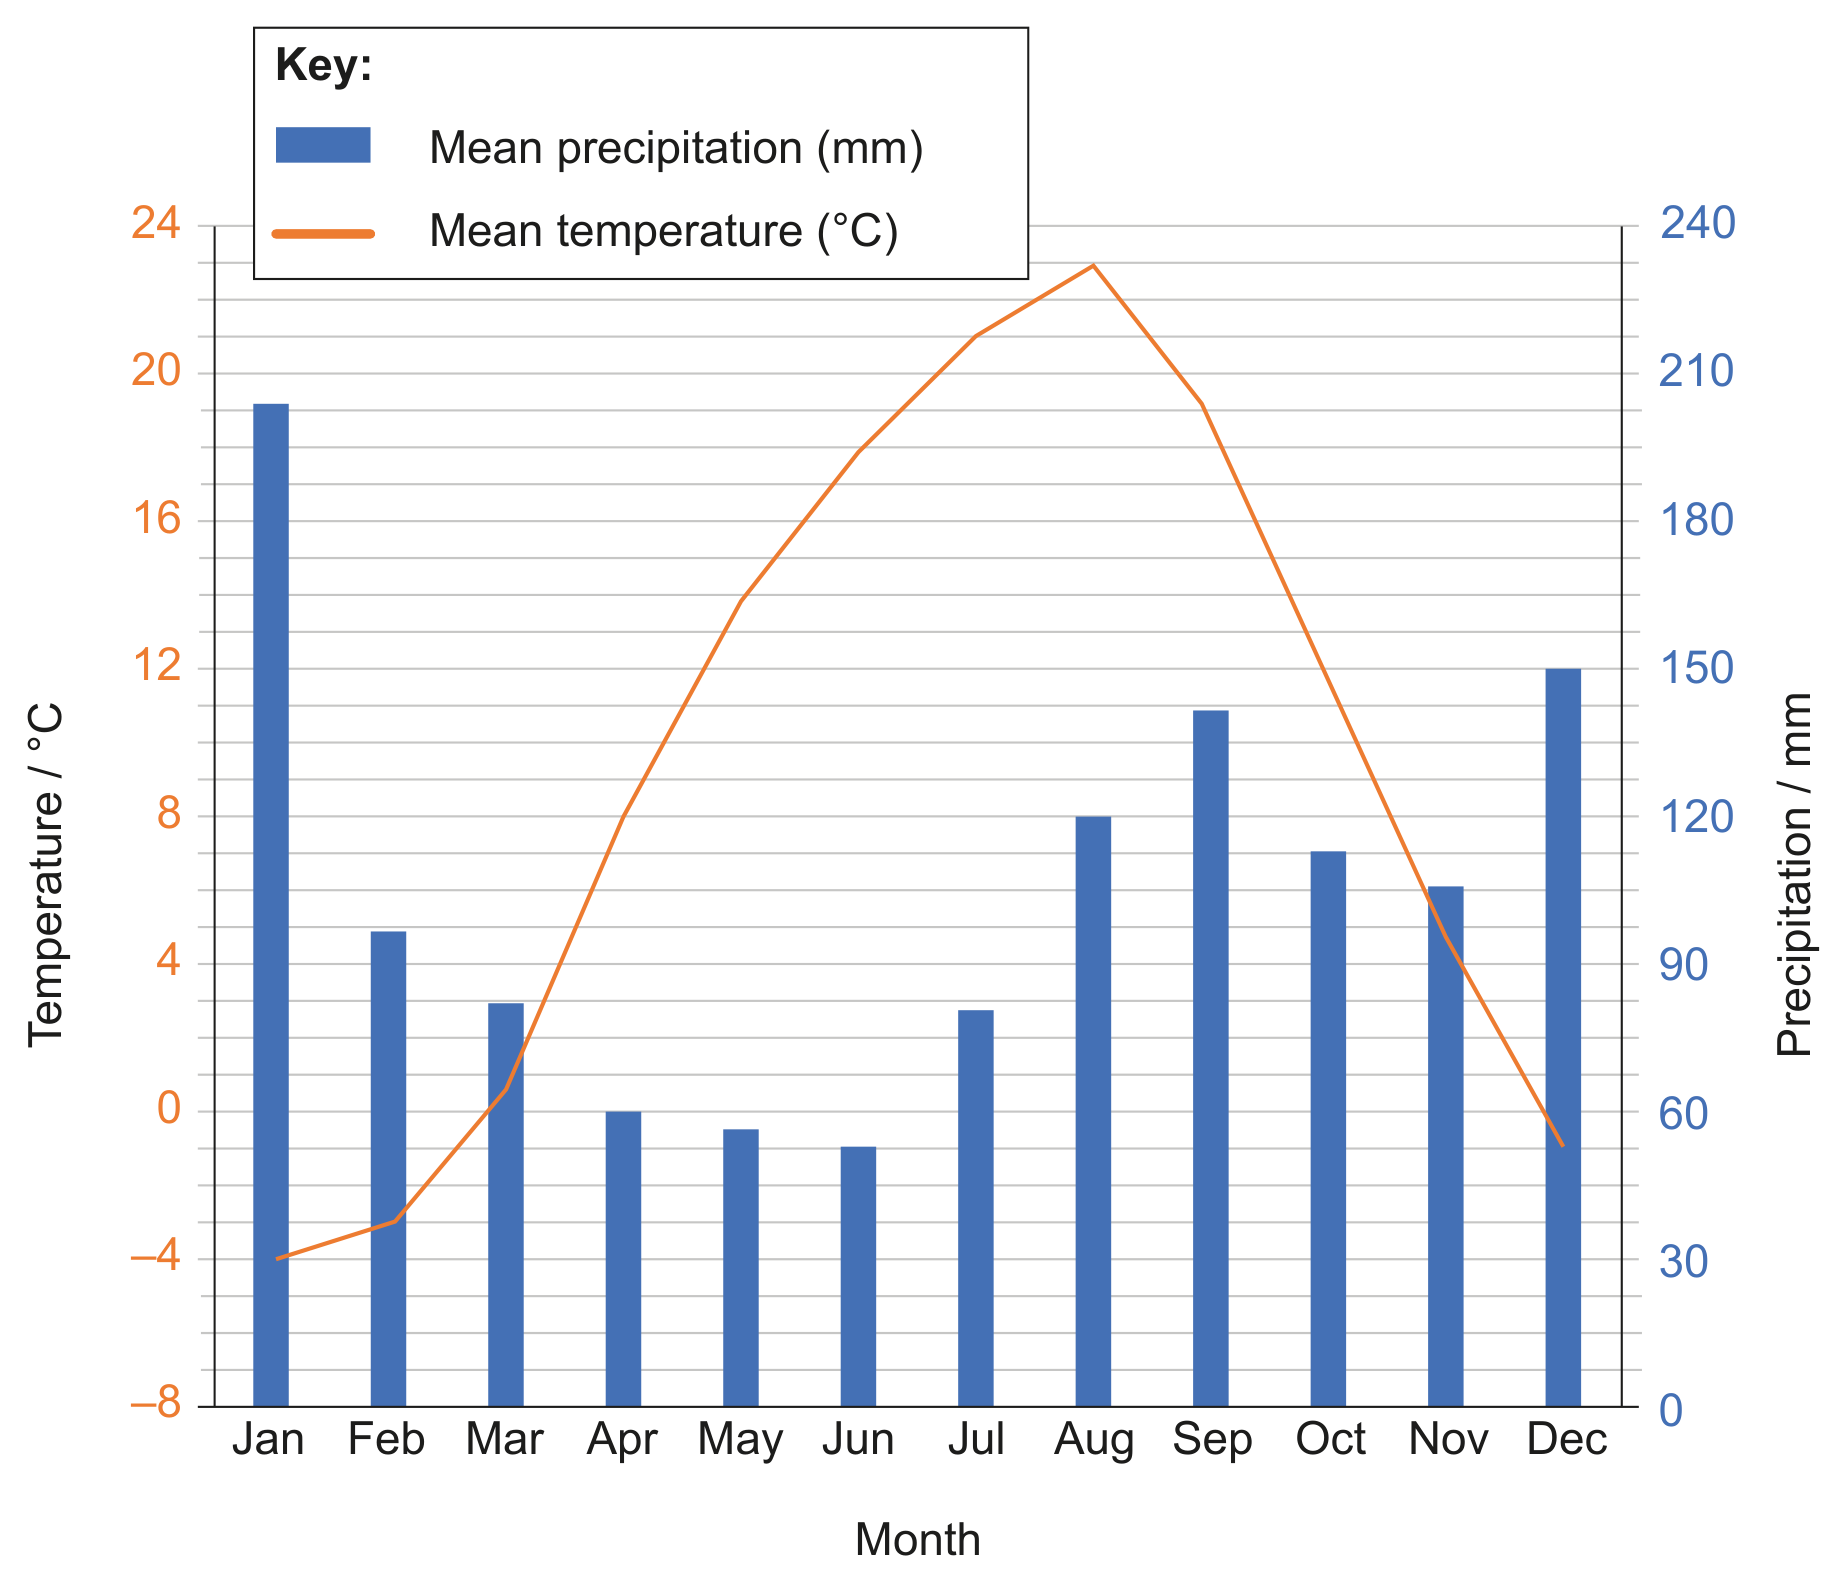
Figure 1(a): World map showing location of Japan

Figure 2(a): Fact file and climate graph for Hokkaido/Sapporo
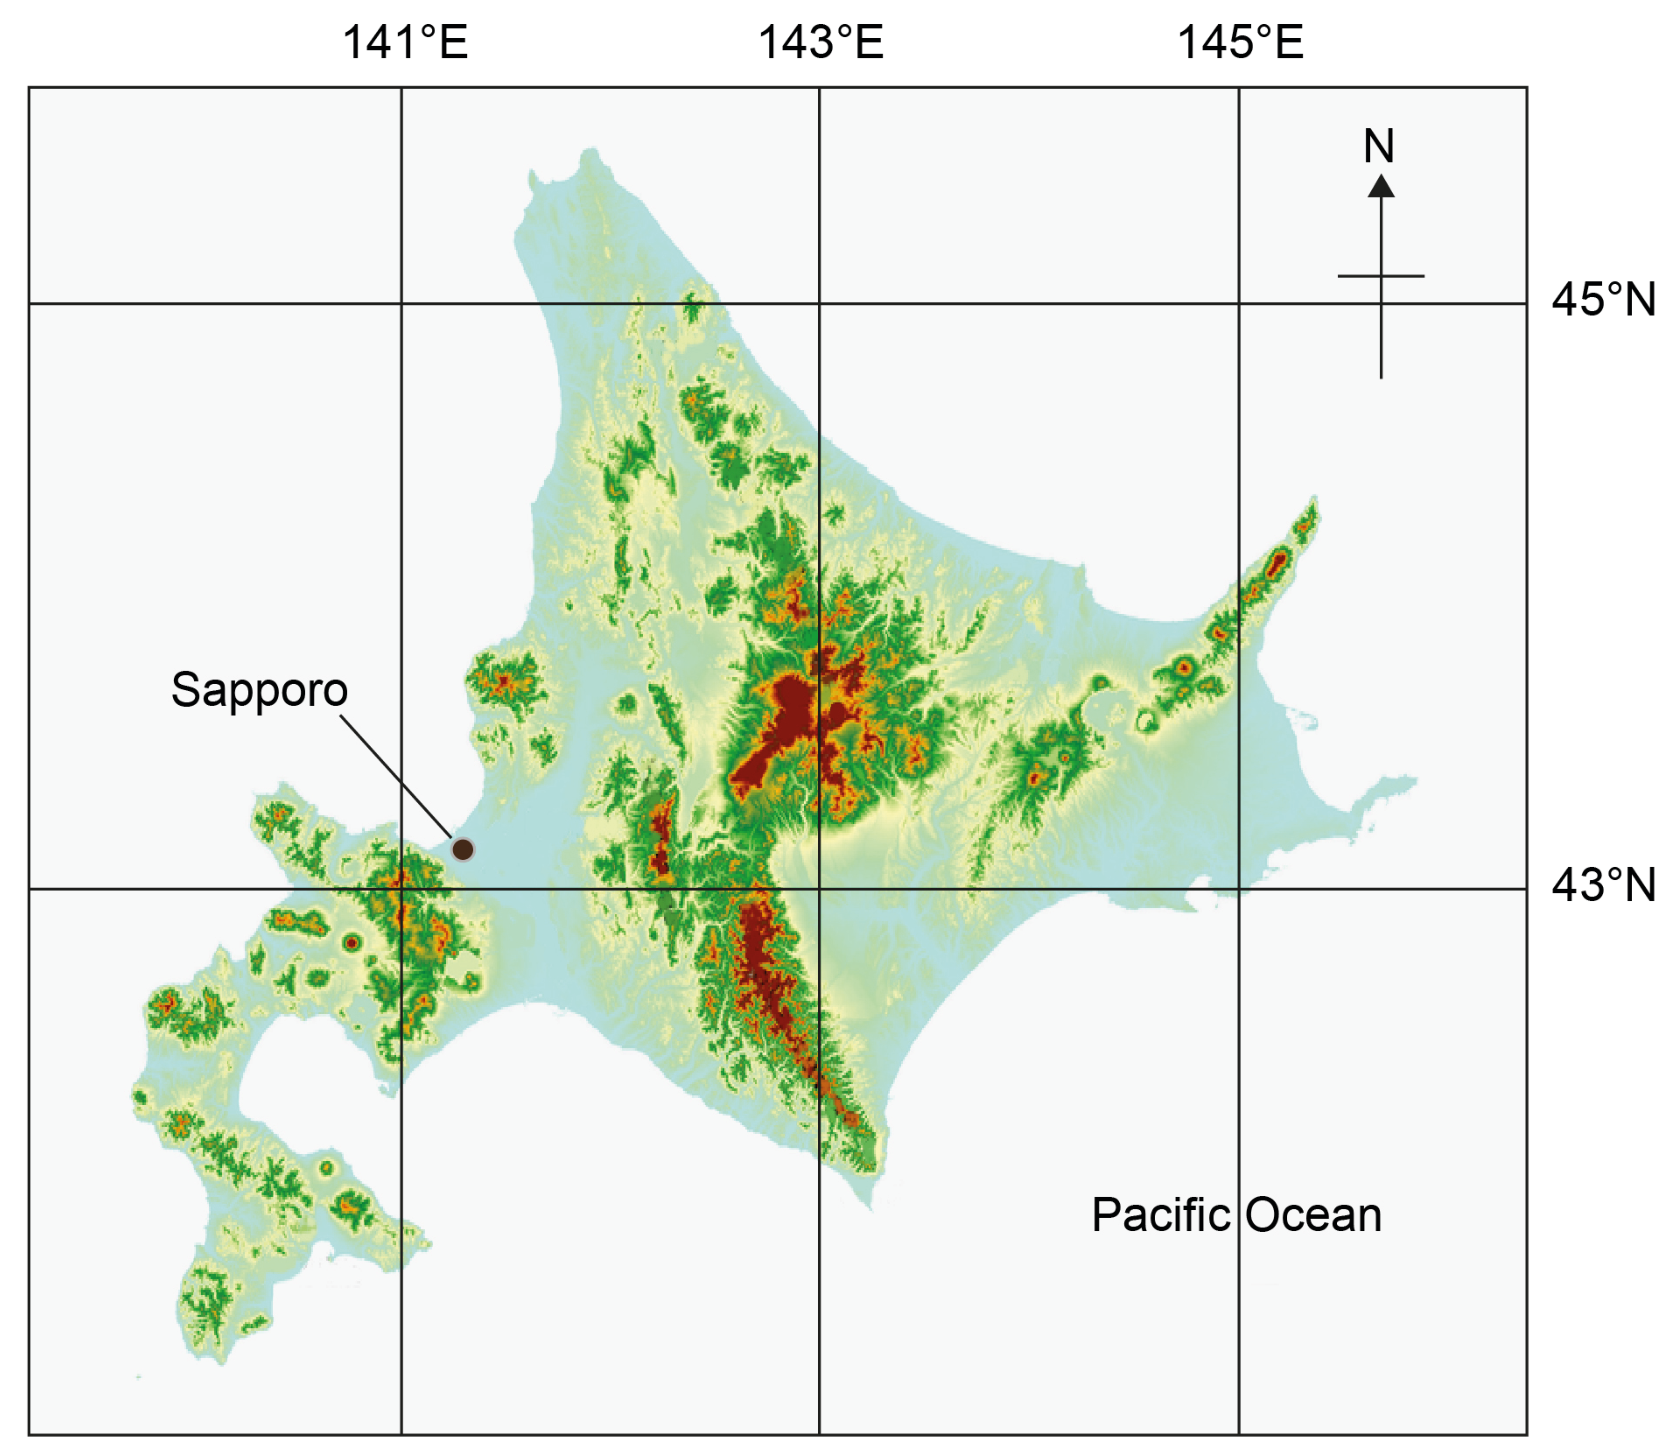
Figure 2(a): Fact file and climate graph for Hokkaido/Sapporo

Figure 2(c): Elevation map of Hokkaido

Figure 2(c): Elevation map of Hokkaido

Using Figures 1(a), 2(b) and 2(c), identify one terrestrial biome found on Hokkaido.

[ 1 ]
Question 1

[Maximum number: 2]
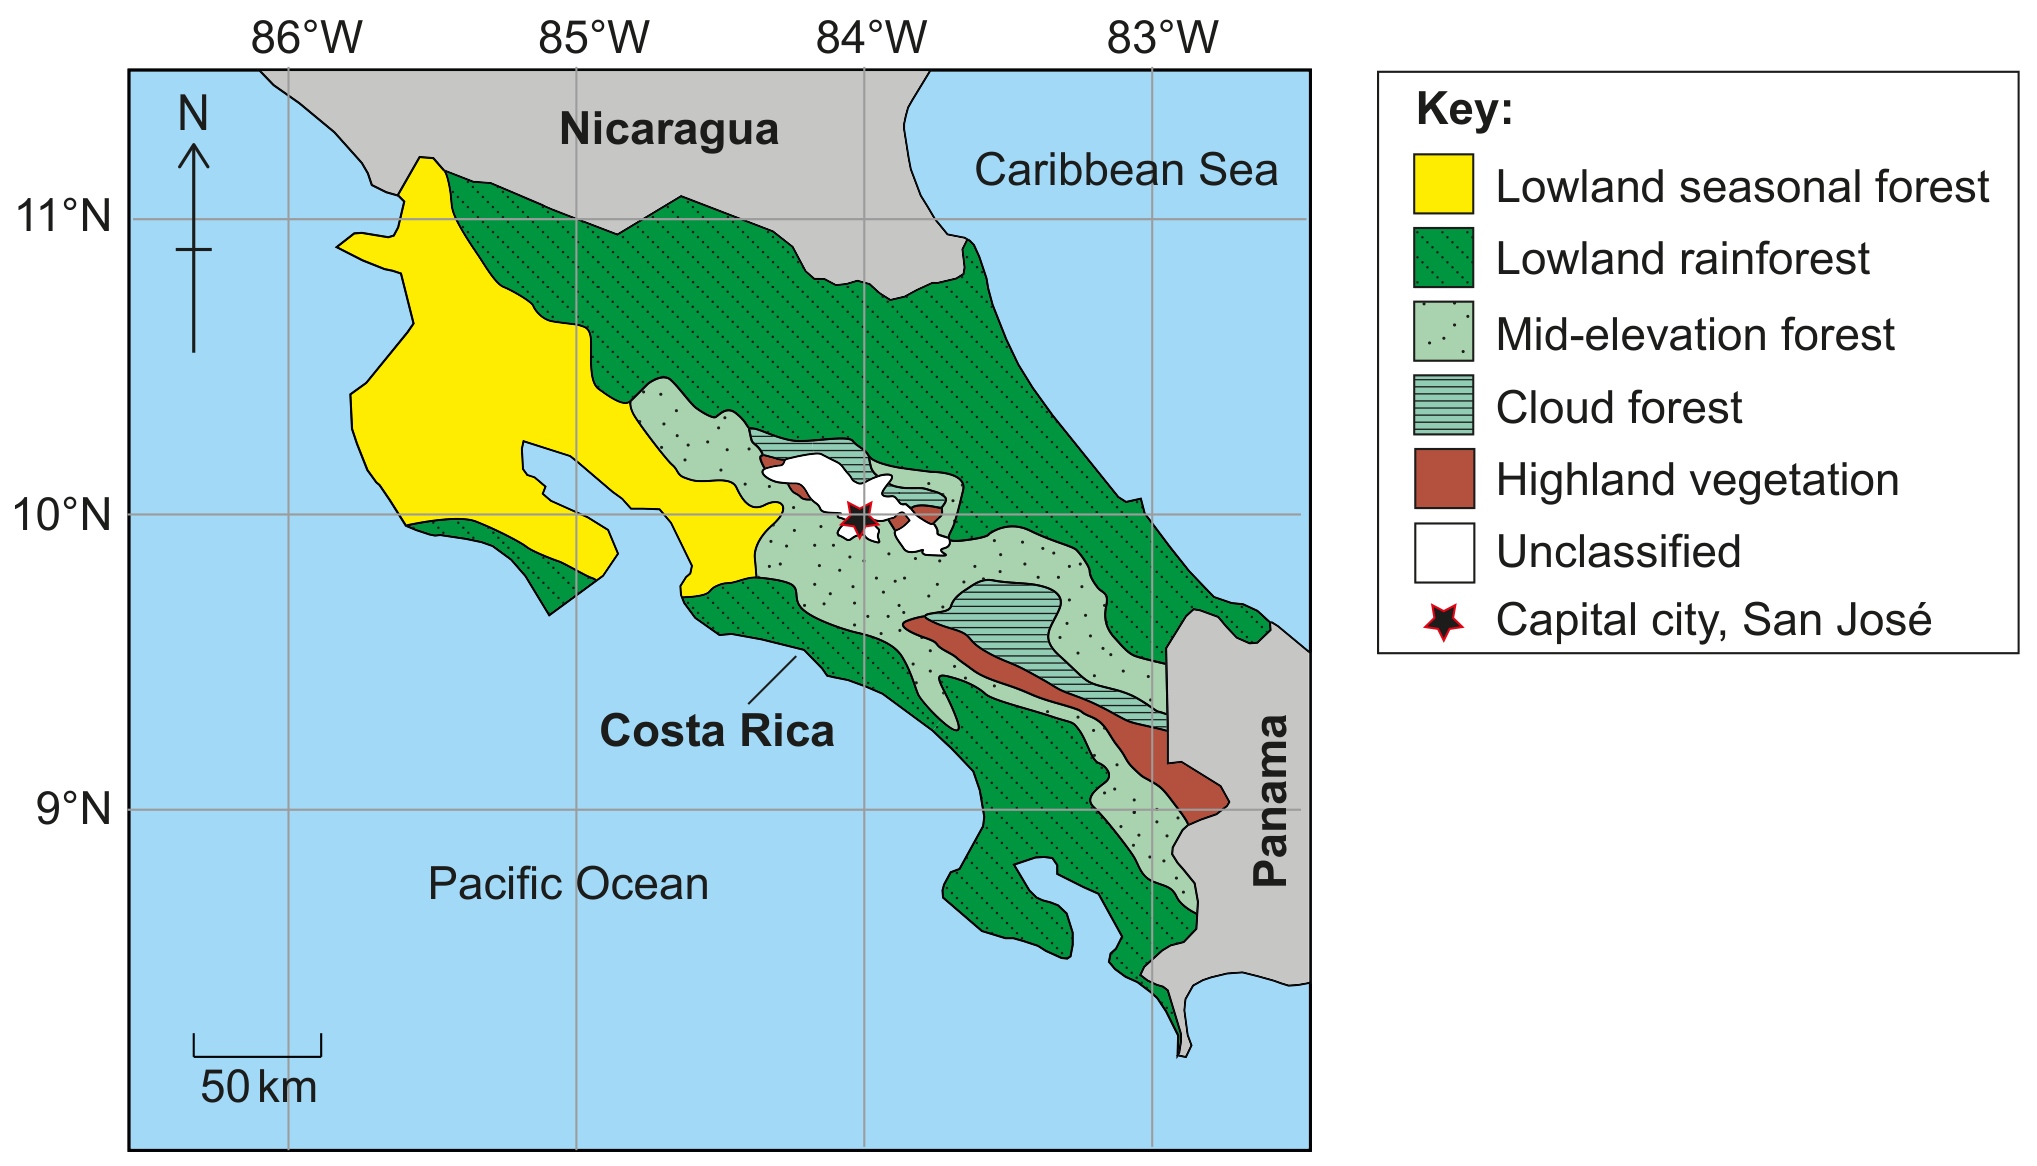
Figure 3(a): Main vegetation zones in Costa Rica

Figure 3(a): Main vegetation zones in Costa Rica

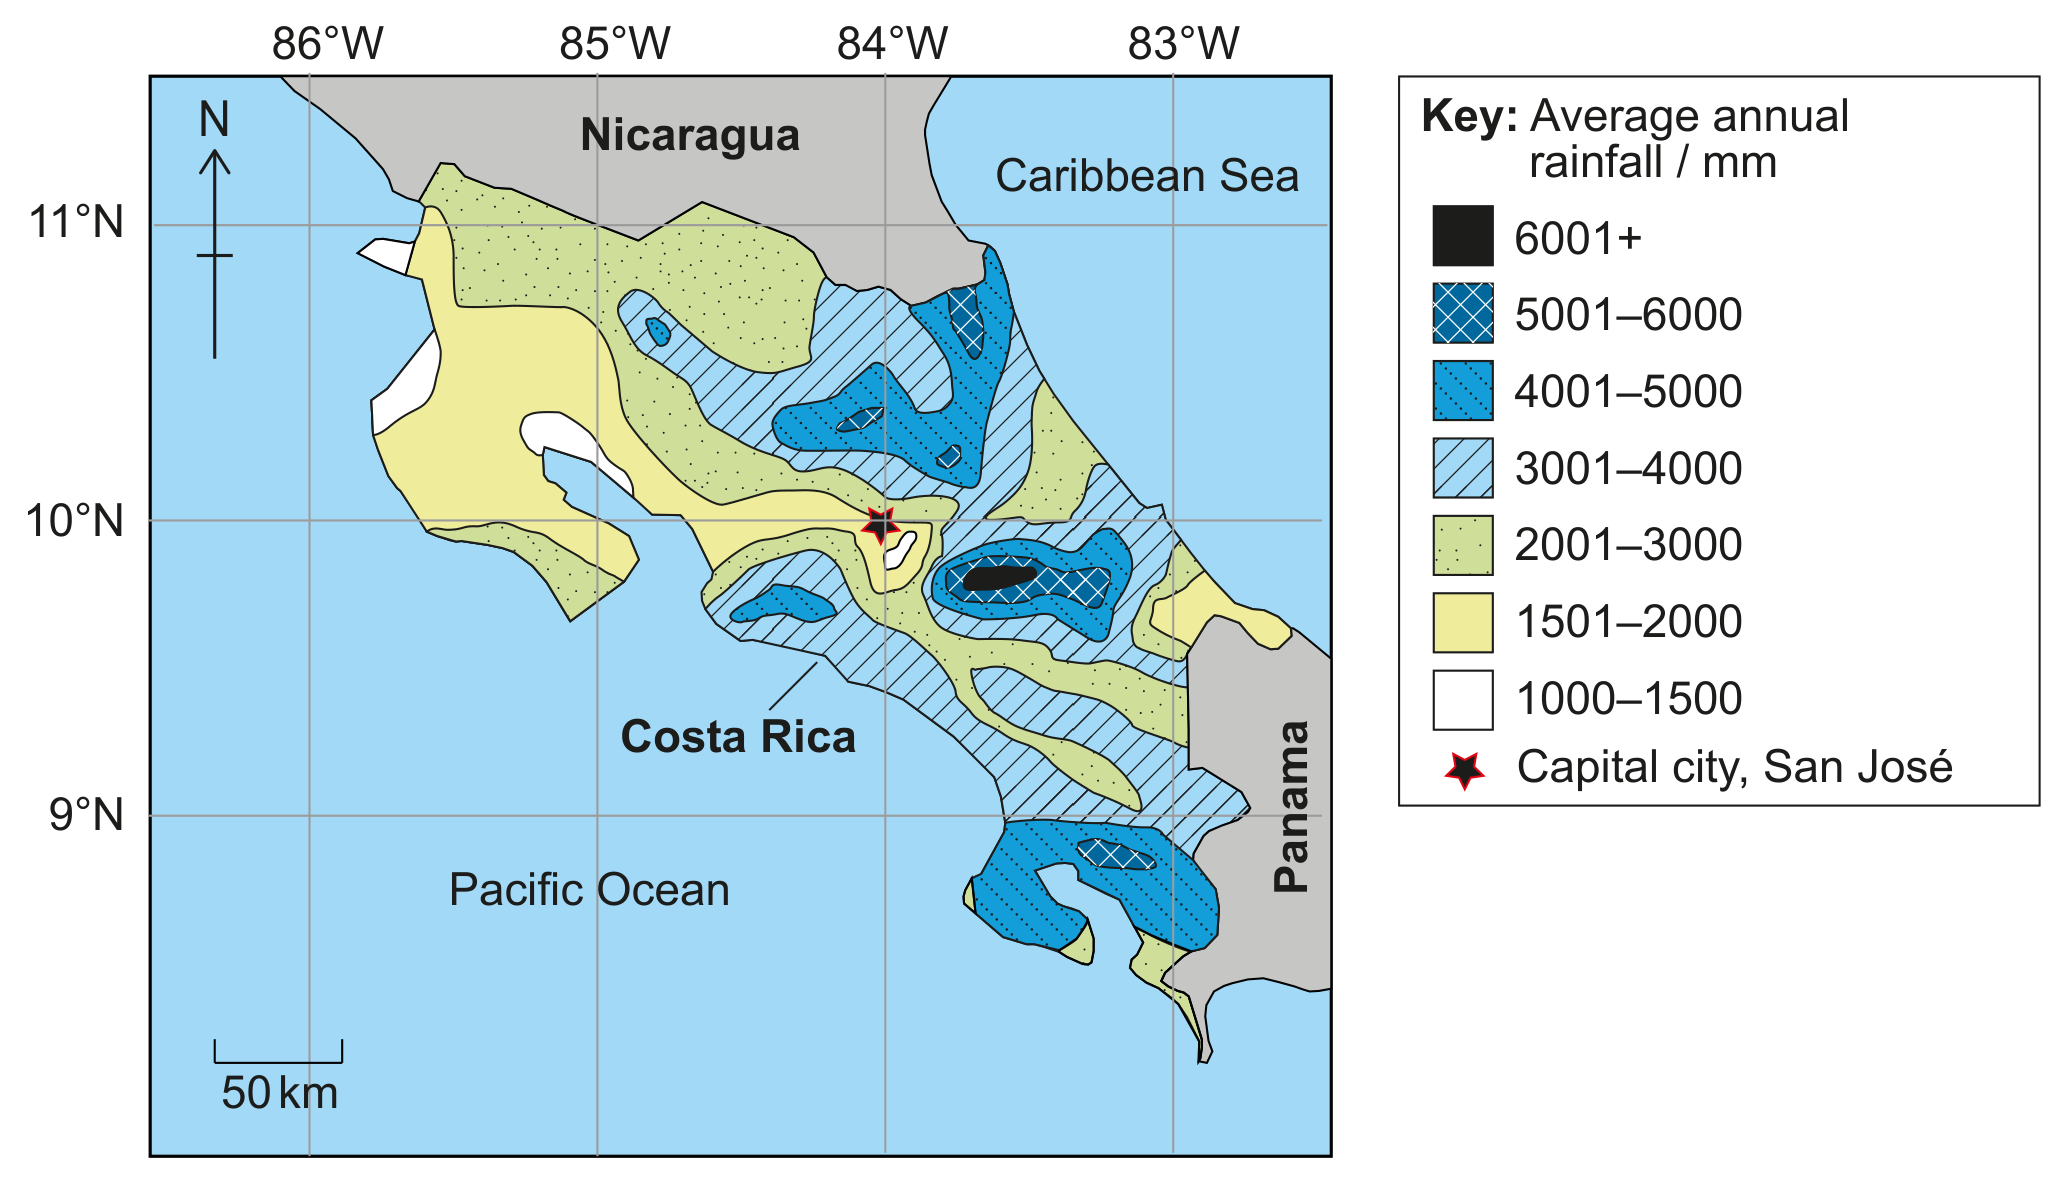
Figure 3(c): Average annual rainfall in Costa Rica

Figure 3(c): Average annual rainfall in Costa Rica

With reference to Figures 3(a), 3(b) and 3(c), identify the climatic conditions in lowland seasonal forest.

Question 1

Question 1(a)

(a)

With reference to Figure 2(a), identify the most widespread biome in Siberia.

[ 1 ]

Question 1(b)

(b)
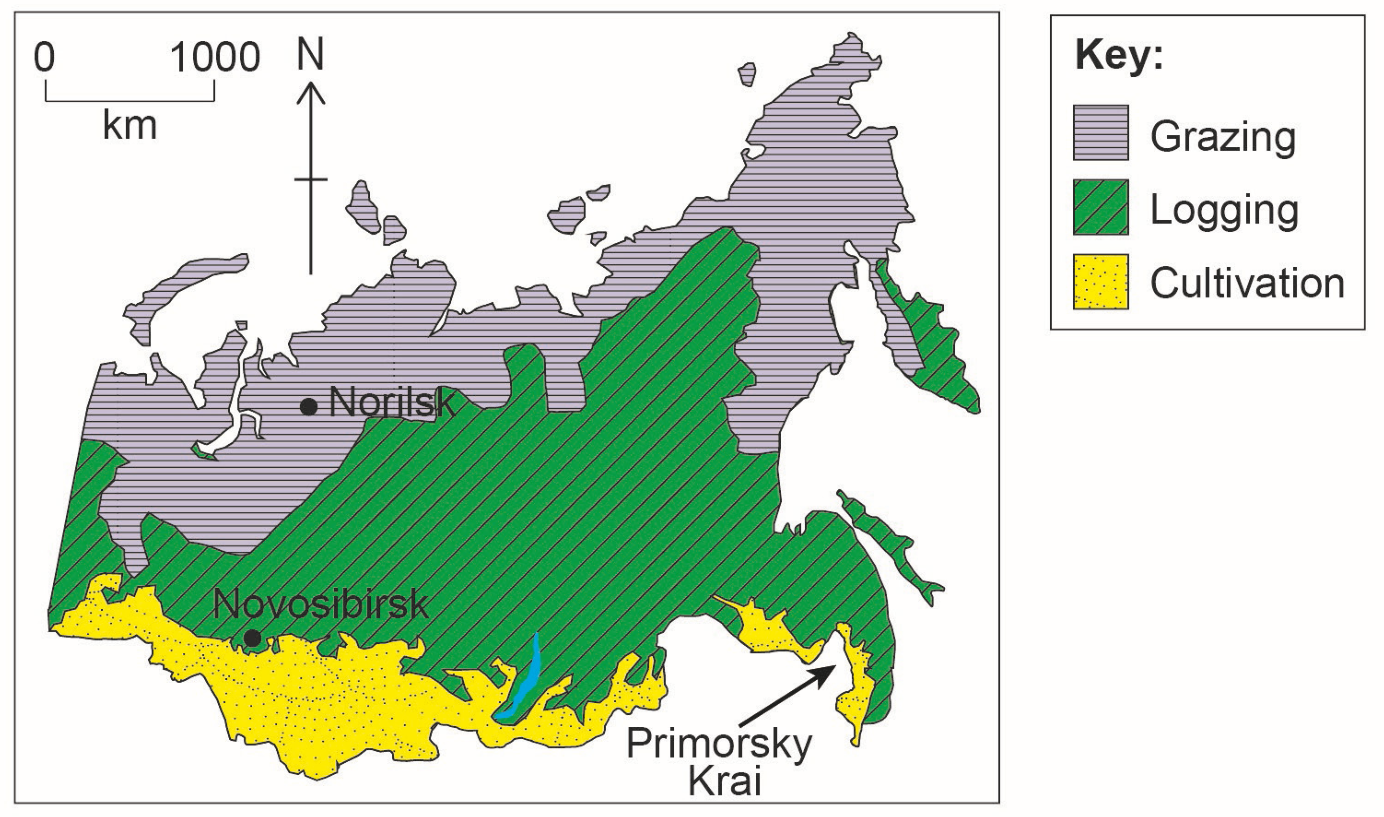
Figure 2(c): Dominant agricultural activities in Siberia, Russia

Figure 2(c): Dominant agricultural activities in Siberia, Russia

Using Figures 2(a) and 2(c), identify the agricultural activity that covers the greatest area in the taiga.

[ 1 ]

Question 2

[Maximum number: 2]
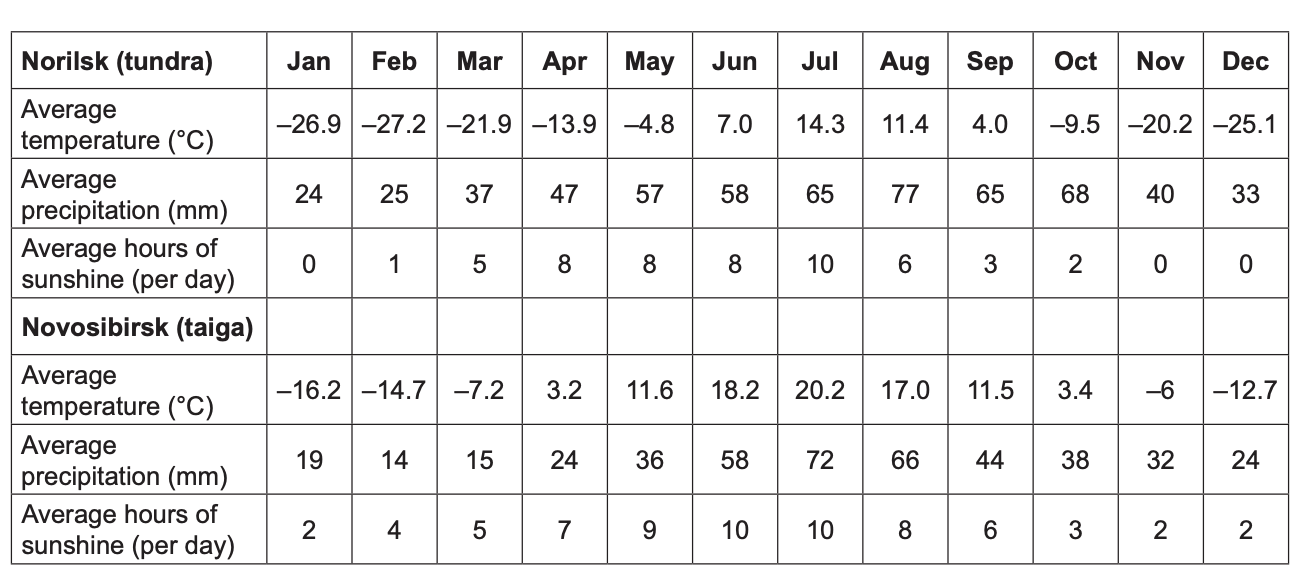
Figure 3: Climate data for Norilsk and Novosibirsk within the tundra and taiga biome respectively

Figure 3: Climate data for Norilsk and Novosibirsk within the tundra and taiga biome respectively

With reference to Figure 3, suggest two reasons why primary productivity is greater in the taiga than in the tundra.

Question 3

Question 3(a)

(a)
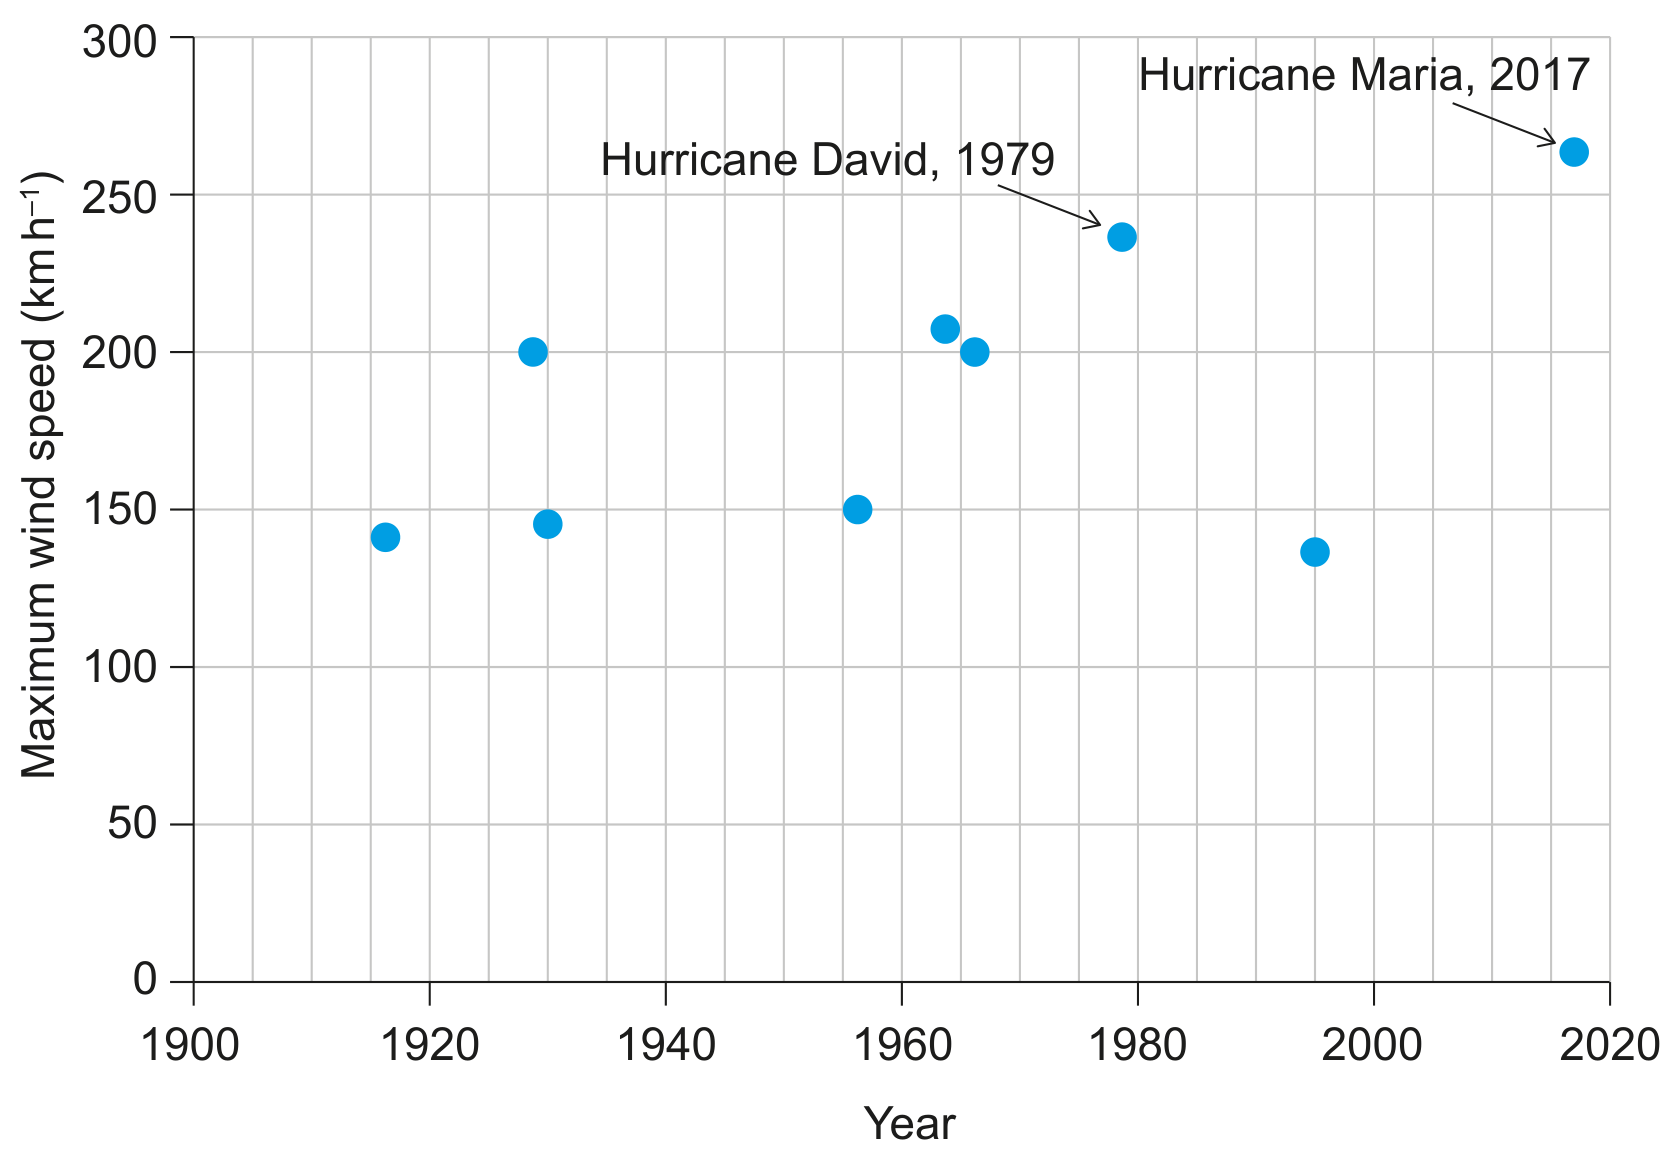
Figure 3(a): Hurricane history of Dominica since 1900

Figure 3(a): Hurricane history of Dominica since 1900

Using Figure 3(a), identify why Hurricane Maria was so destructive.

[ 1 ]

Question 3(b)

(b)
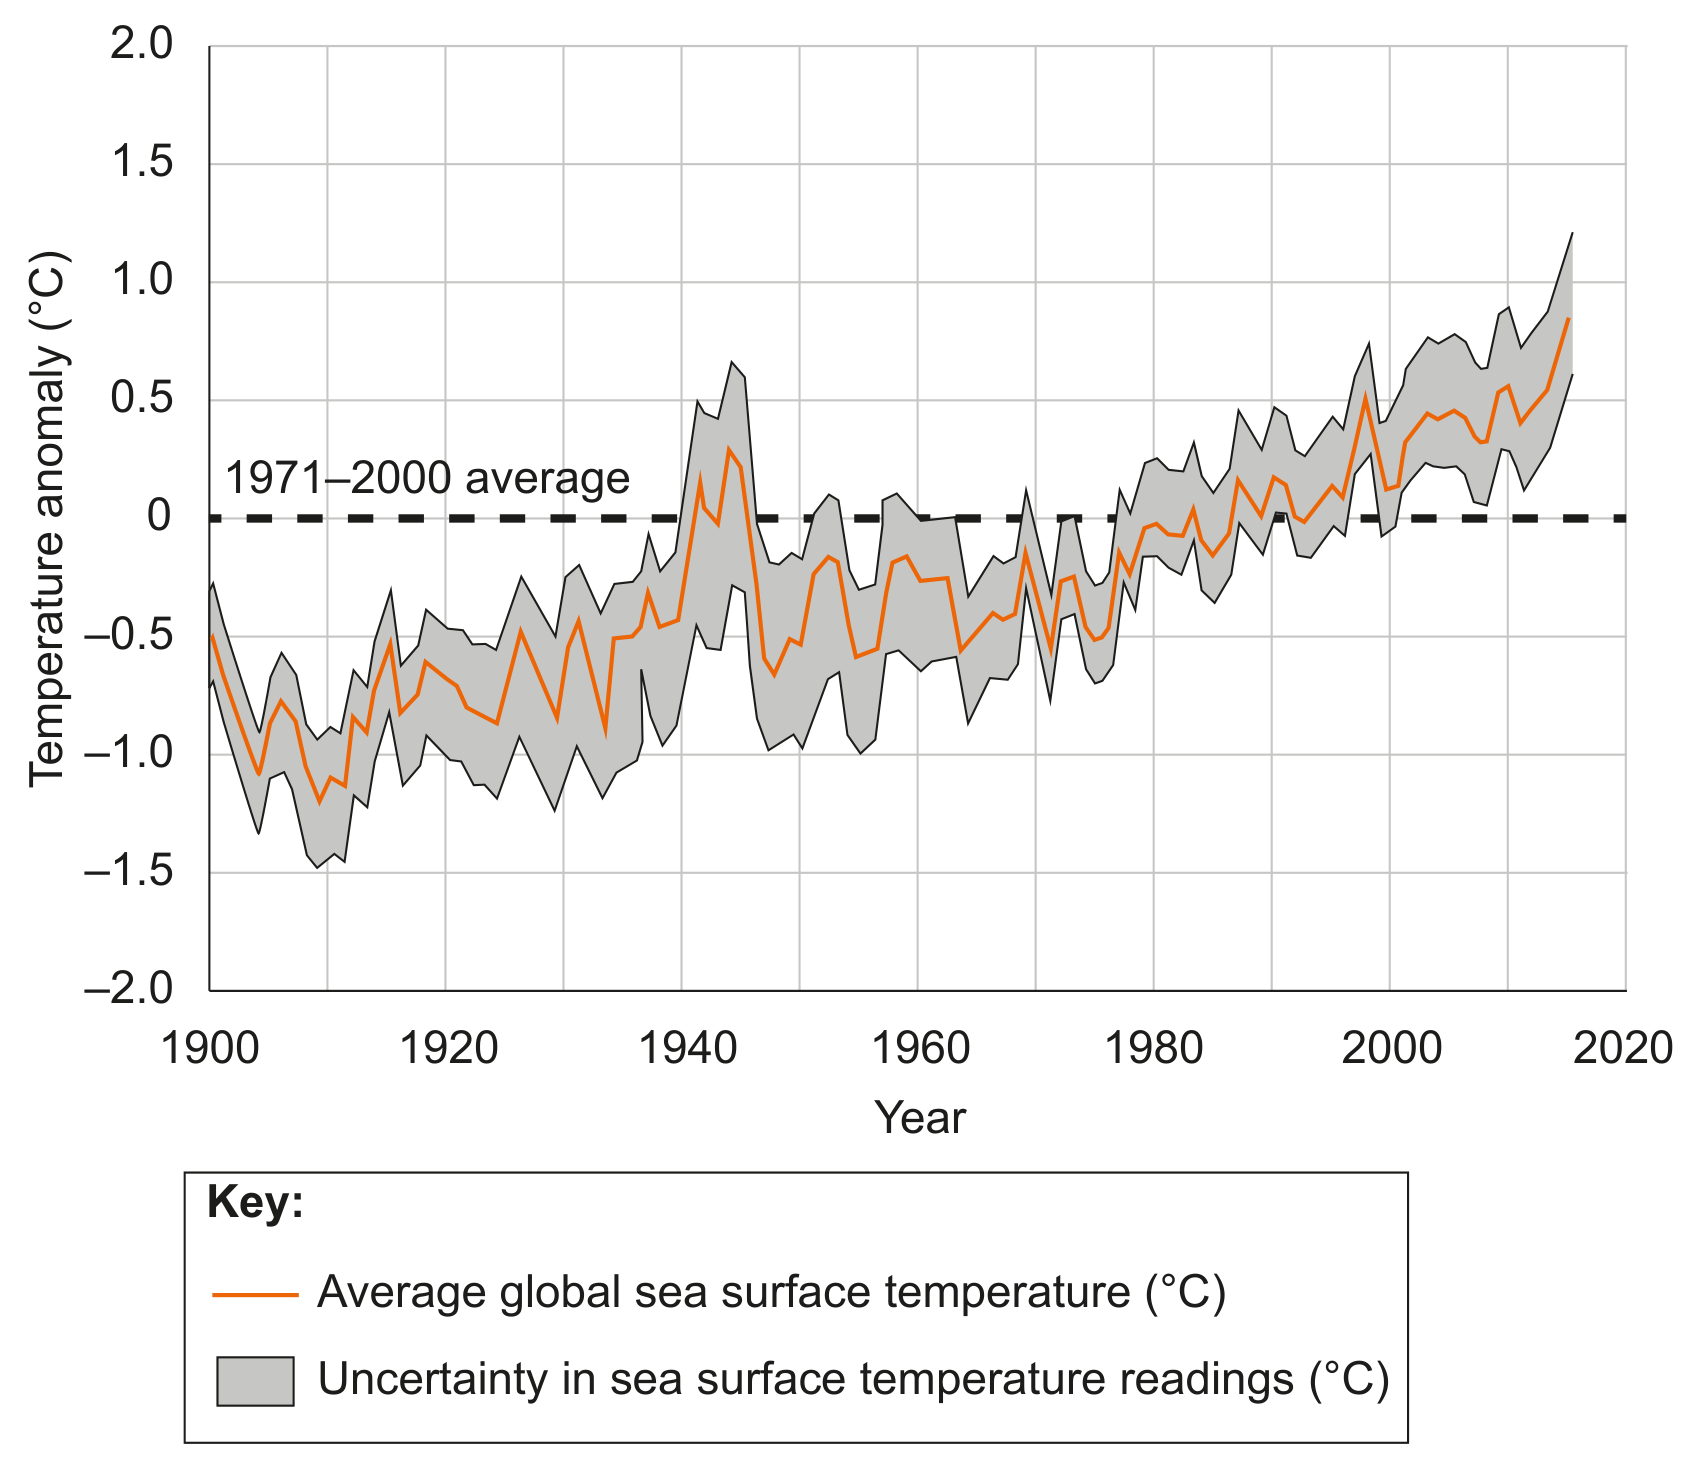
Figure 3(b): Average global sea surface temperature, 1900-2015

Figure 3(b): Average global sea surface temperature, 1900-2015

Describe the relationship between sea surface temperature in Figure 3(b) and hurricane wind speed in Figure 3(a).

[ 2 ]

Question 3(d)

[Maximum number: 1]
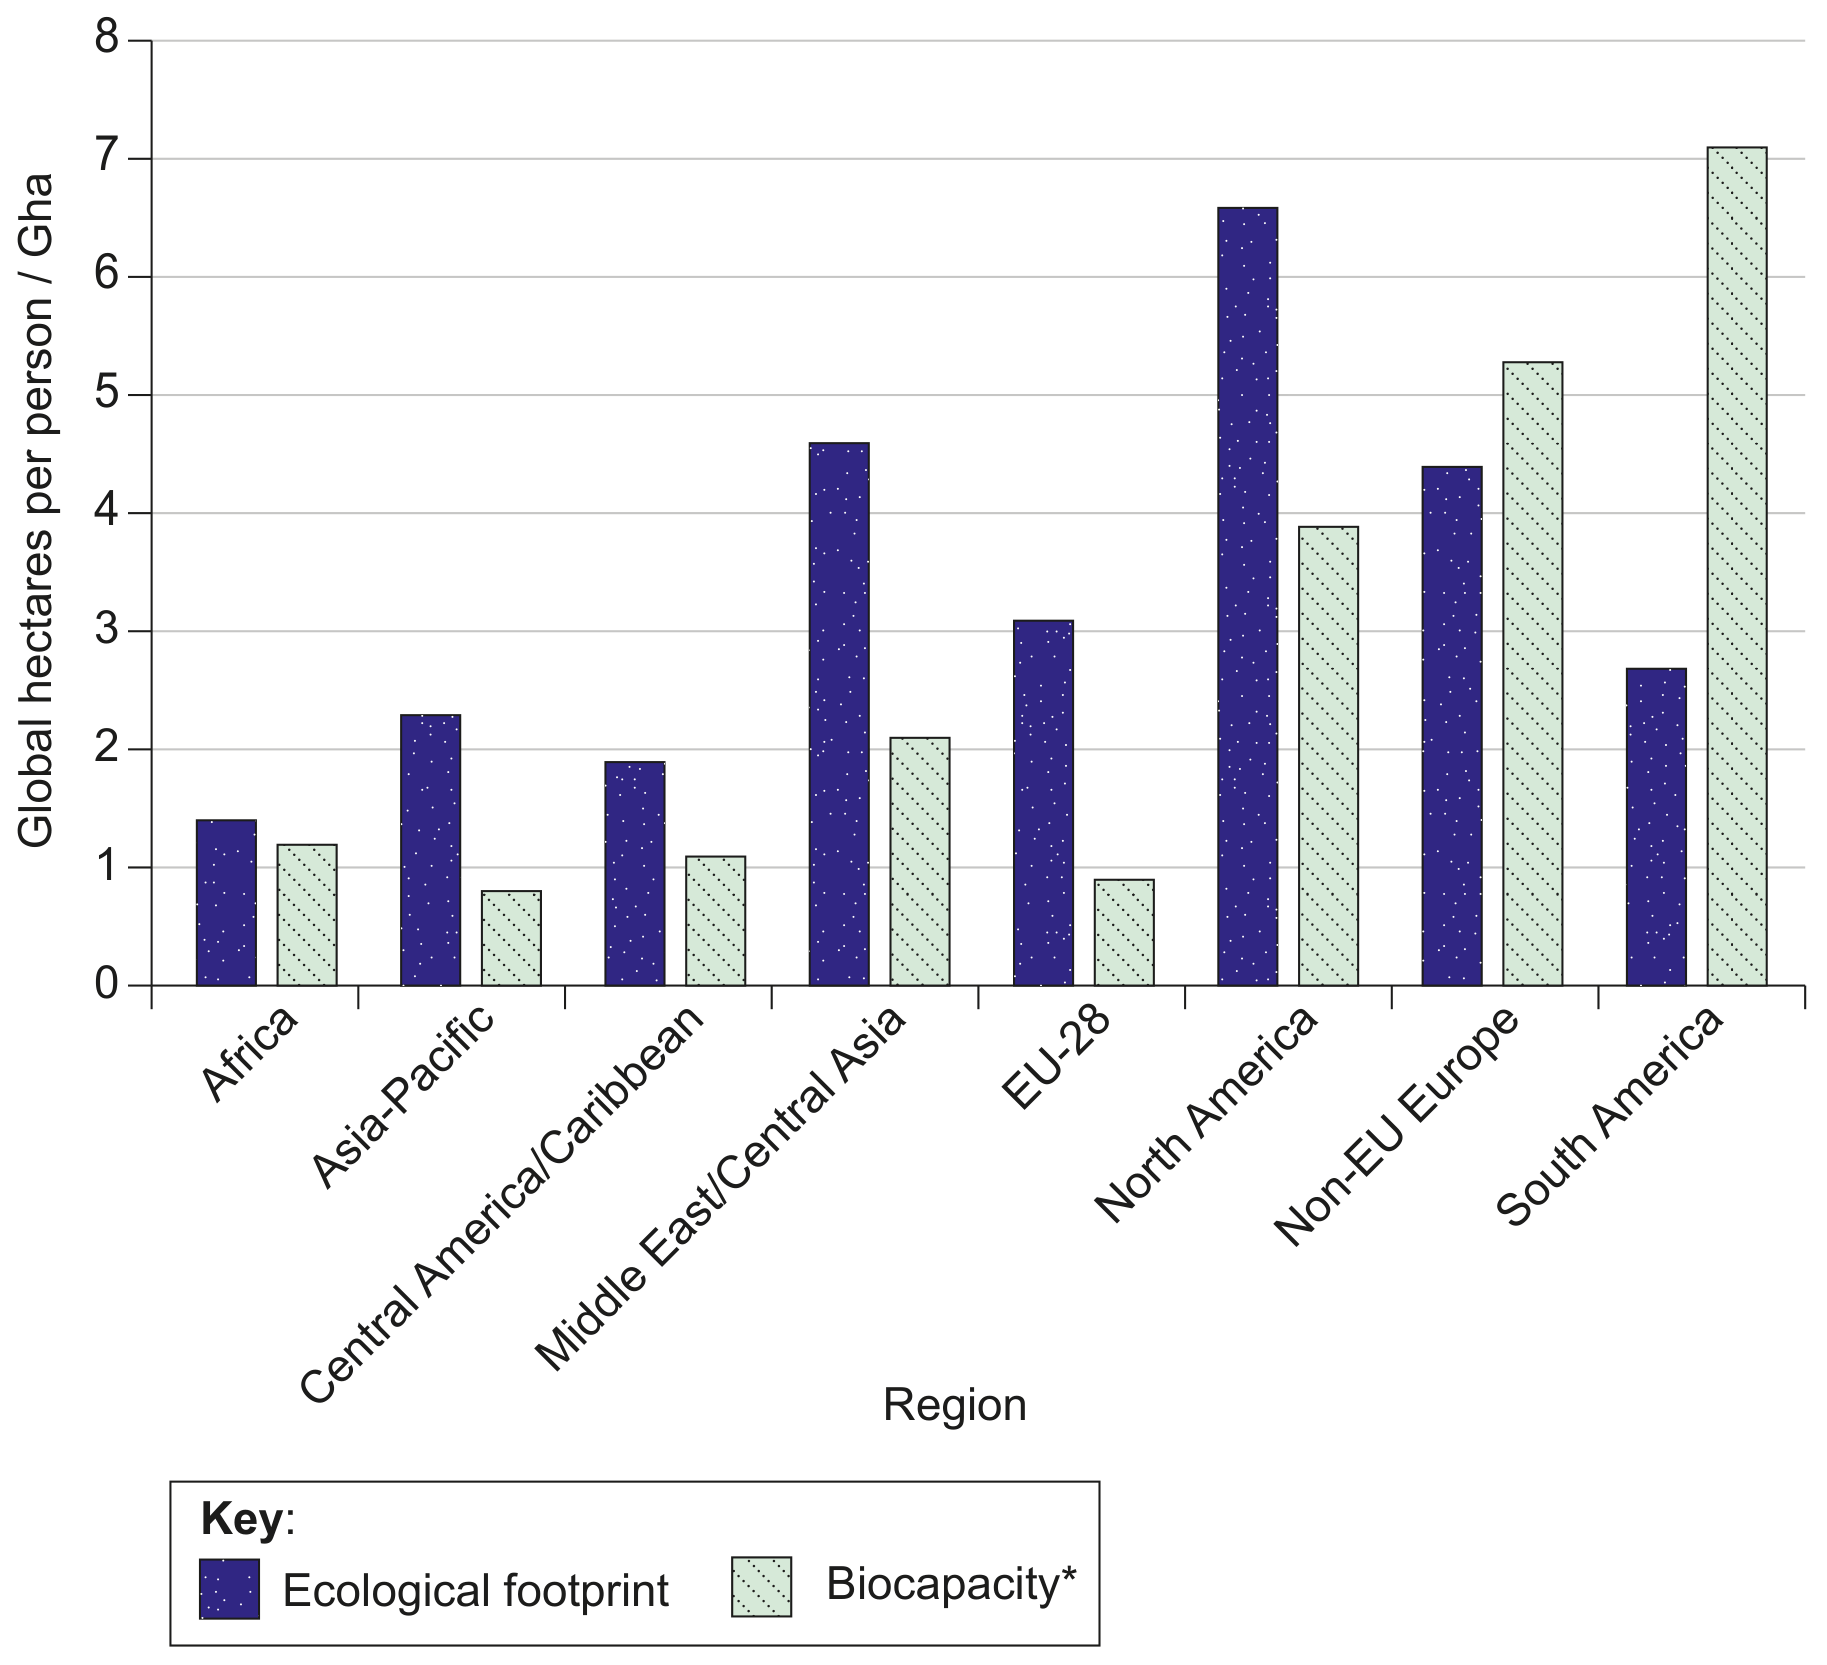
Figure 3: The ecological footprint and biocapacity for selected world regions, 2016

Figure 3: The ecological footprint and biocapacity for selected world regions, 2016

*Biocapacity: amount of biologically productive land, measured in total hectares per person

Productivity contributes to the biocapacity of land. Outline one climatic factor that limits the primary productivity of a region.

Question 4(a)

[Maximum number: 4]

Distinguish between two named biomes and the factors that cause their distribution.

0 selected