IB ESS 1.3 Sustainability Topic Practice

EduNinja

Question 3

[Maximum number: 3]
LondonUnited KingdomWorld average
Ecological footprint
(global hectares per capita)
4.54.62.8
Biocapacity
(global hectares per capita)
0.171.201.60

Figure 7: Ecological footprints of London, the United Kingdom and the world, 2015

Question 3(a)

(a)

State one strength and one weakness of using the ecological footprint as a model for measuring sustainability.

[ 2 ]

Question 3(b)

(b)

State one factor that would allow a region's ecological footprint to exceed its biocapacity.

[ 1 ]
Question 3

[Maximum number: 7]
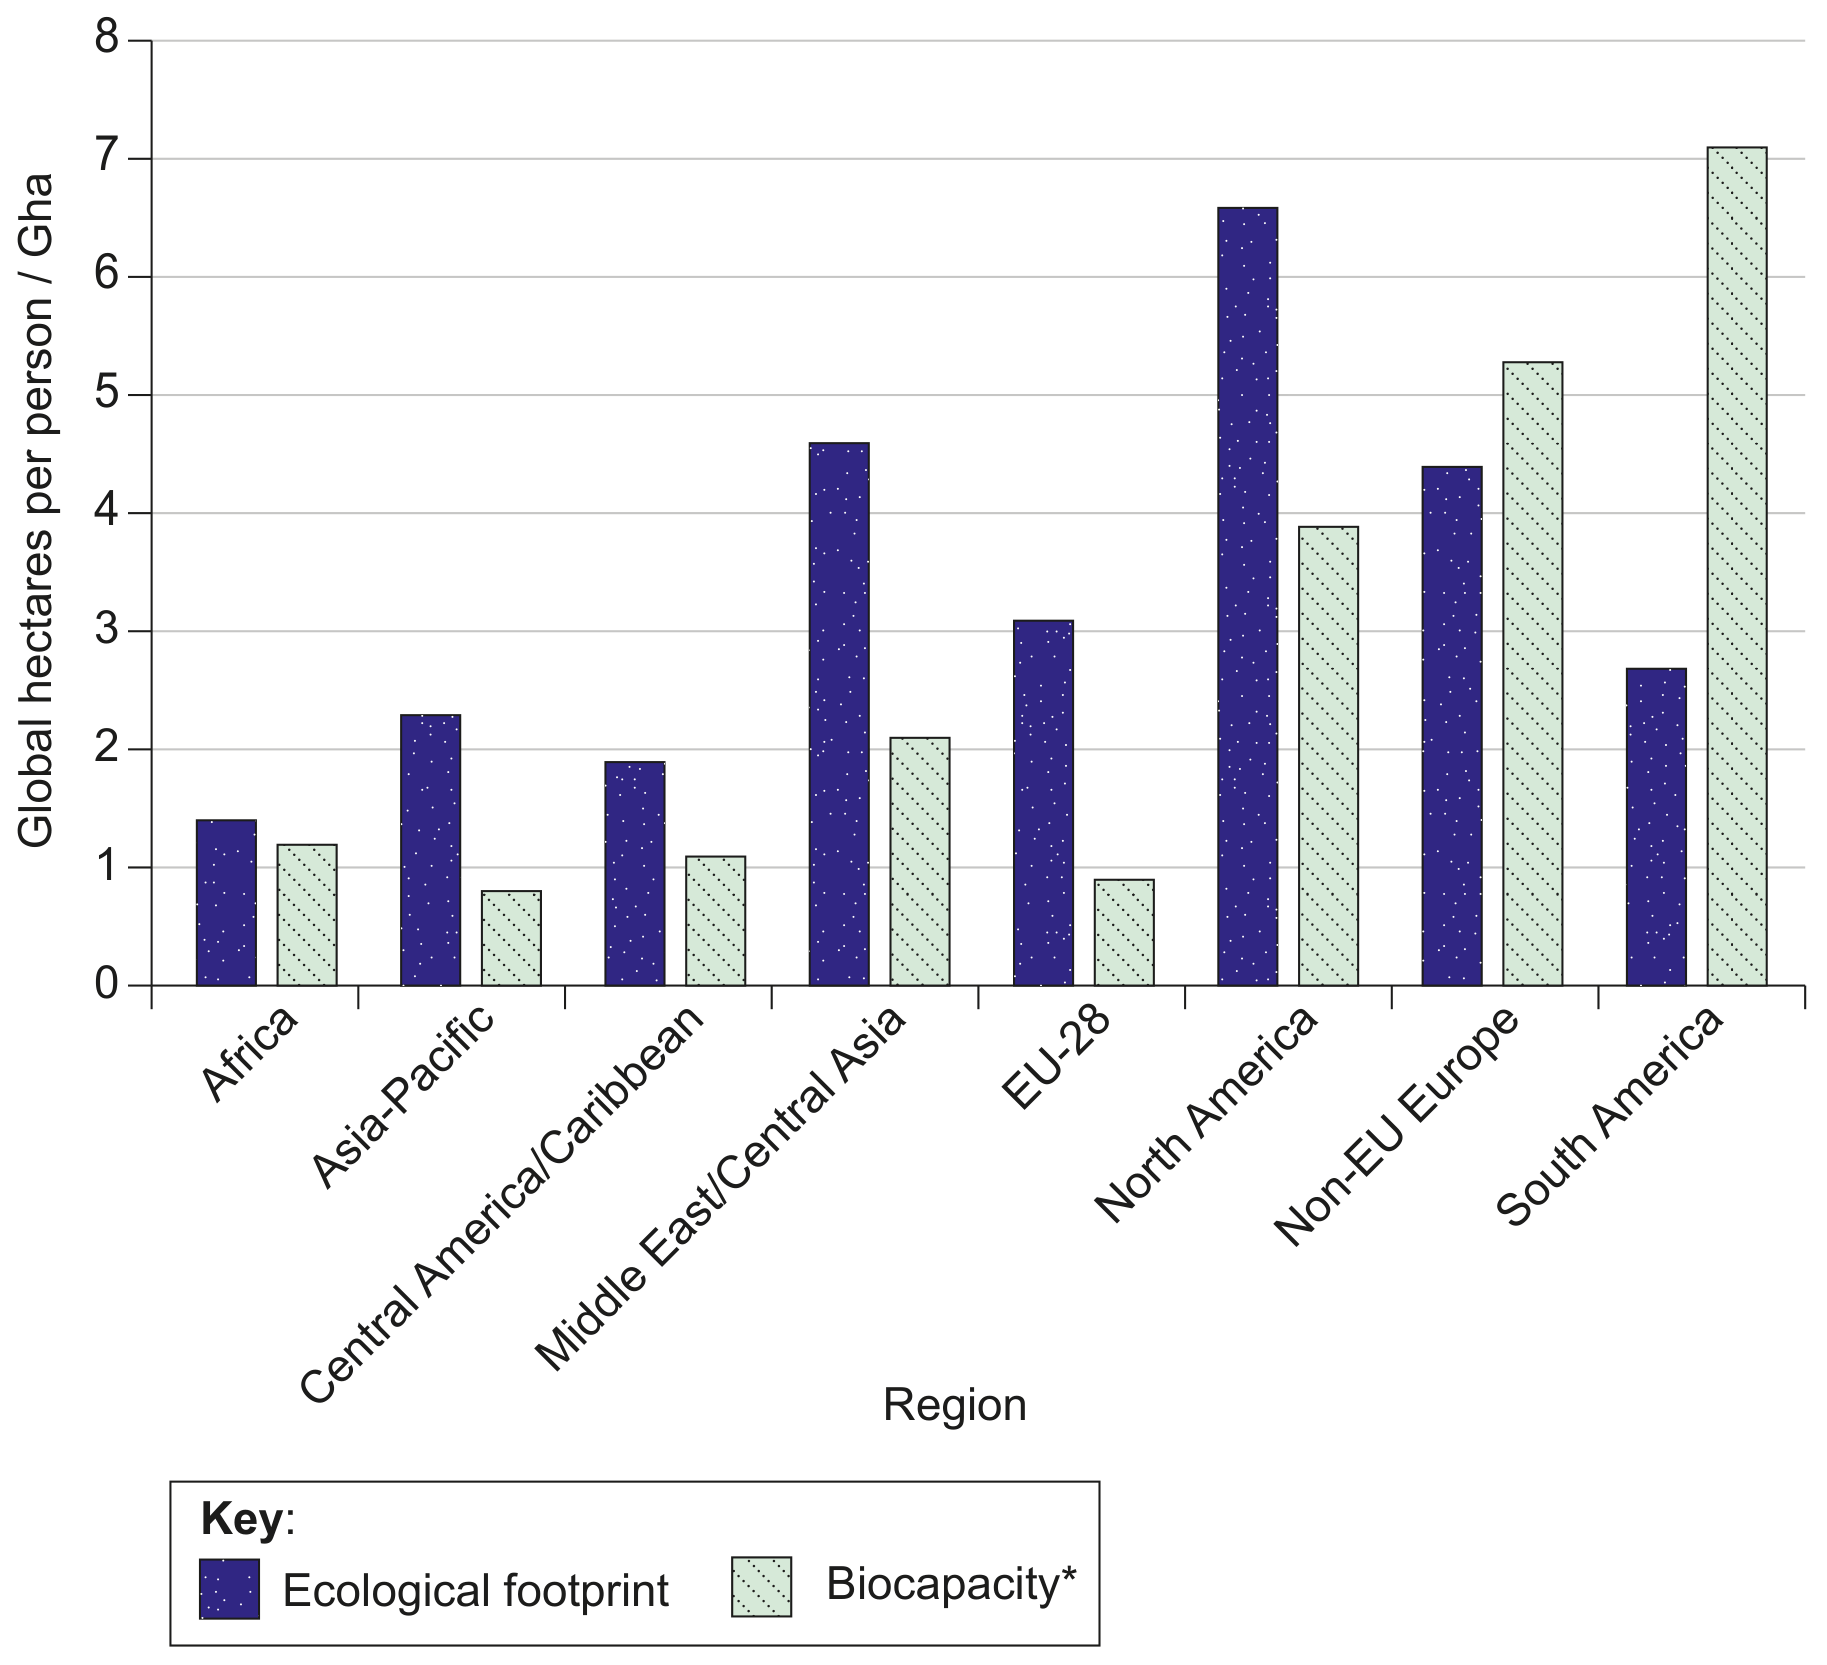
Figure 3: The ecological footprint and biocapacity for selected world regions, 2016

Figure 3: The ecological footprint and biocapacity for selected world regions, 2016

*Biocapacity: amount of biologically productive land, measured in total hectares per person

Question 3(a)

(a)

Identify one region shown in Figure 3 that has an ecological footprint less than its biocapacity.

[ 1 ]

Question 3(b)

(b)

Outline one reason why a region whose ecological footprint is greater than its biocapacity is considered unsustainable.

[ 1 ]

Question 3(c)

(c)

Outline one way in which a region can exceed its carrying capacity.

[ 1 ]

Question 3(e)

(d)

Evaluate the use of the ecological footprint as a model.

[ 4 ]

Question 6

[Maximum number: 6]

Hokkaido is working towards a sustainable future.

With reference to the information provided in the resource booklet, discuss this statement.

Hokkaido contains 20% of Japan's land area and had a population of 5,286,000 in 2018.
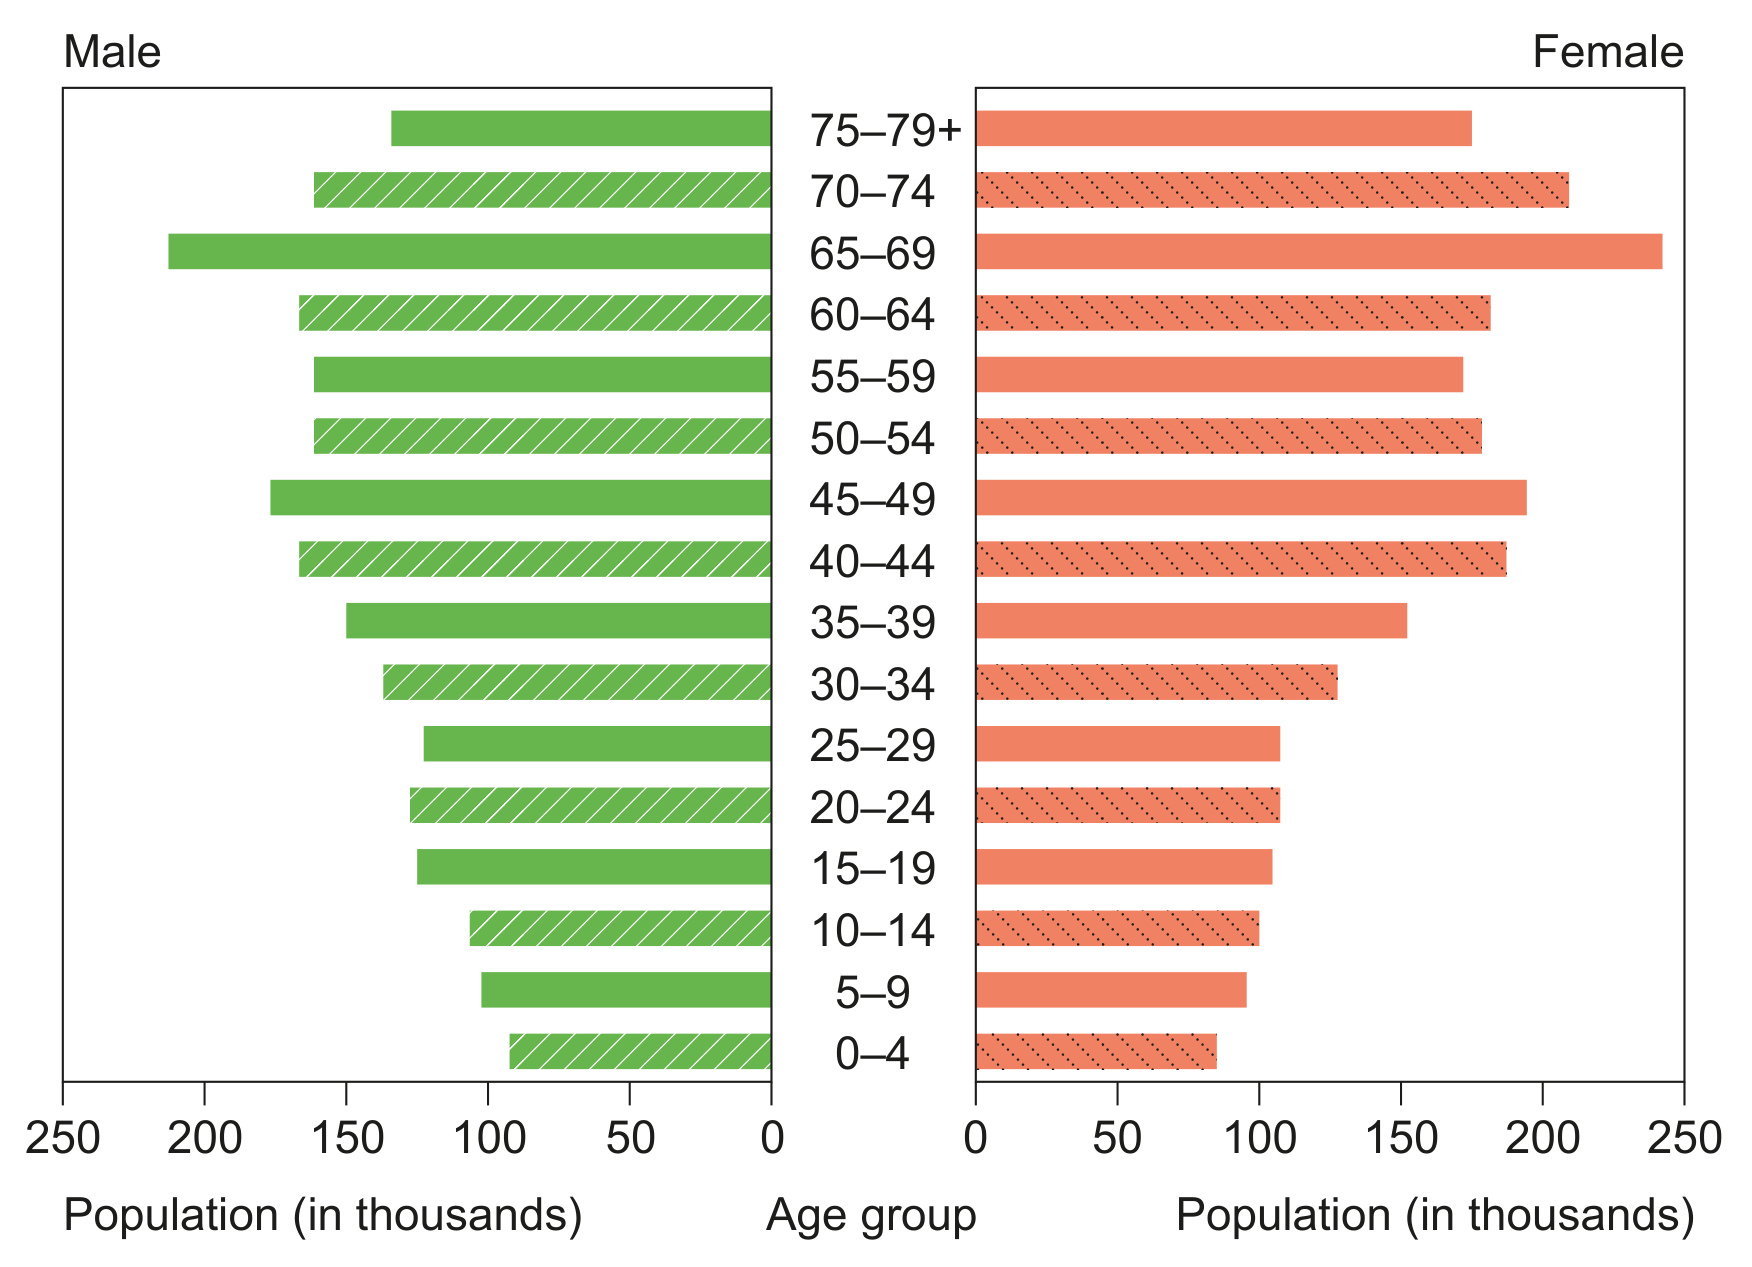
31% of inhabitants are over 65 years old; the main city is Sapporo.
Hokkaido is Japan's largest producer of rice, soybeans and wheat, and is known for nature/recreational tourism.
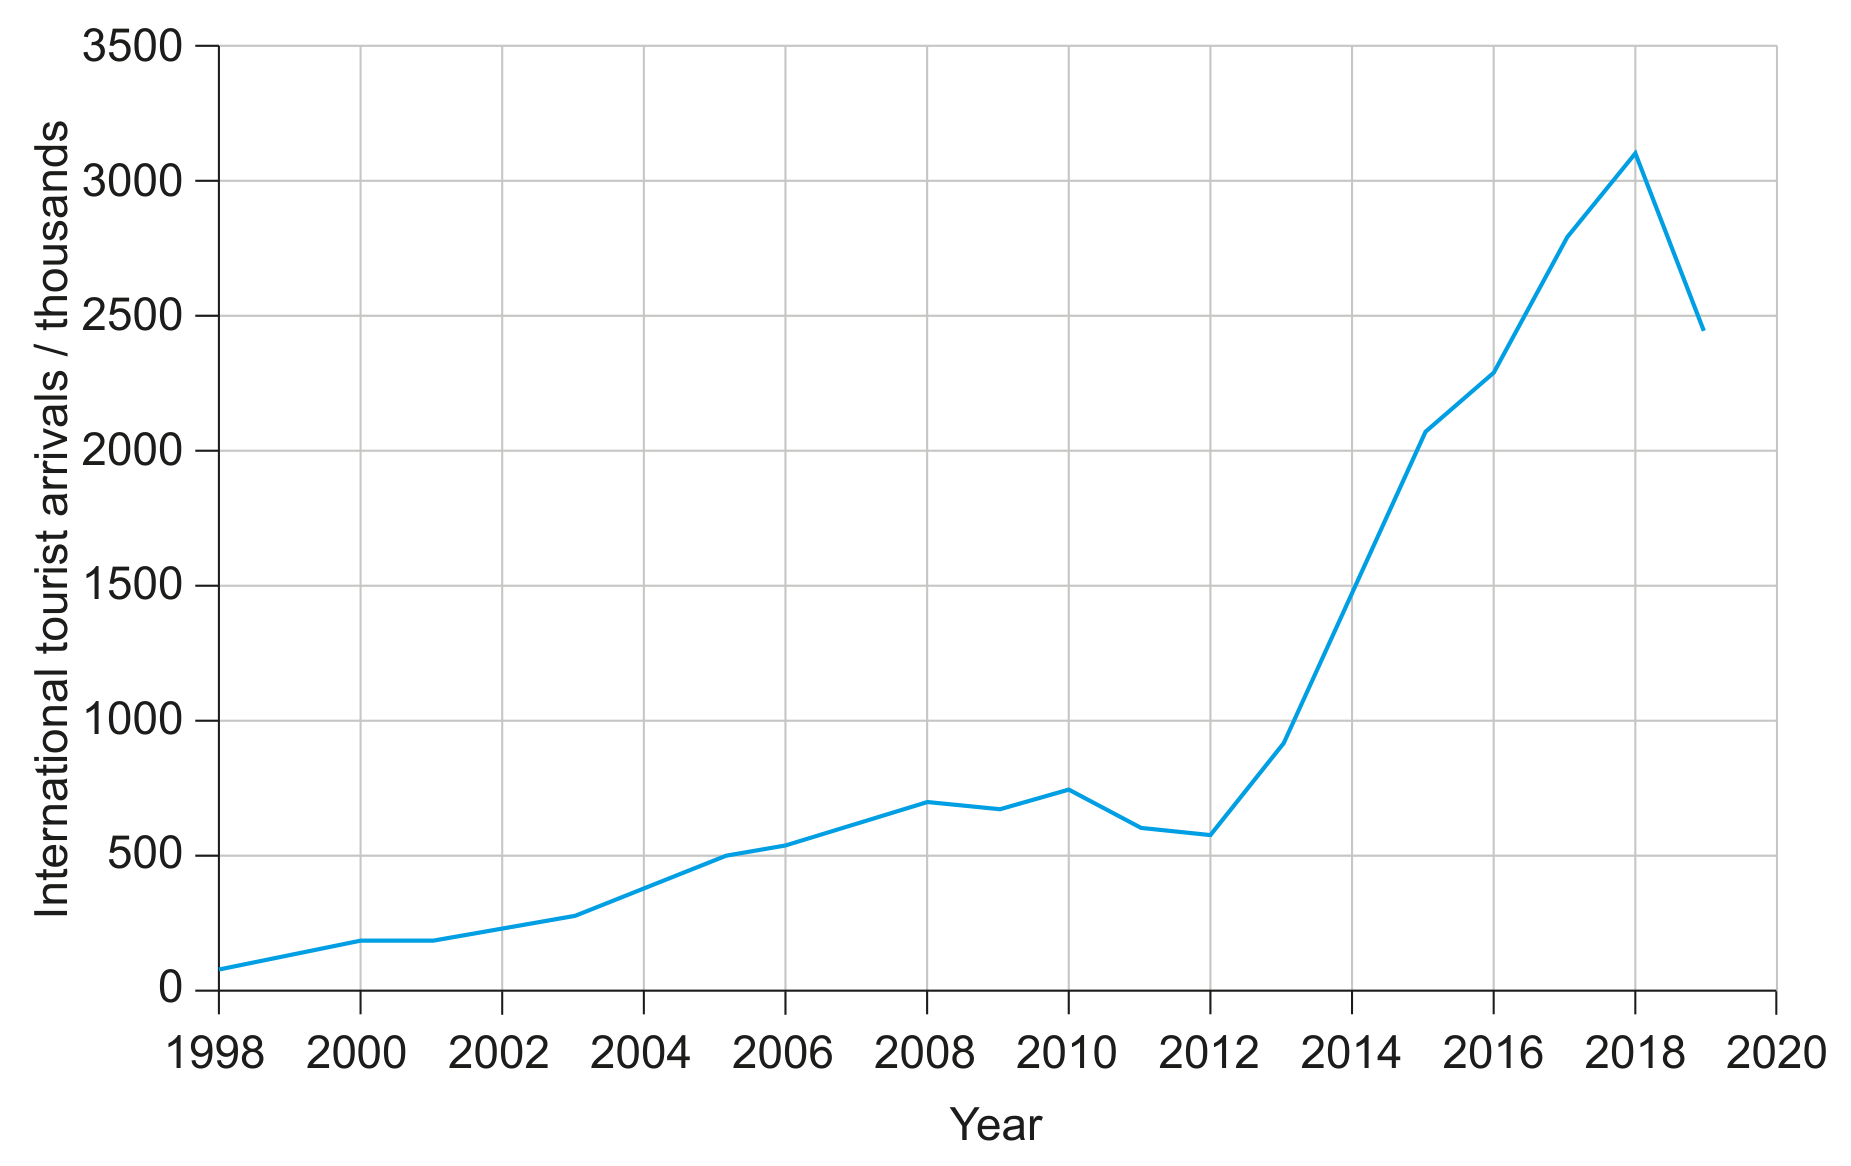
It has 198 ski resorts and receives over two million national tourists each year.

Hokkaido has six of Japan's 34 national parks and 10% of its land area is protected.
Many birds, amphibians, butterflies and mammals are endemic subspecies.
About 25% of hiking trails in Shikotsu-Toya and Daisetsuzan have been heavily degraded due to intensive use.

Figure 4: International tourist arrivals to Hokkaido

Figure 4: International tourist arrivals to Hokkaido

In 2000, the IUCN listed red-crowned cranes as Endangered; in 2020 it recommended changing status to Vulnerable.
50% of the world's population is found on Hokkaido; breeding in captivity has been unsuccessful.
Habitat loss occurred because wetlands were drained for agriculture; they are protected from hunting across their habitat.
Winter feeding stations are overcrowded; the Hokkaido resident population has lower genetic variability than the migratory Eurasian population.
They feed on fish, frogs, salamanders, cereal crops and insects, and are considered pests by some farmers.

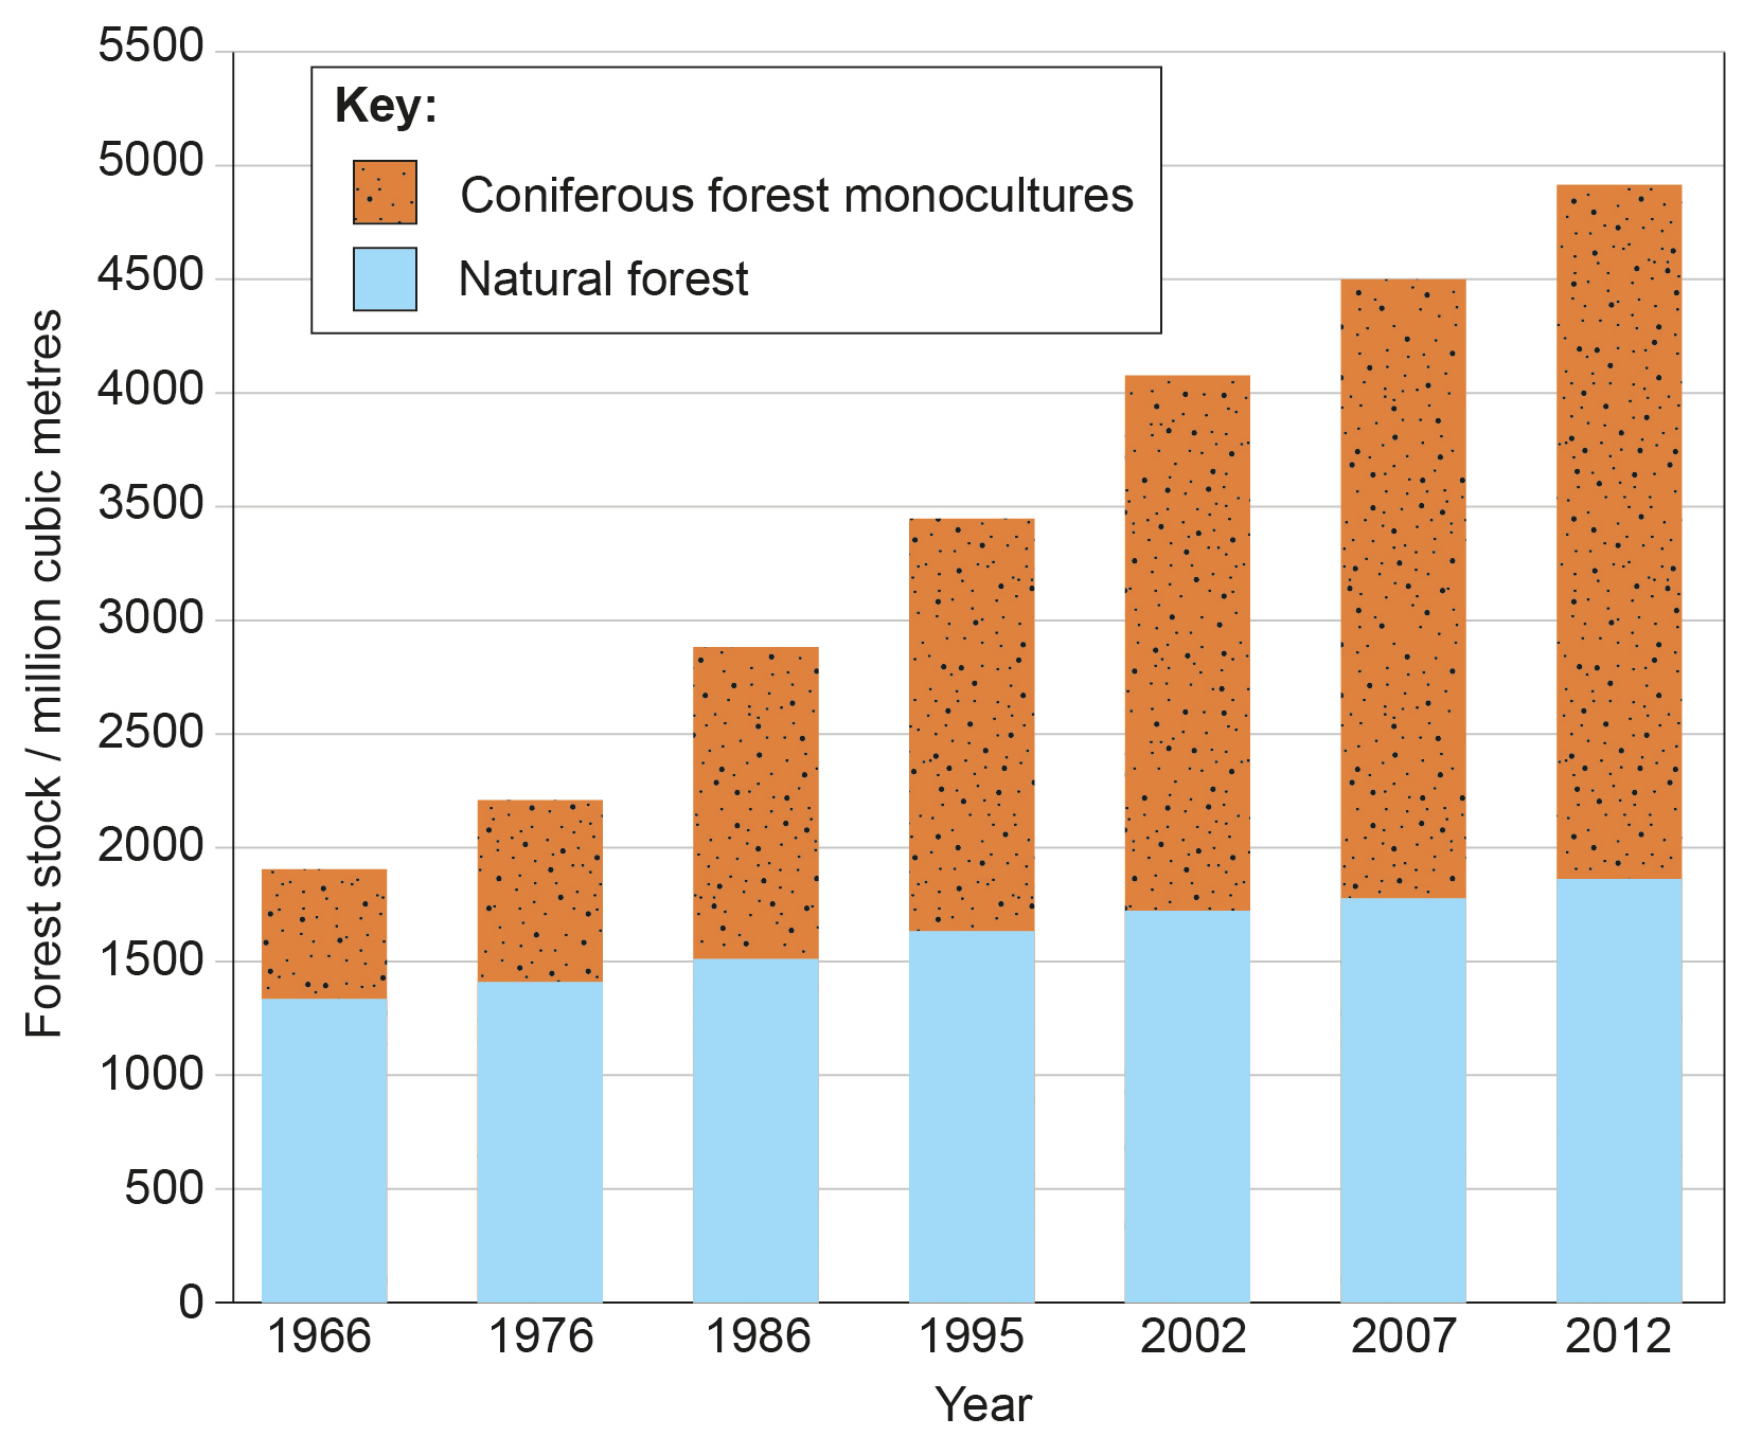
Since the 1950s, natural forests have been replaced by coniferous forest monocultures.
71% of Hokkaido land area is forest; 30% of forest area is coniferous forest monoculture.
A 2006 plan proposed returning one third of coniferous monocultures to natural forests or grasslands to protect biodiversity, protect aquatic recharge areas and improve recreation.

Figure 7(b): Natural forests and coniferous forest monocultures

Figure 7(b): Natural forests and coniferous forest monocultures

RegionFertility rateBirth rateDeath rate
Japan1.407.3910.97
Hokkaido1.286.2112.22

Figure 8(a): Demographic data for Japan and Hokkaido, 2018

Figure 8(b): Age-gender pyramid for Hokkaido, 2018

Figure 8(b): Age-gender pyramid for Hokkaido, 2018

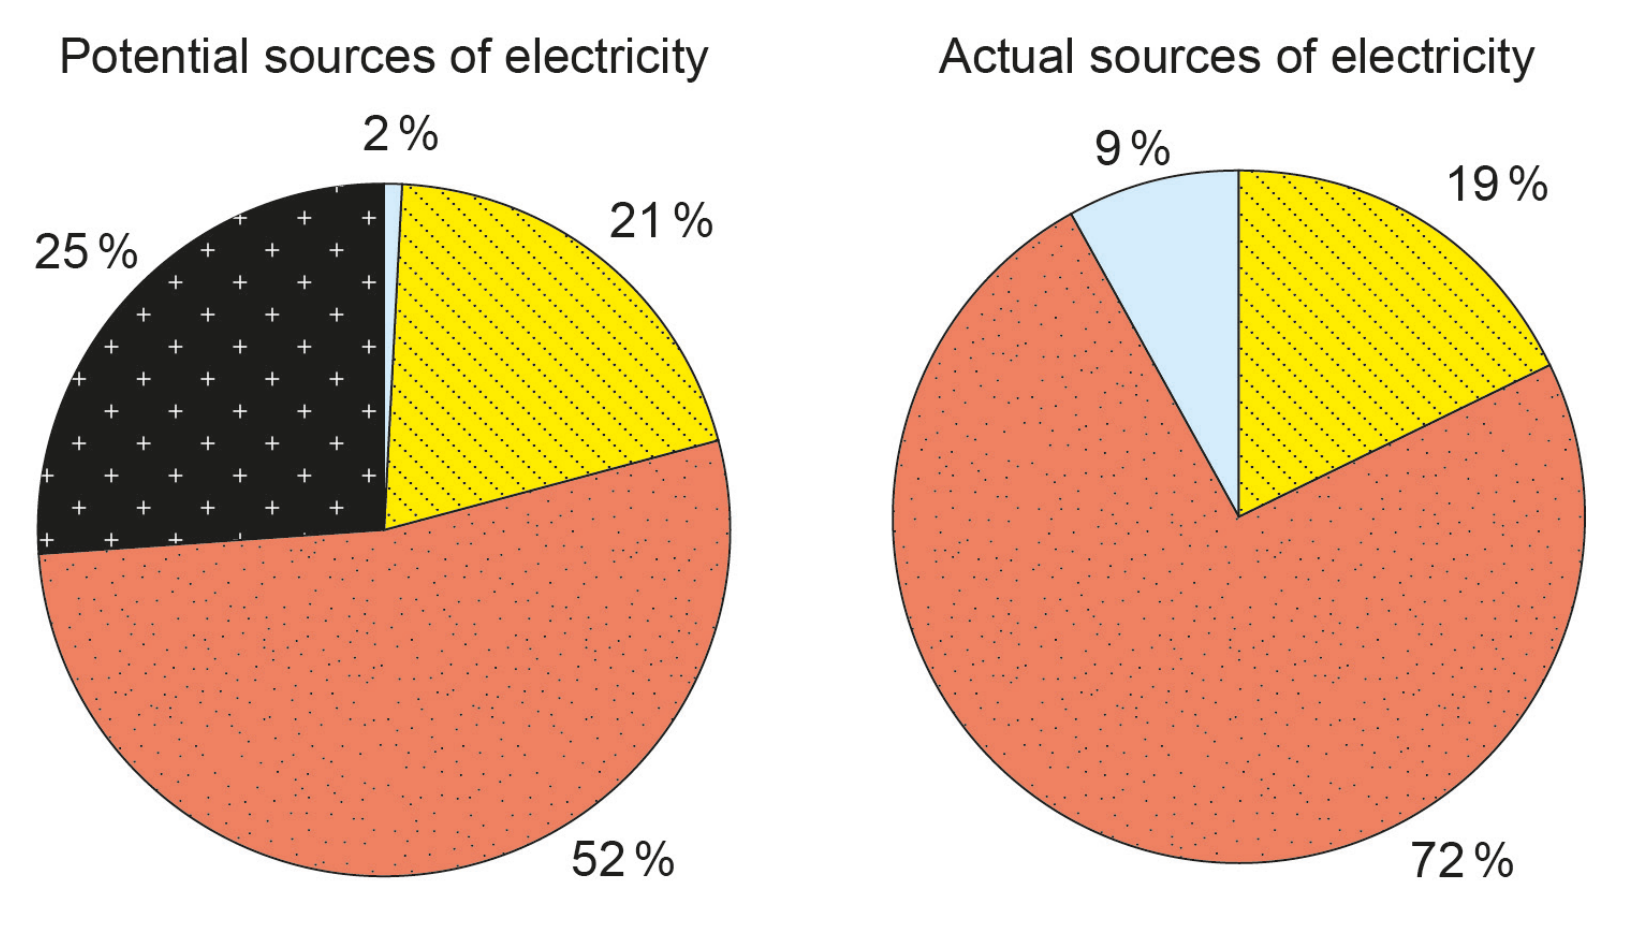
Figure 9(a) and 9(b): Potential and actual sources of electricity

Figure 9(a) and 9(b): Potential and actual sources of electricity

Japan aims to reduce CO2 emissions by 26% by 2030 to meet Paris Agreement targets.
Japan is resource-poor in fossil fuels and imports 94% of the energy it needs.
All potential hydroelectric sites have already been developed.
All future electricity-generation developments require an Environmental Impact Assessment.

Question 9

[Maximum number: 2]
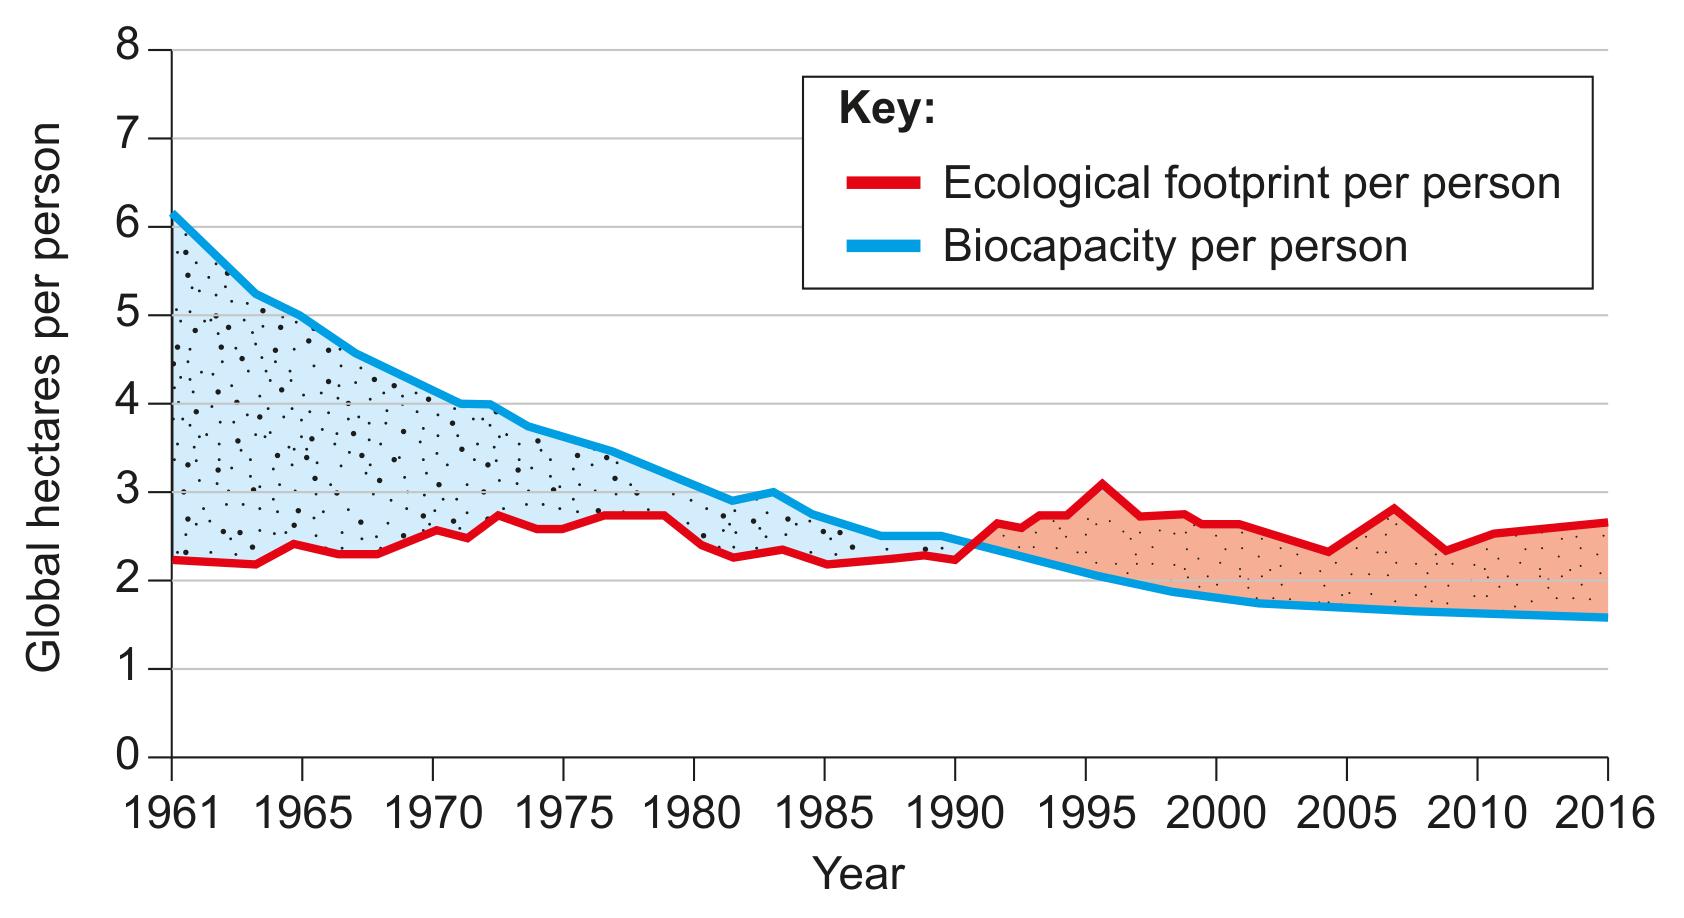
Figure 10(b): Ecological footprint and biocapacity per person in Costa Rica (1961-2016)

Figure 10(b): Ecological footprint and biocapacity per person in Costa Rica (1961-2016)

With reference to Figure 10(b), explain how sustainability in Costa Rica changed between 1961 and 2016.

Question 10

[Maximum number: 6]

Figure 10(a): Fact file on carbon neutrality
- Costa Rica pledged to become carbon neutral by balancing carbon dioxide output with carbon dioxide input.
- Since the mid-1980s, national methane emissions have decreased and a twenty-year ban was placed on oil exploration in 2002.
- Government encourages public transport, lower-emission vehicles, electric/biofuel/hybrid/hydrogen vehicles, renewable electricity and carbon offset schemes.
- The world's first certified carbon-neutral coffee producer was established in Costa Rica.

YearPercentage of forest cover
194076%76 \%
196254\%
198722\%
199843\%
201053\%

Figure 7(a): Variation in forest cover in Costa Rica between 1940 and 2010

forest policy
- PES pays landowners to plant trees in deforested areas and manage land sustainably.
- In 1996, deforestation of mature forest was banned.
- The goal is to achieve 60% forest coverage.

Figure 8(a): Economic activity (GDP) in Costa Rica by sector

Figure 8(a): Economic activity (GDP) in Costa Rica by sector

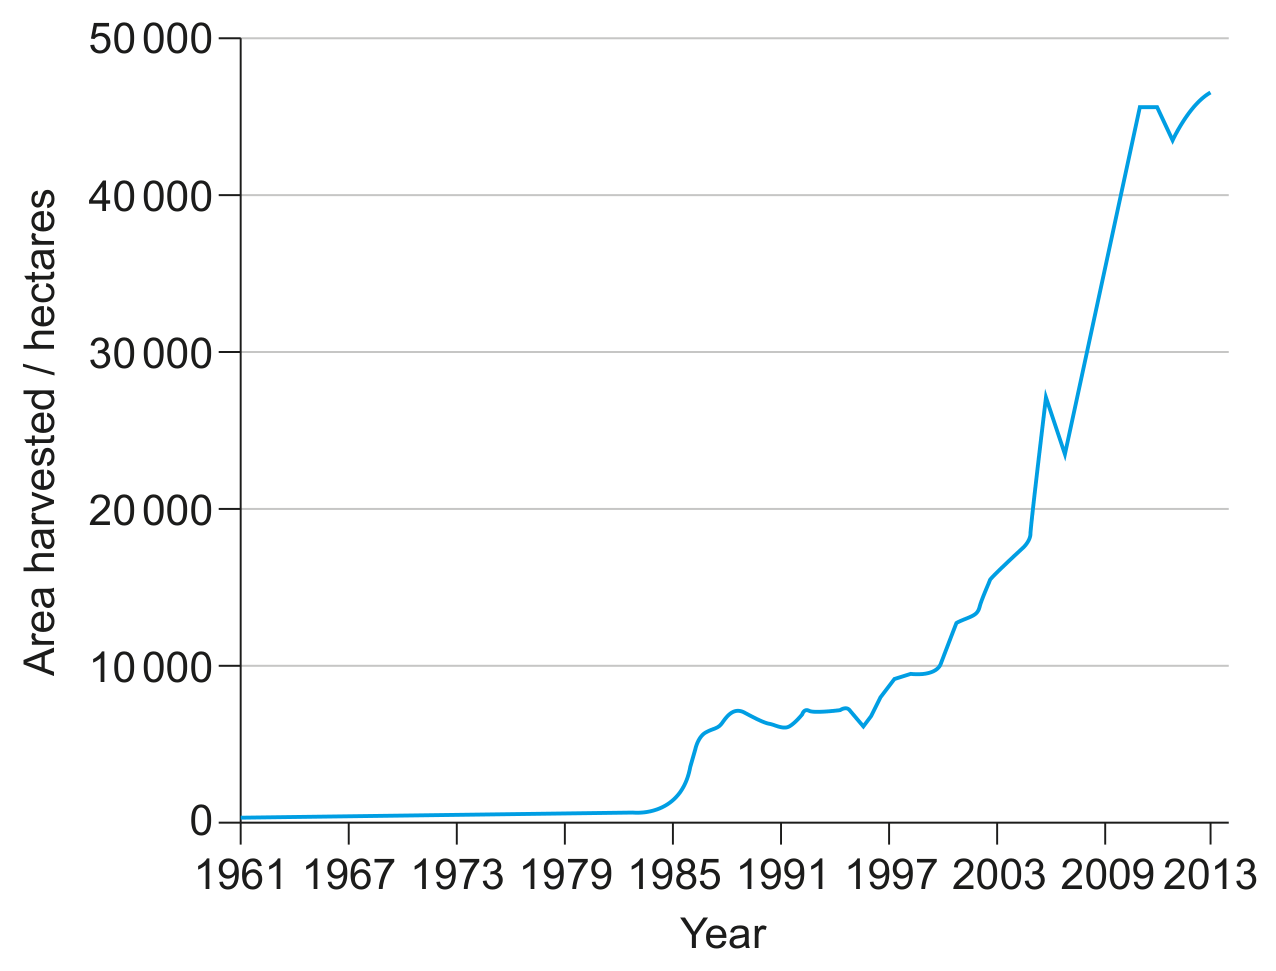
Figure 8(b): Land used in Costa Rica for pineapple production between 1961 and 2013

Figure 8(b): Land used in Costa Rica for pineapple production between 1961 and 2013

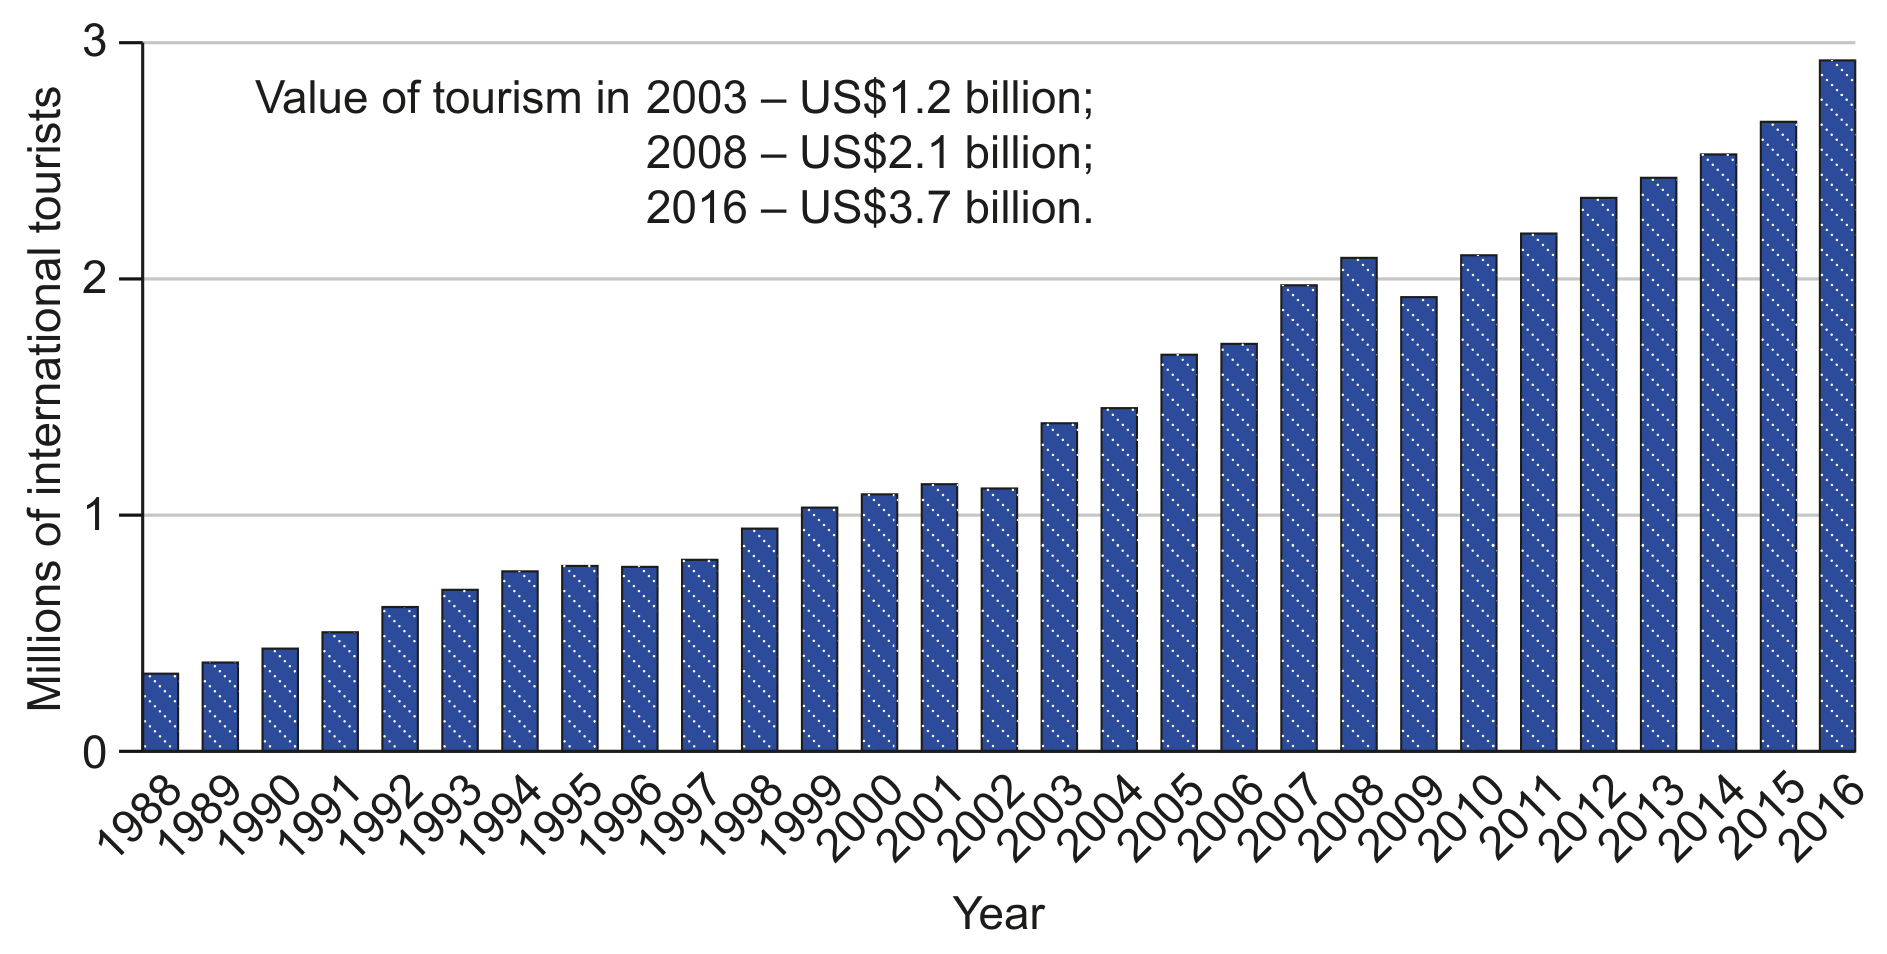
Figure 8(d): Growth in international tourism in Costa Rica (1988-2016)

Figure 8(d): Growth in international tourism in Costa Rica (1988-2016)

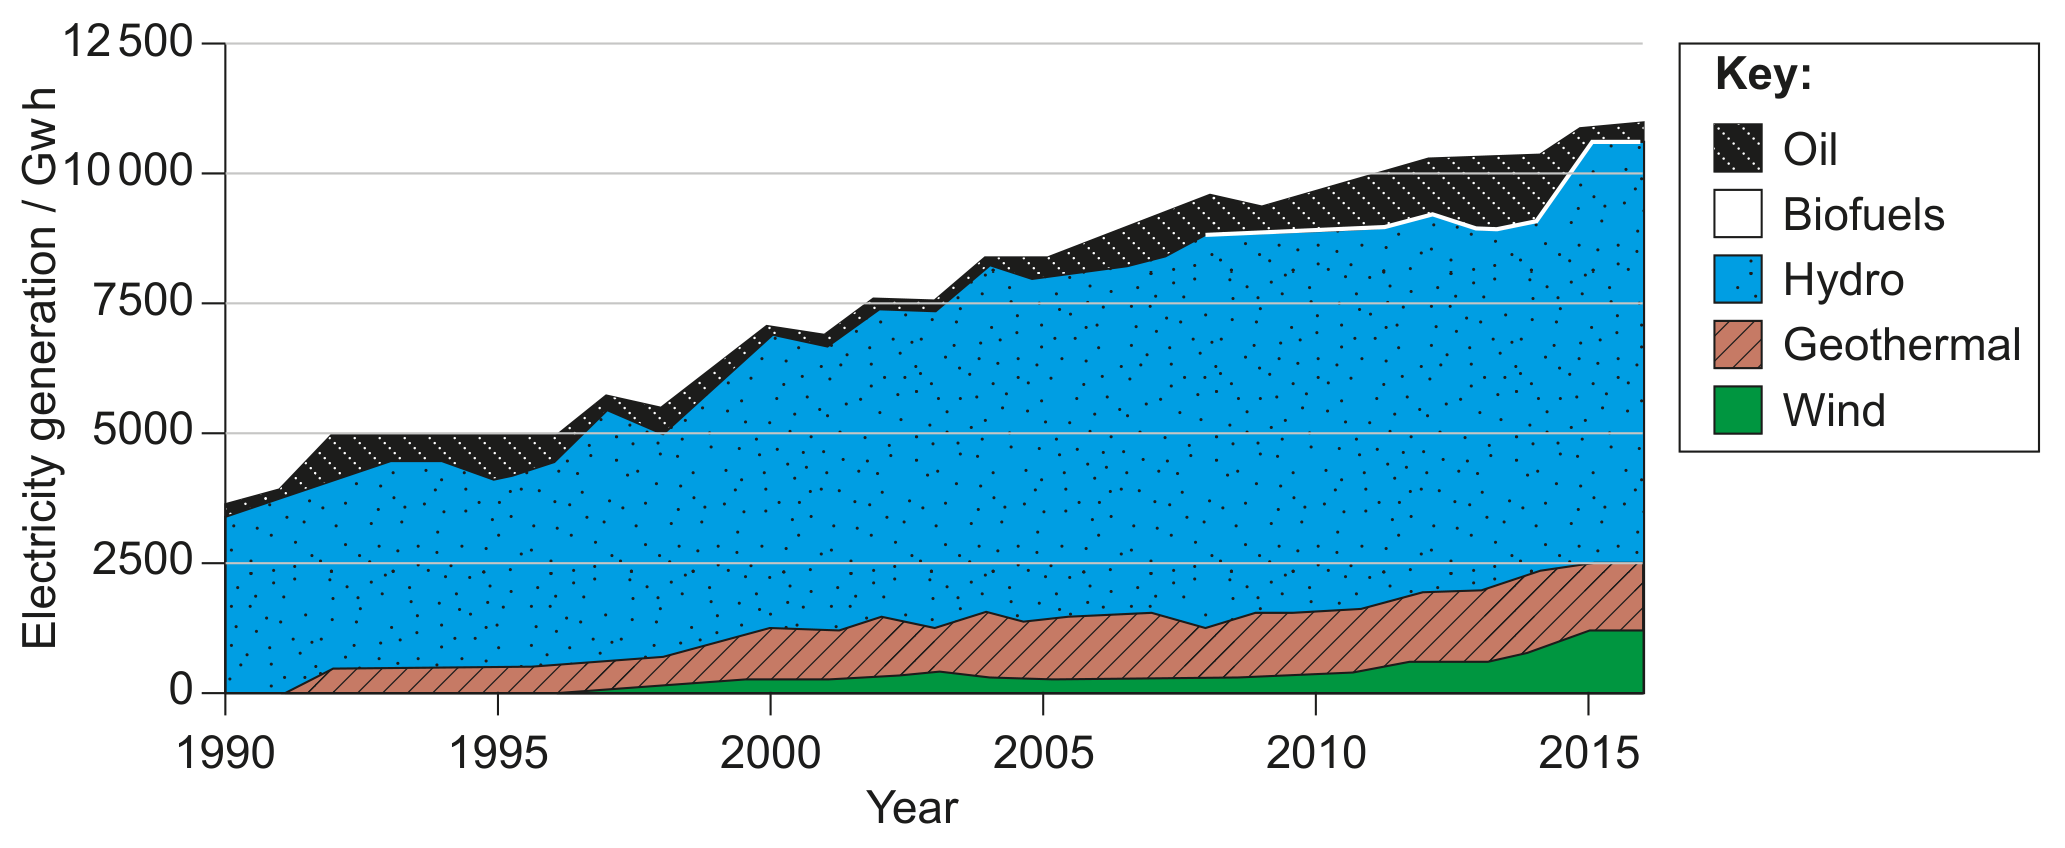
Figure 9(a): Electricity generation in Costa Rica by energy source (1990-2016)

Figure 9(a): Electricity generation in Costa Rica by energy source (1990-2016)

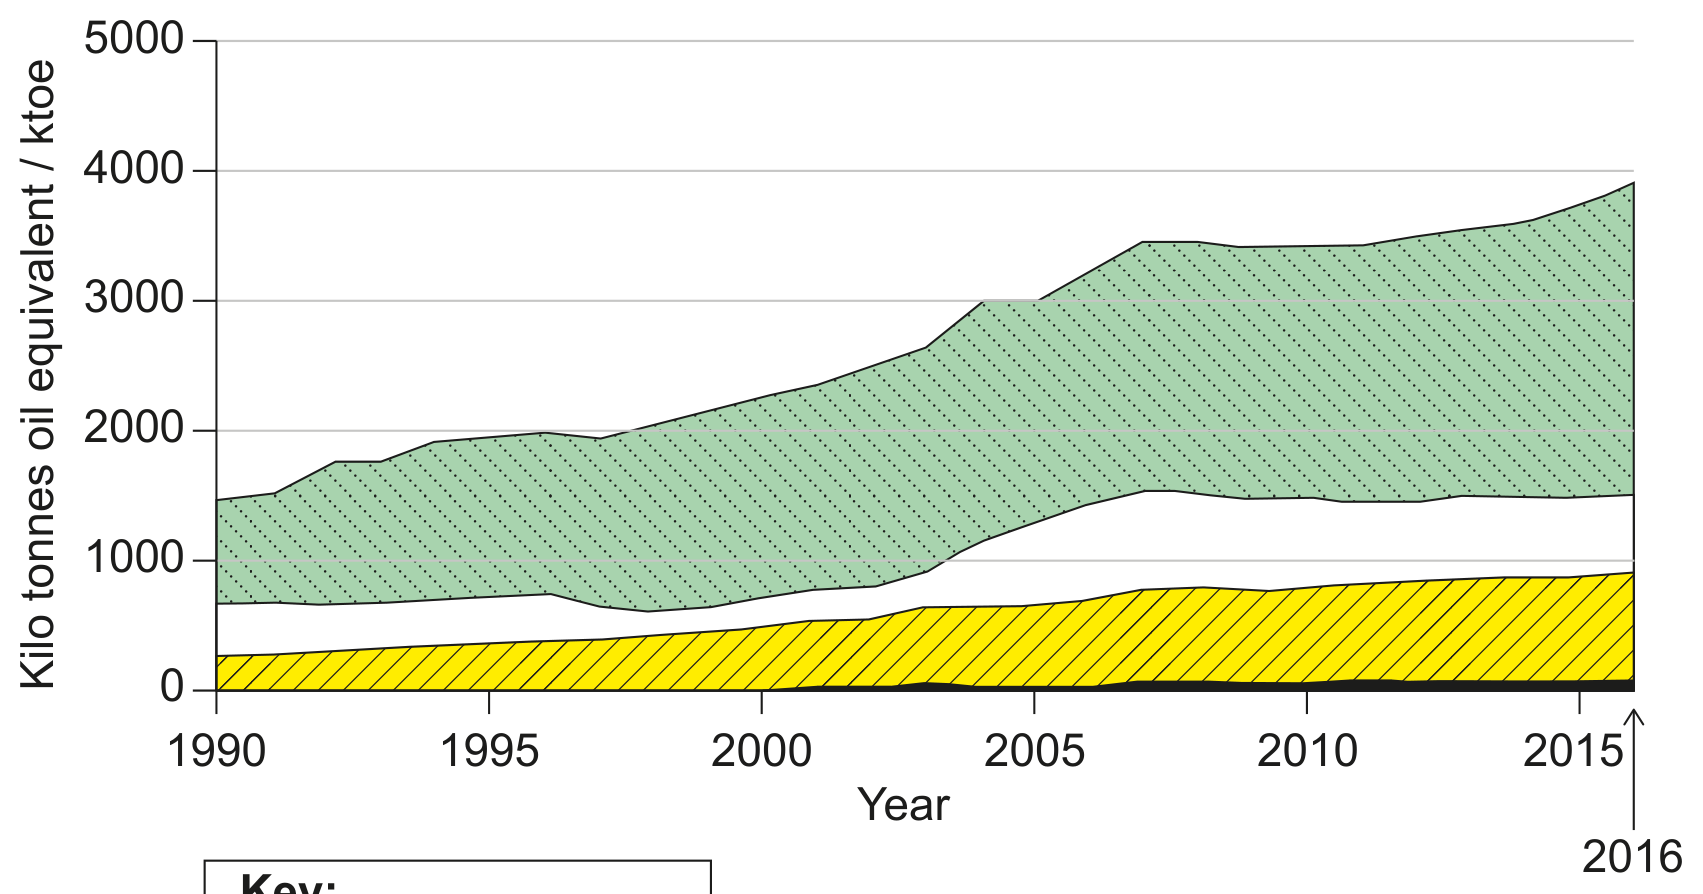
Figure 9(b): Total energy consumption in Costa Rica (including electricity) between 1990 and 2016

Figure 9(b): Total energy consumption in Costa Rica (including electricity) between 1990 and 2016

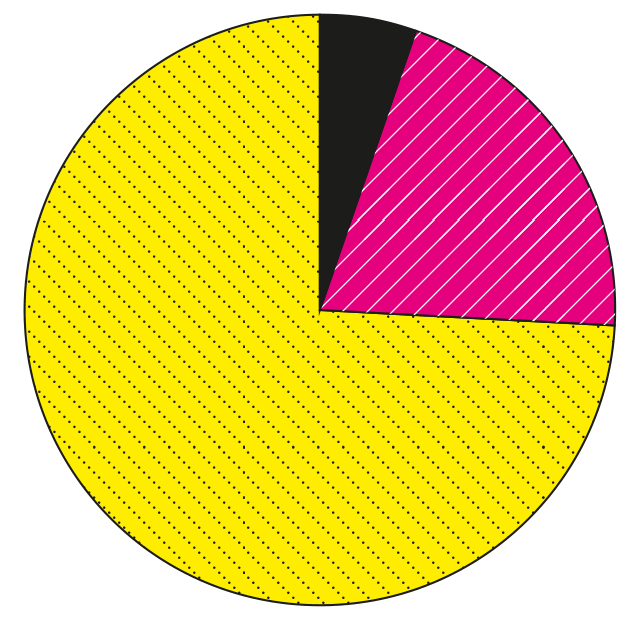
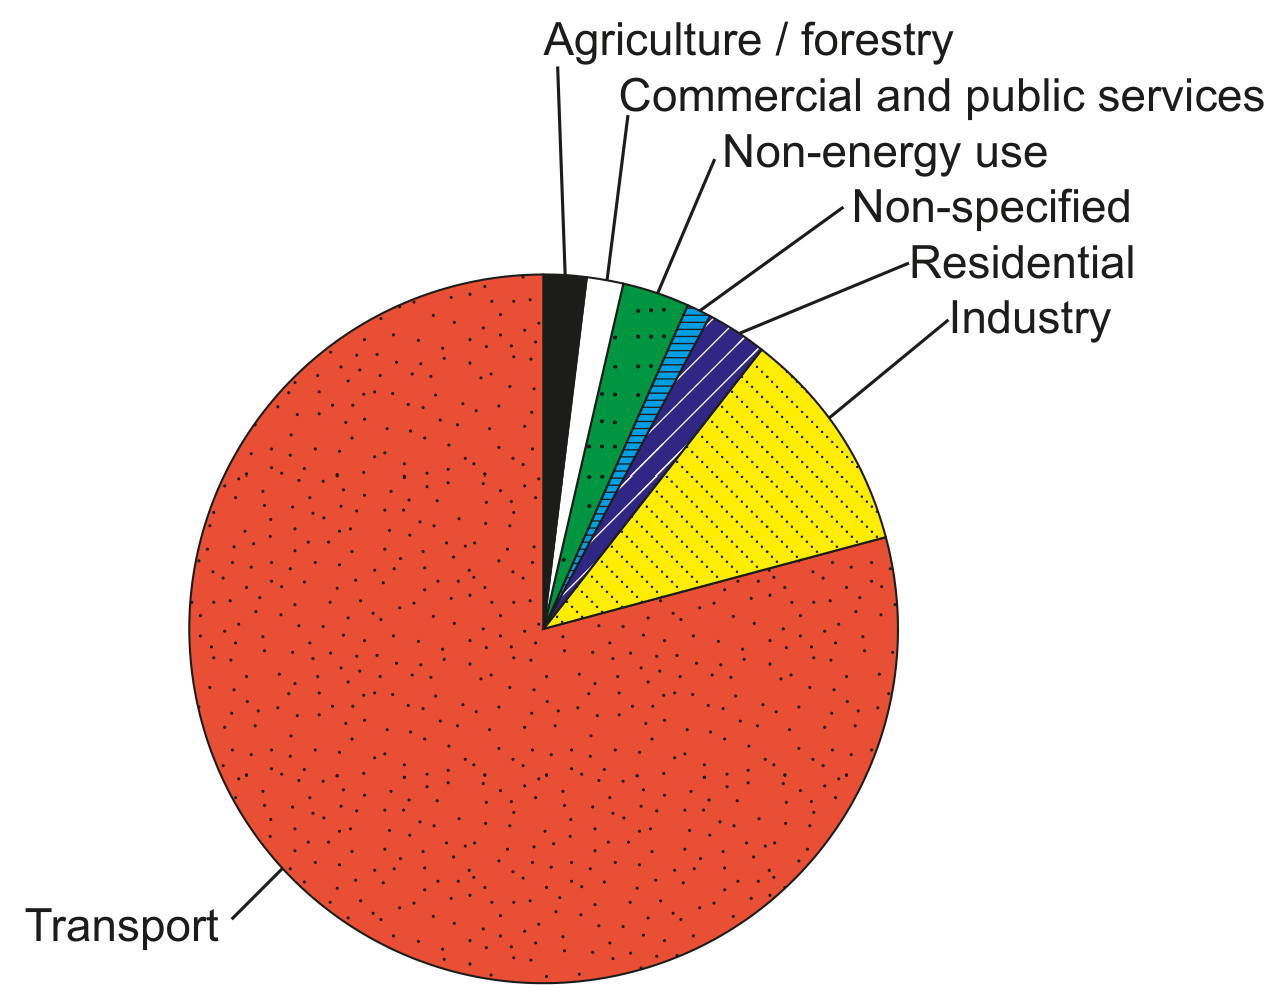
Figure 9(c): Consumption of crude oil in Costa Rica by sector (2016)

Figure 9(c): Consumption of crude oil in Costa Rica by sector (2016)

Figure 10(b): Ecological footprint and biocapacity per person in Costa Rica (1961-2016)

Figure 10(b): Ecological footprint and biocapacity per person in Costa Rica (1961-2016)

With reference to the information in the resource booklet, to what extent has Costa Rica's aim to become carbon neutral led to a more environmentally-sustainable nation?

Question 7(a)

[Maximum number: 4]

Outline how the ecological footprint (EF) of a human population is likely to change through the stages of the demographic transition model (DTM).

Question 7(a)

[Maximum number: 4]

Outline four ways in which the geographical location of a human population may influence its ecological footprint.

0 selected