IB ESS 8.1 Human Populations Topic Practice

EduNinja

Question 1

[Maximum number: 8]
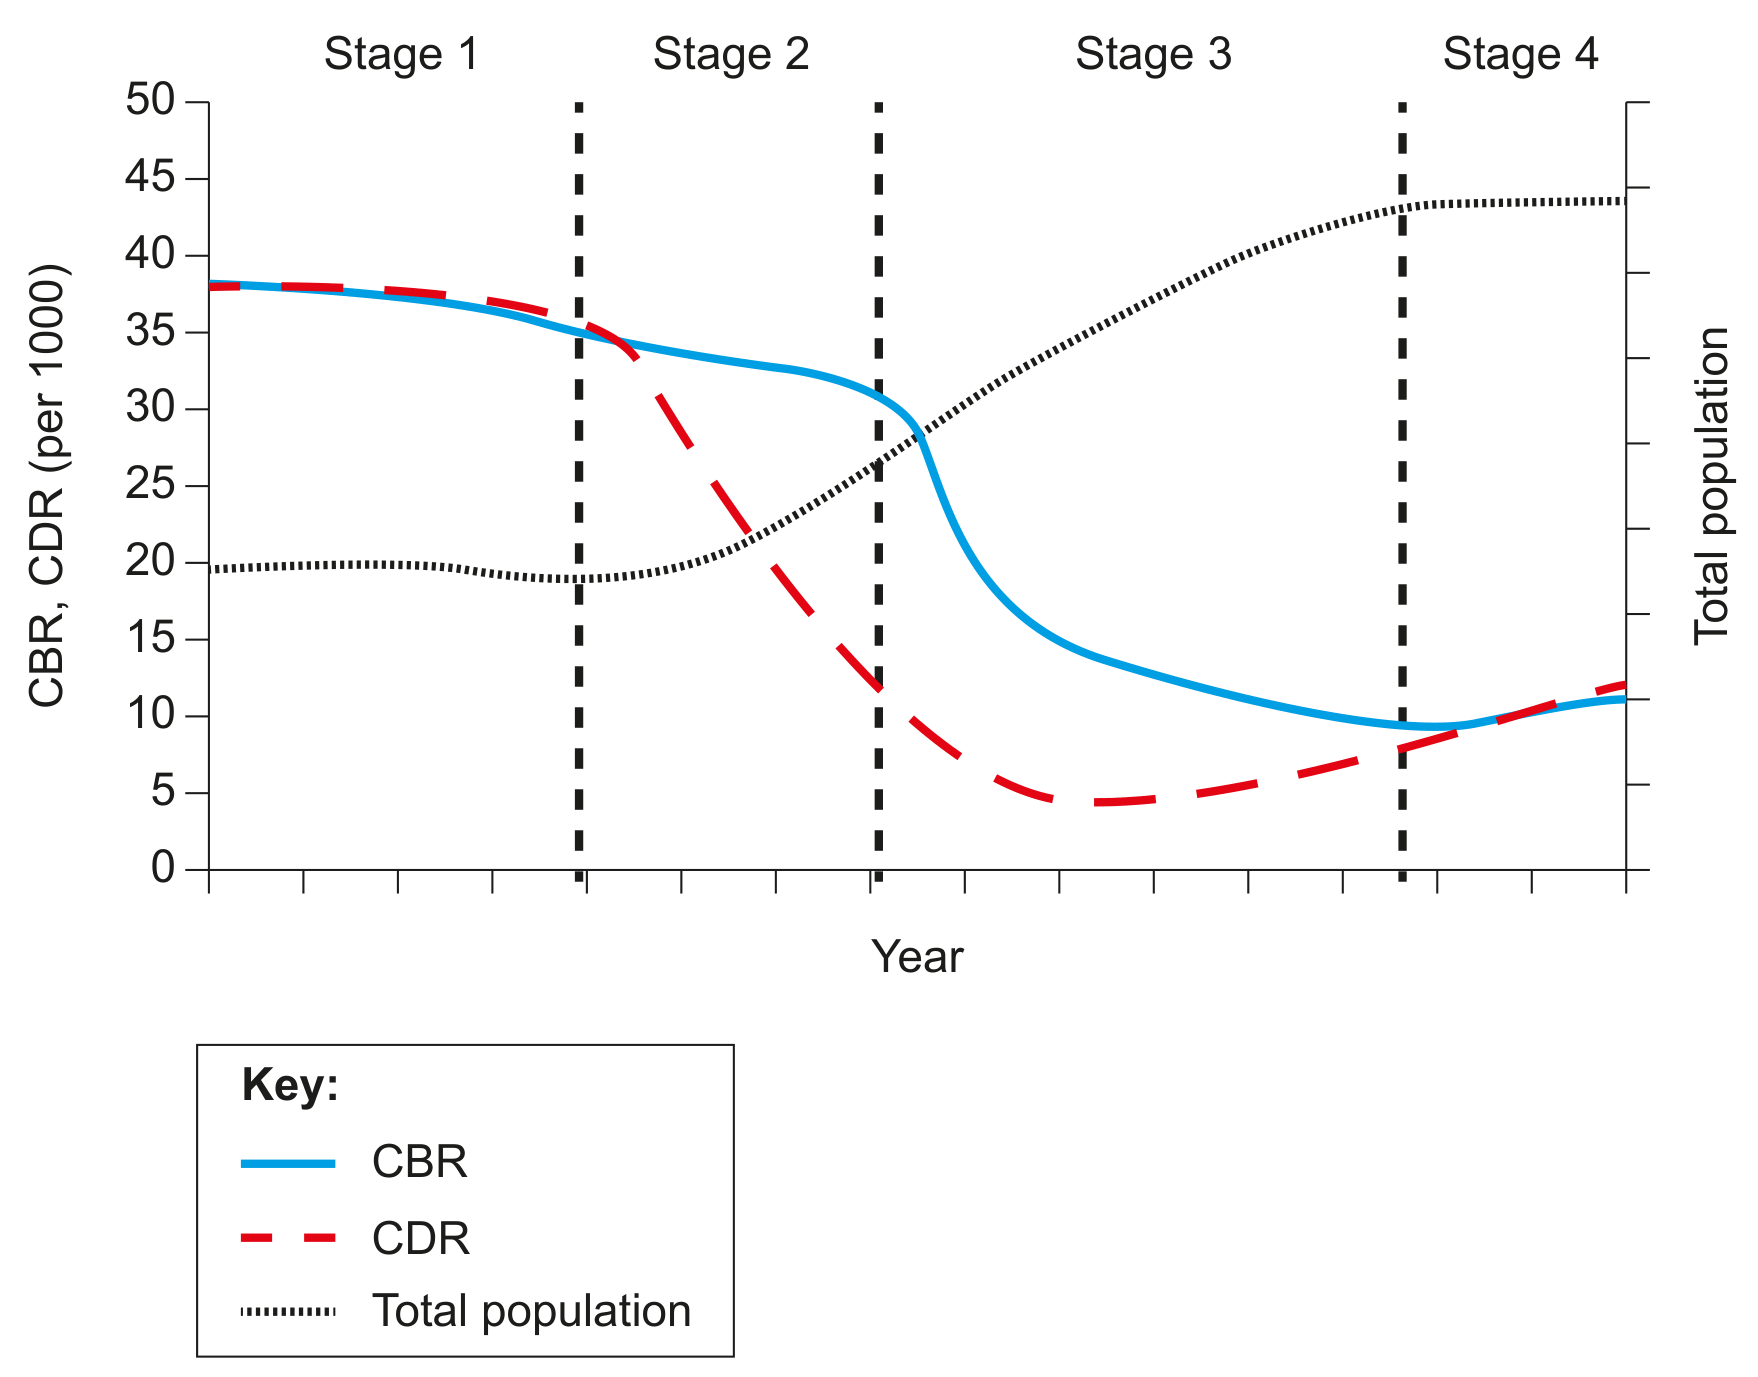
Figure 1: Demographic transition model

Figure 1: Demographic transition model

Question 1(a)

(a)

Costa Rica has a crude birth rate (CBR) of 15.3 and a crude death rate (CDR) of 4.8.

[ 3 ]

Question 1(a)(i)

(i)

Identify the stage in which Costa Rica would be placed on the demographic transition model shown in Figure 1.

[ 1 ]

Question 1(a)(ii)

(ii)

Calculate the natural increase rate (NIR) for Costa Rica.

[ 1 ]

Question 1(a)(iii)

(iii)

Calculate the doubling time for Costa Rica.

[ 1 ]

Question 1(b)

(b)

Outline one strength and one limitation of the demographic transition model.

[ 2 ]

Question 1(c)

(c)

Outline the socioeconomic factors that may cause a society to move from Stage 2 to Stage 3 on the demographic transition model.

[ 3 ]
Question 2

Question 2(a)

(a)
Population (estimated)5 million (including 104000 indigenous people)
Natural increase rate1.05\%
Crude birth rate15.3/1000
Crude death rate4.8/1000
Life expectancy / years78.9
Total fertility rate1.89 (Note: In 1973, total fertility rate was 5.6)

Figure 4(a): Demographic data for 2018

Based on the 2018 data in Figure 4(a), calculate the doubling time for the population of Costa Rica.

[ 1 ]

Question 2(b)

(b)
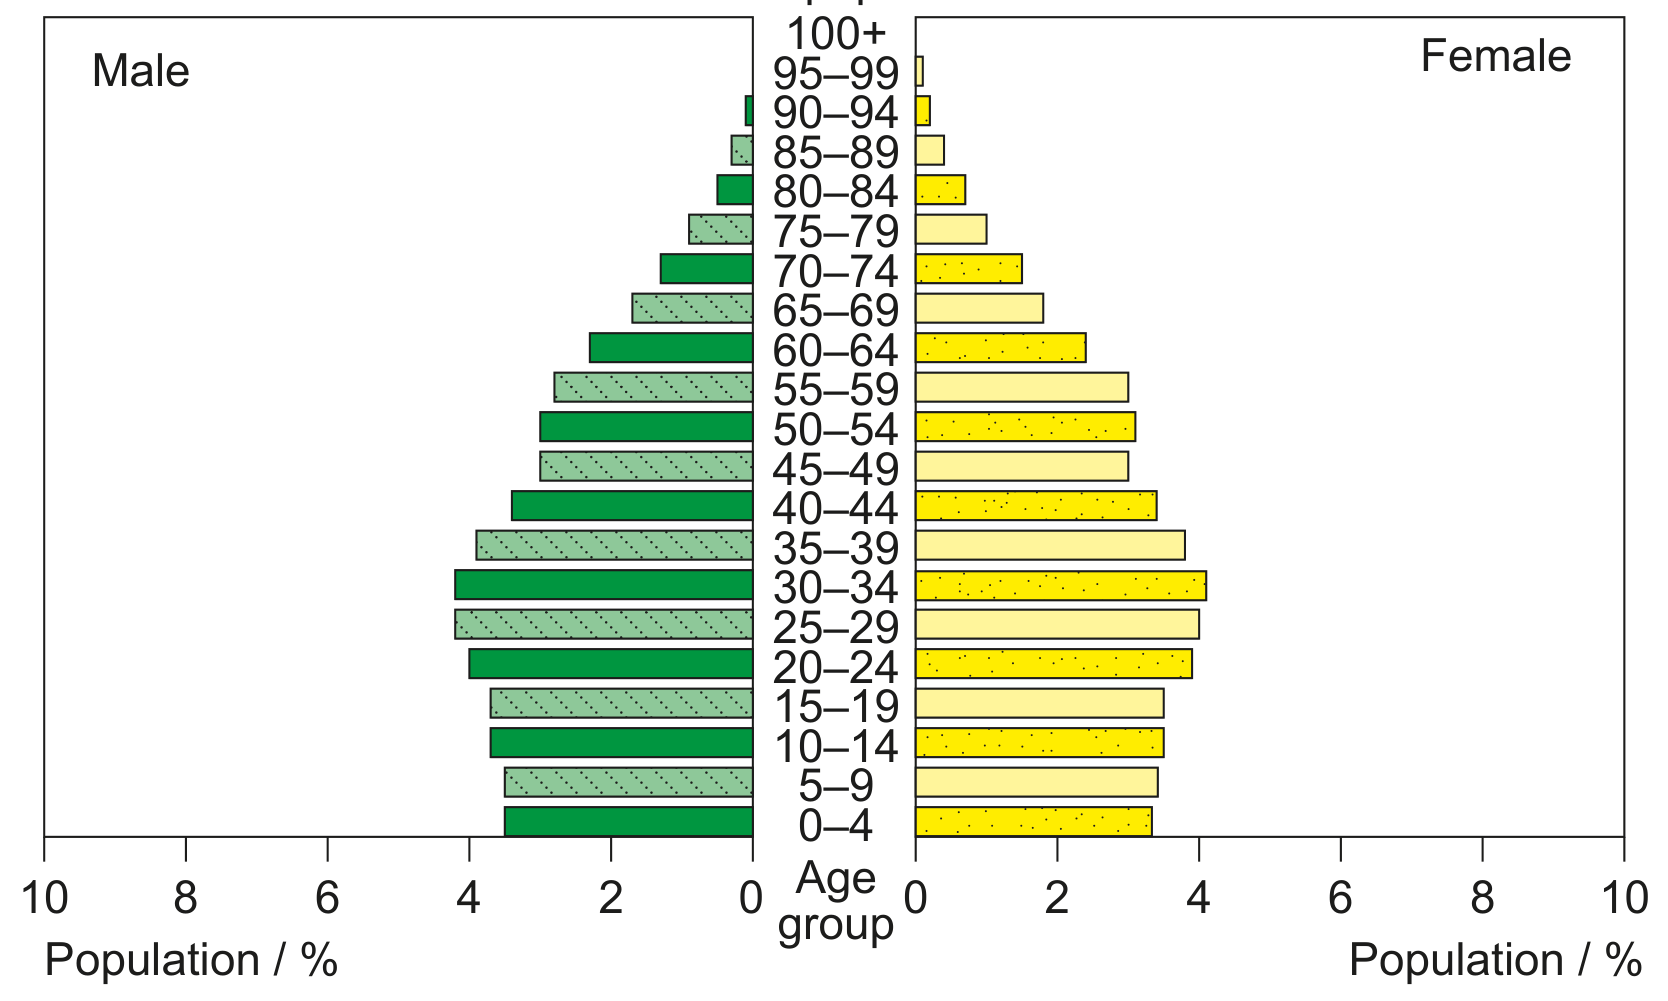
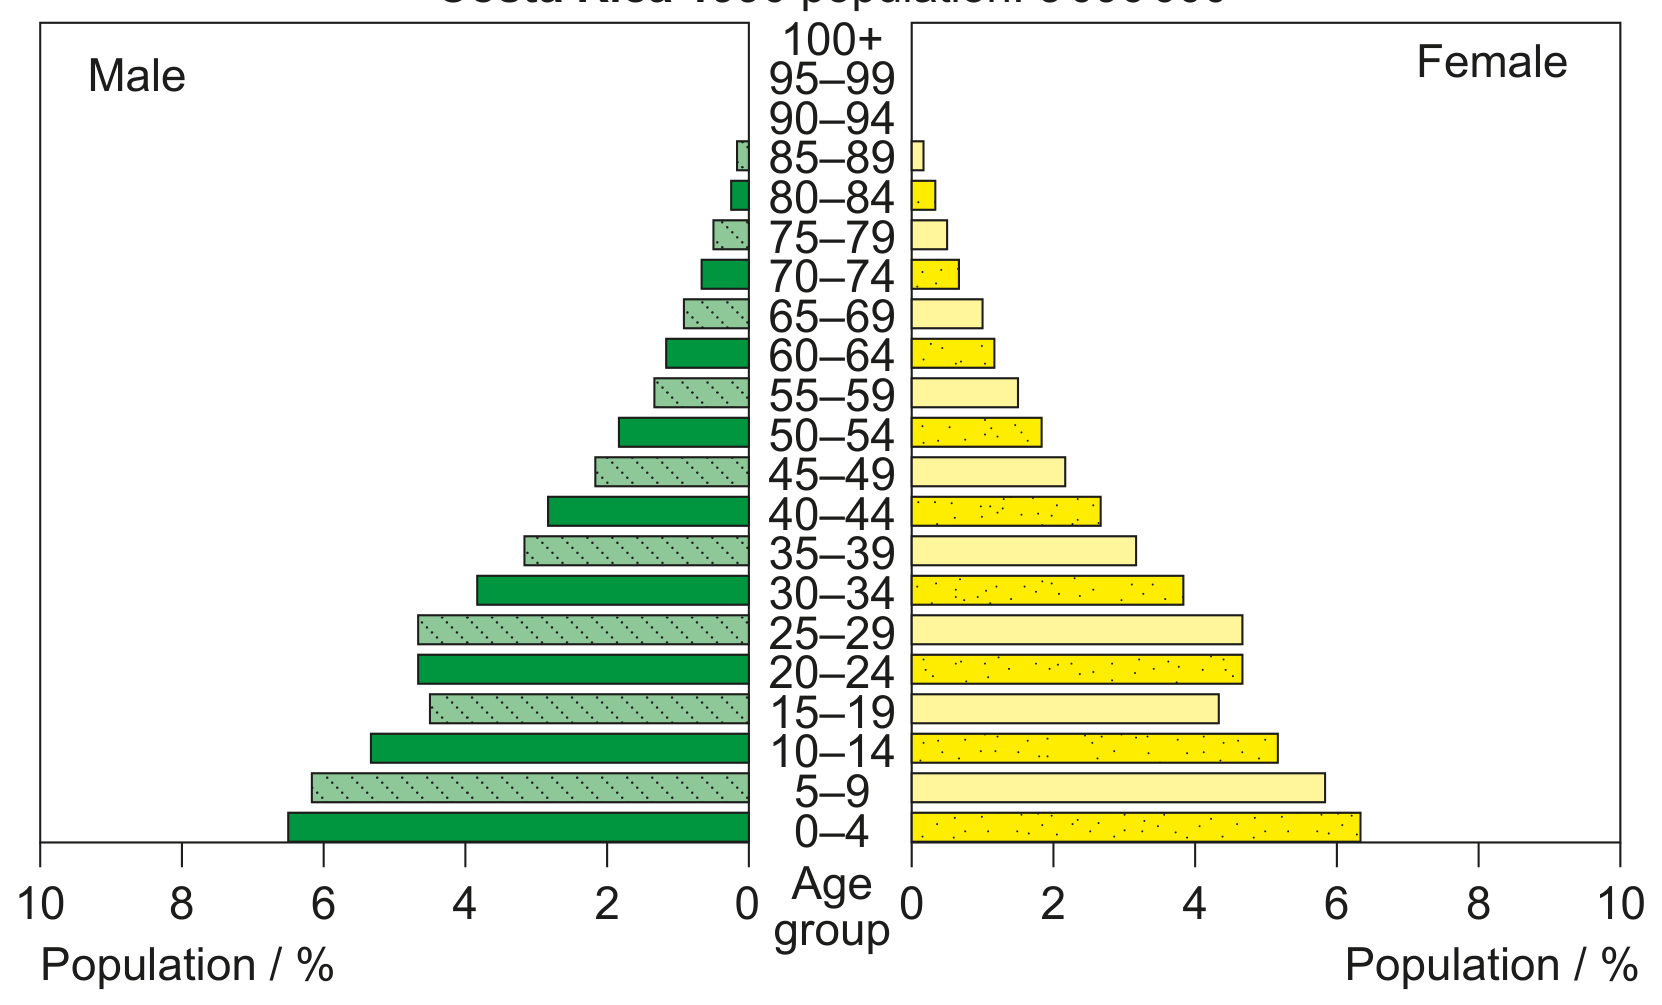
Figure 4(b): Age-gender pyramid for Costa Rica in 1990 and projected pyramids for 2020 and 2050

Figure 4(b): Age-gender pyramid for Costa Rica in 1990 and projected pyramids for 2020 and 2050

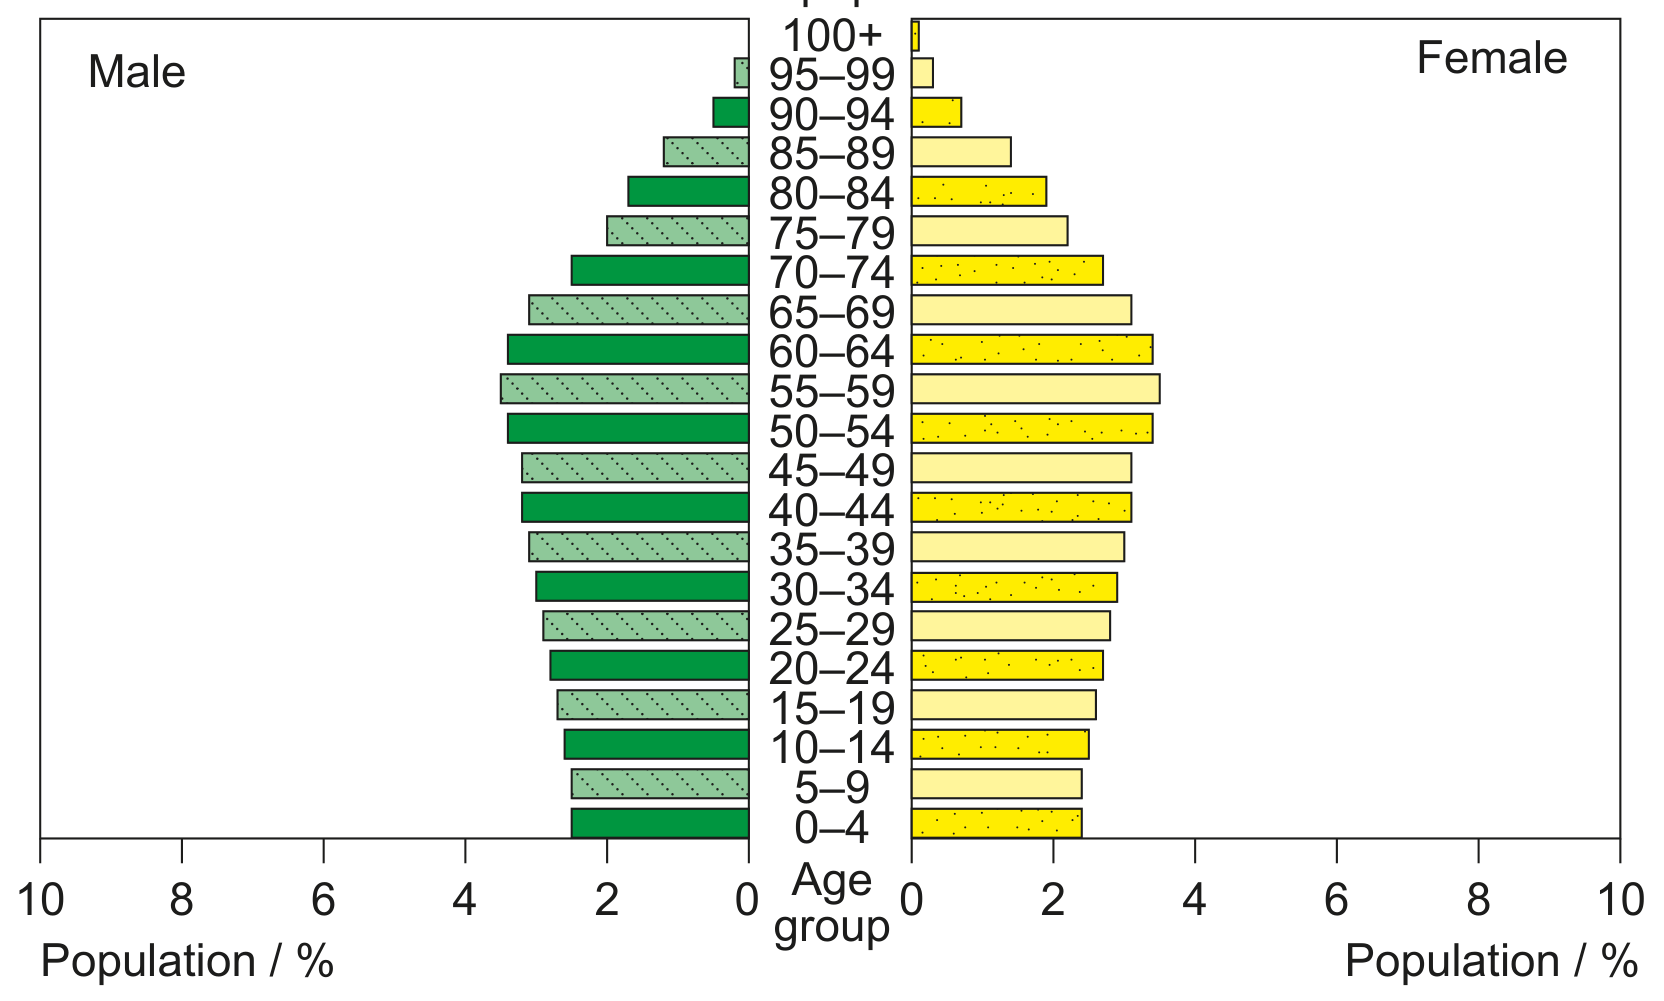
(Figure 4(b) continued)

(Figure 4(b) continued)

Costa Rica 2050 population: 5760000

Costa Rica 2050 population: 5760000

With reference to Figure 4(b), suggest three possible reasons for the changes between the age-gender pyramid for 1990 and that projected for 2050.

[ 3 ]

Question 2

[Maximum number: 2]
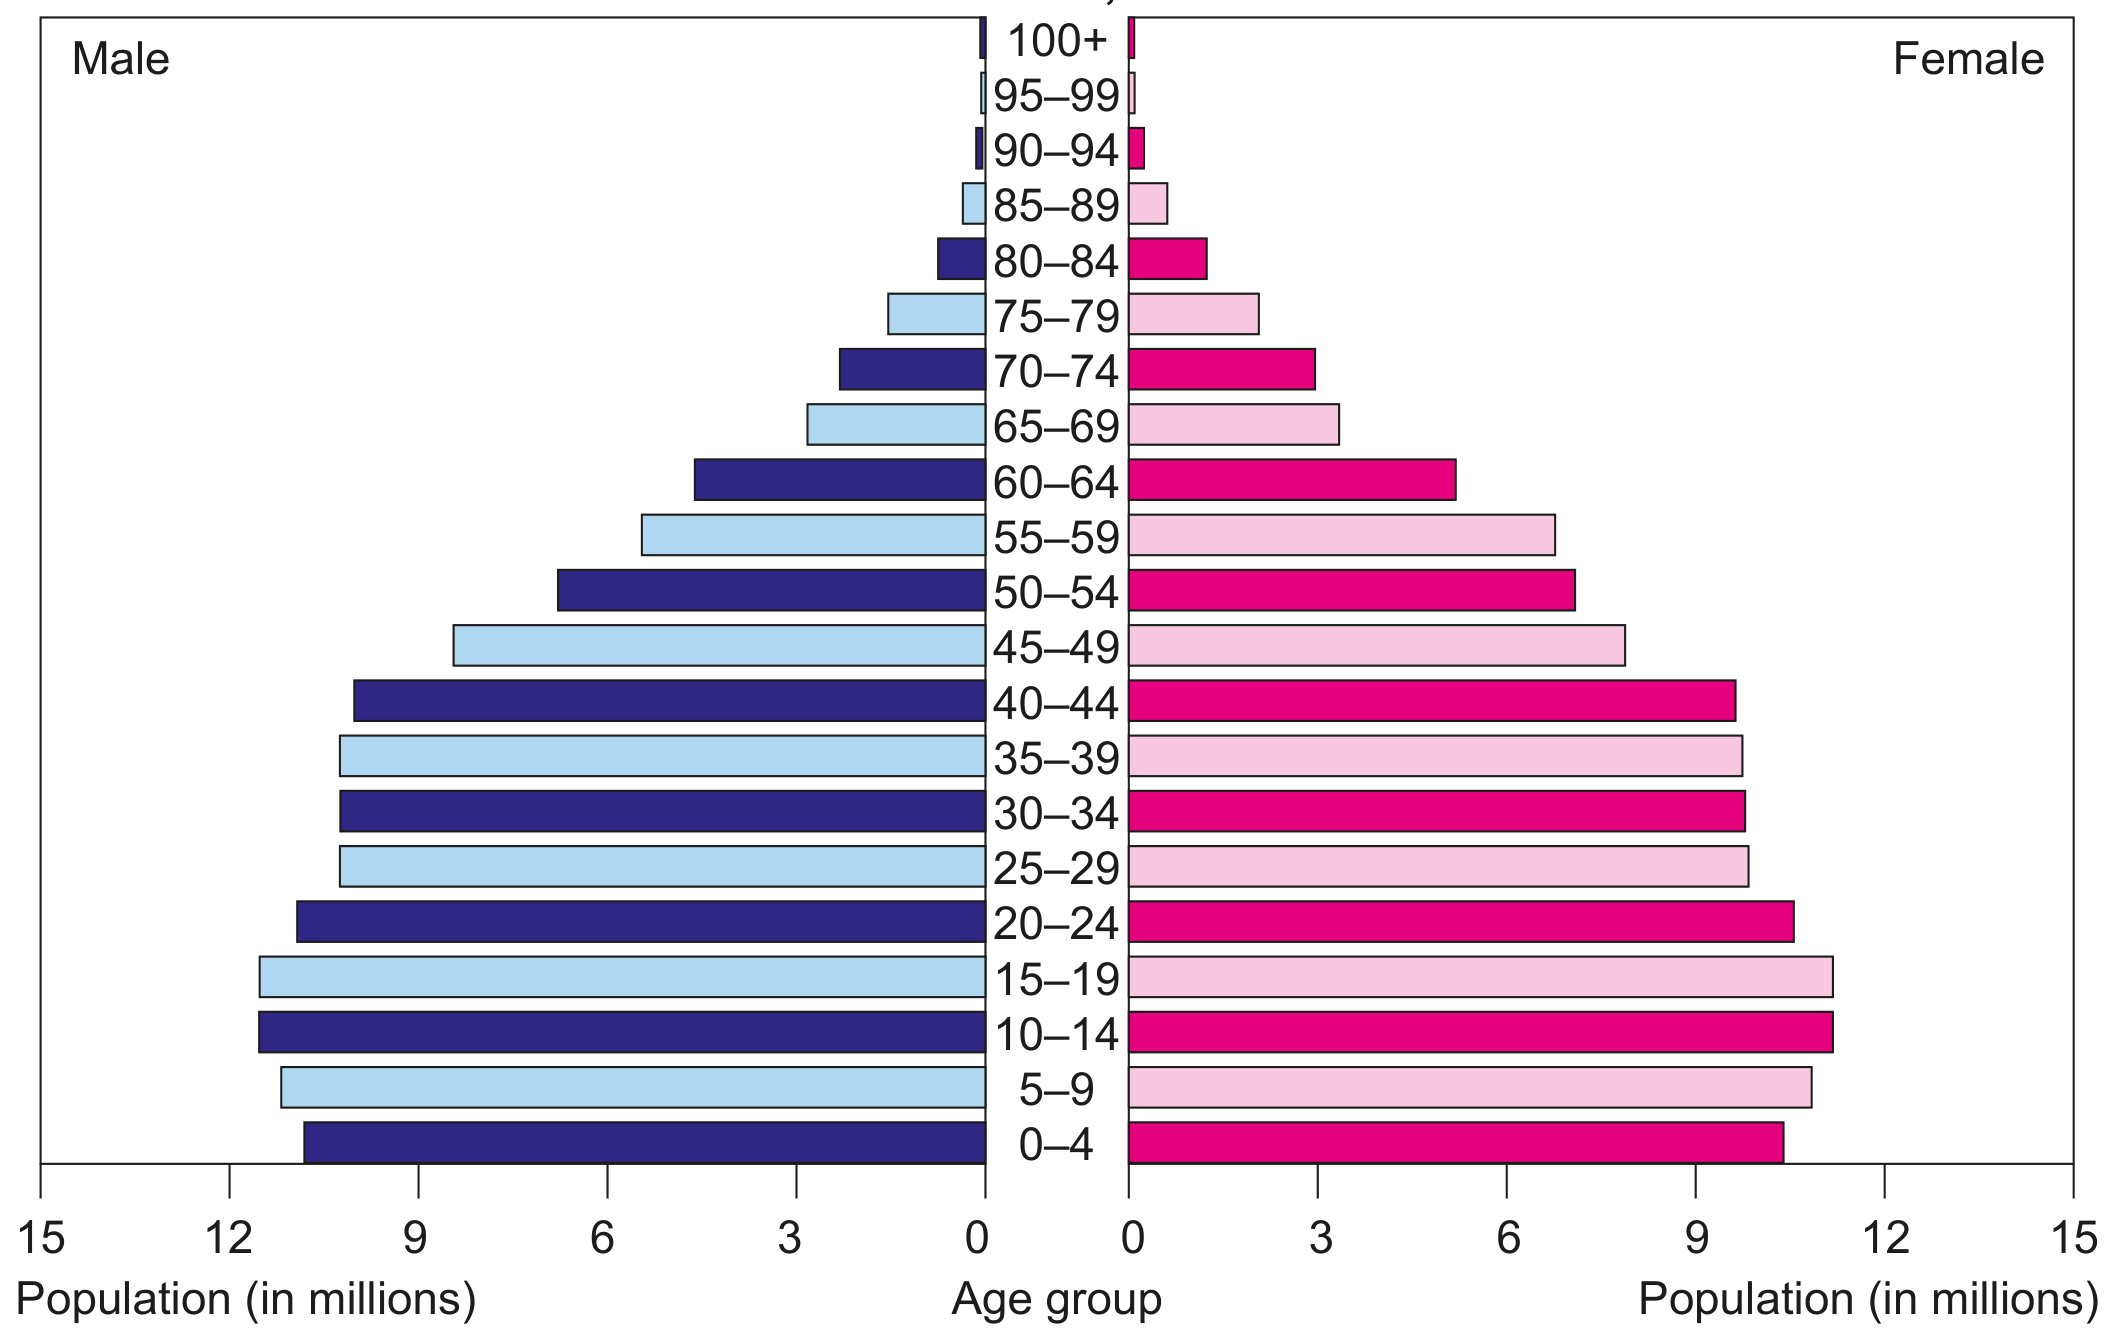
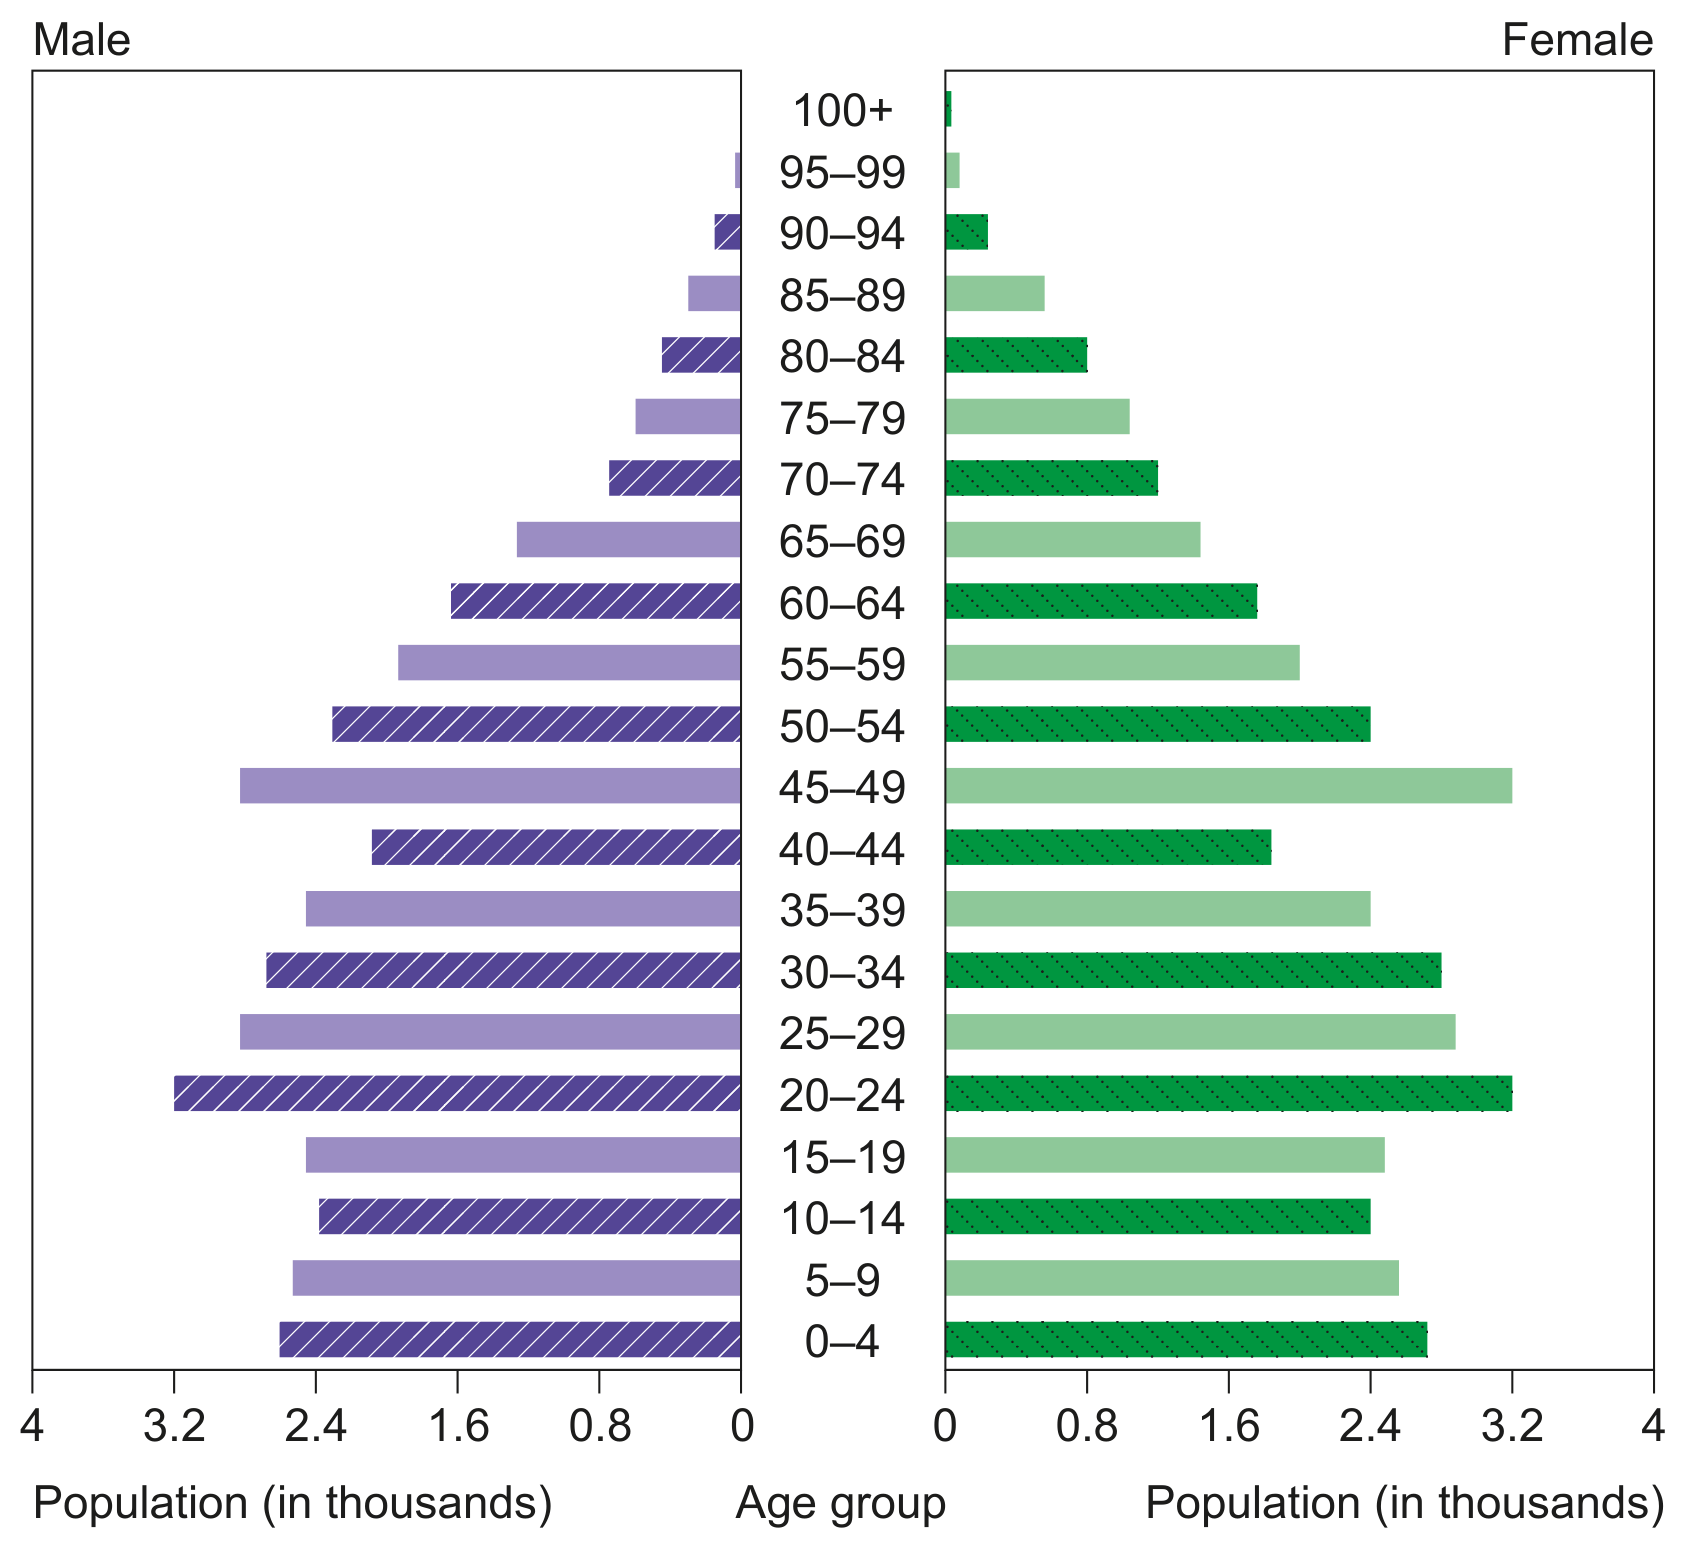
Figure 3(b): Age-gender pyramid for Indonesia, 2016

Figure 3(b): Age-gender pyramid for Indonesia, 2016

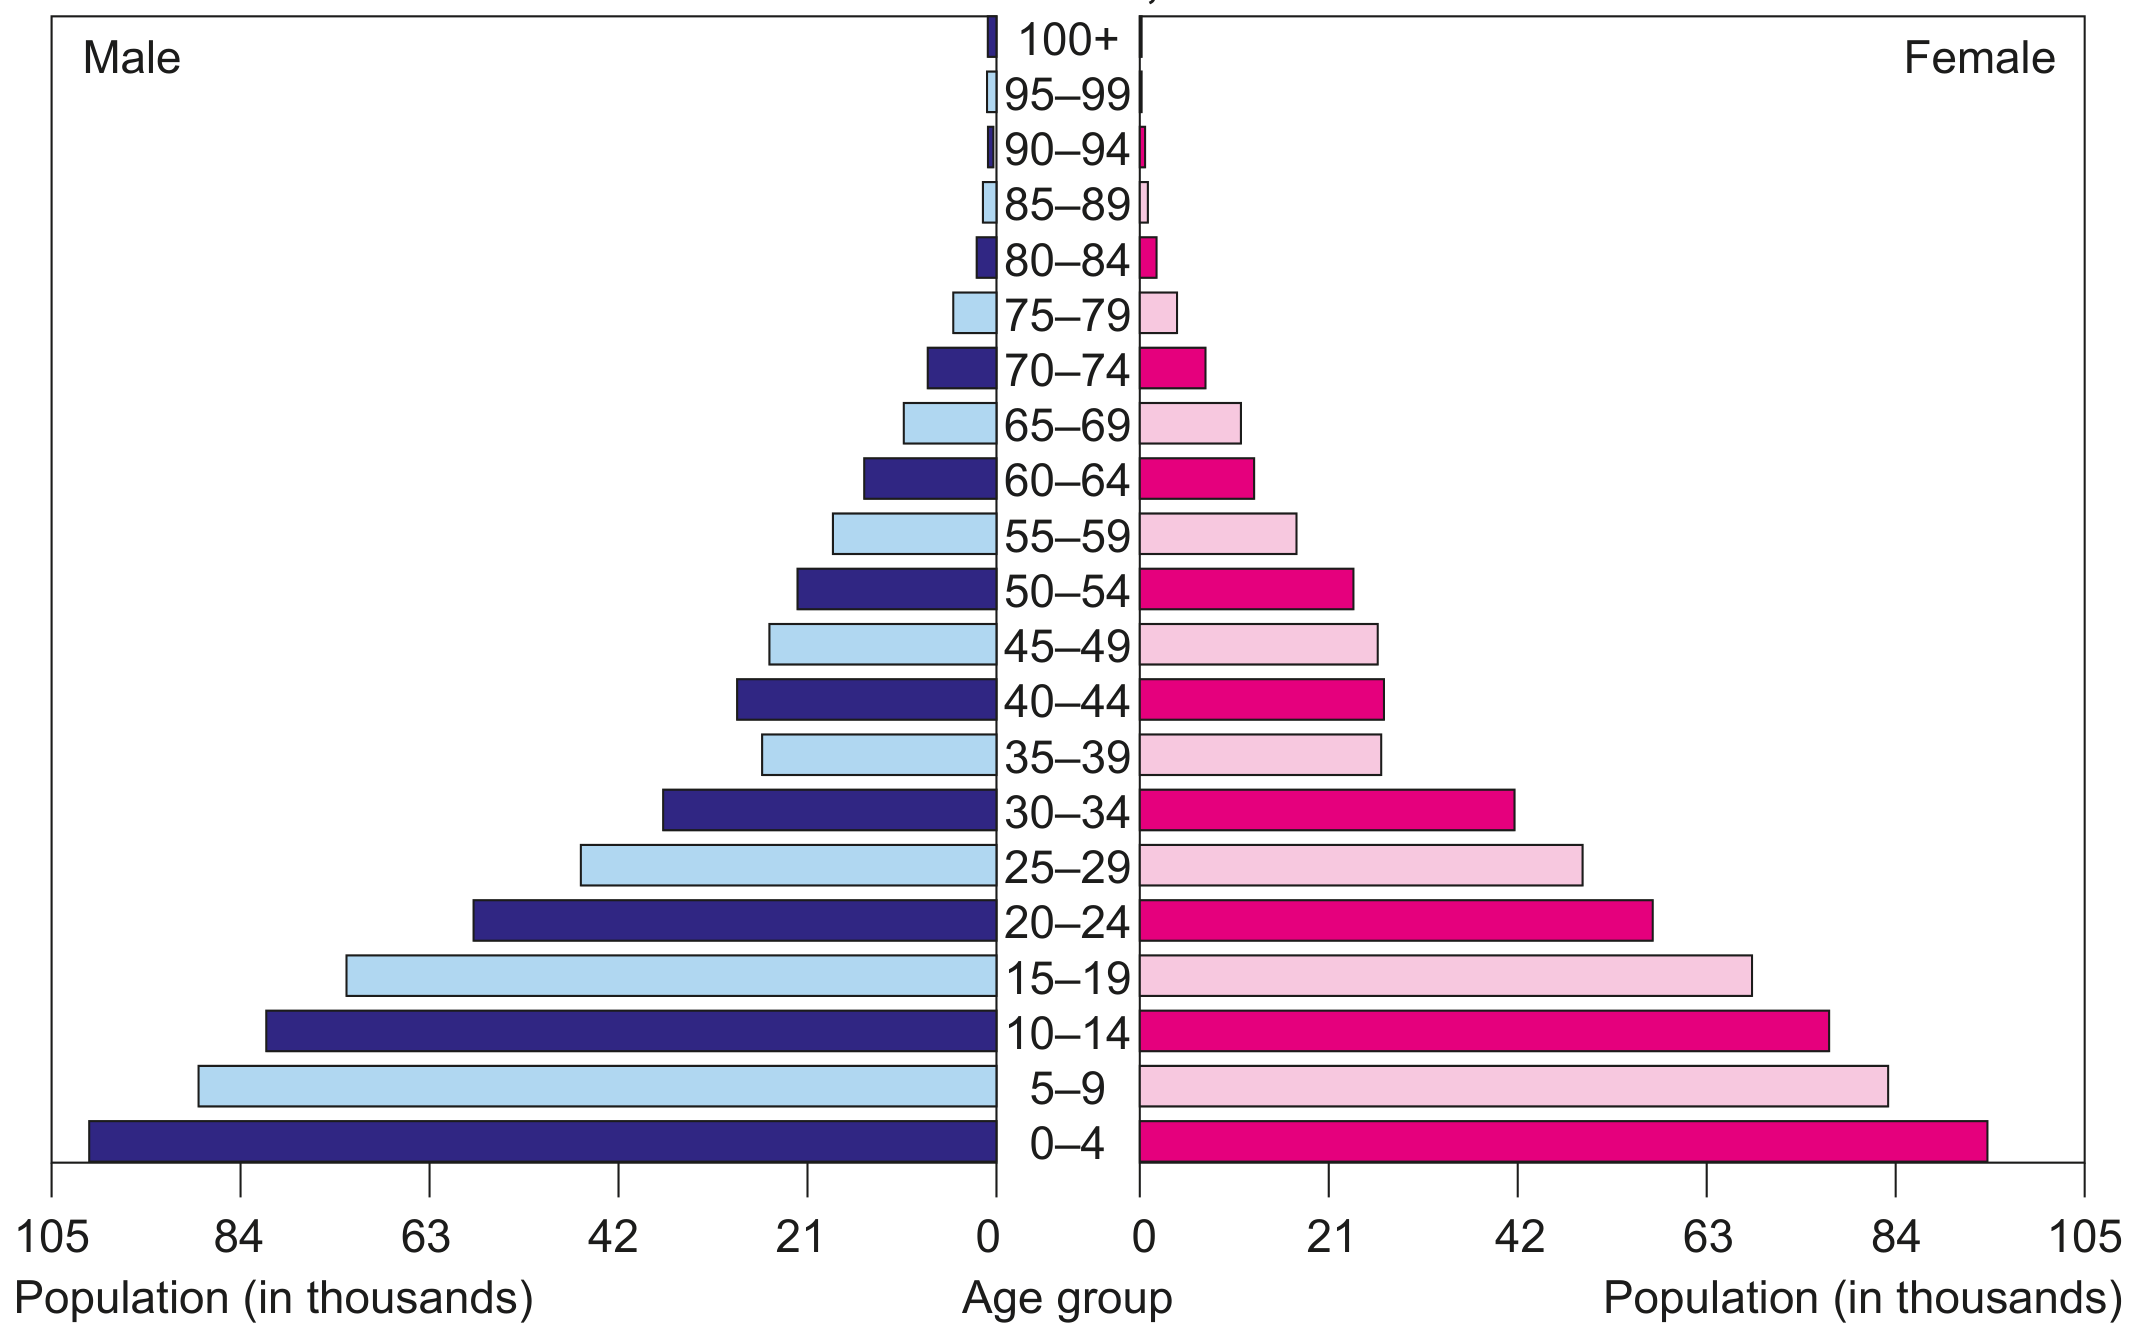
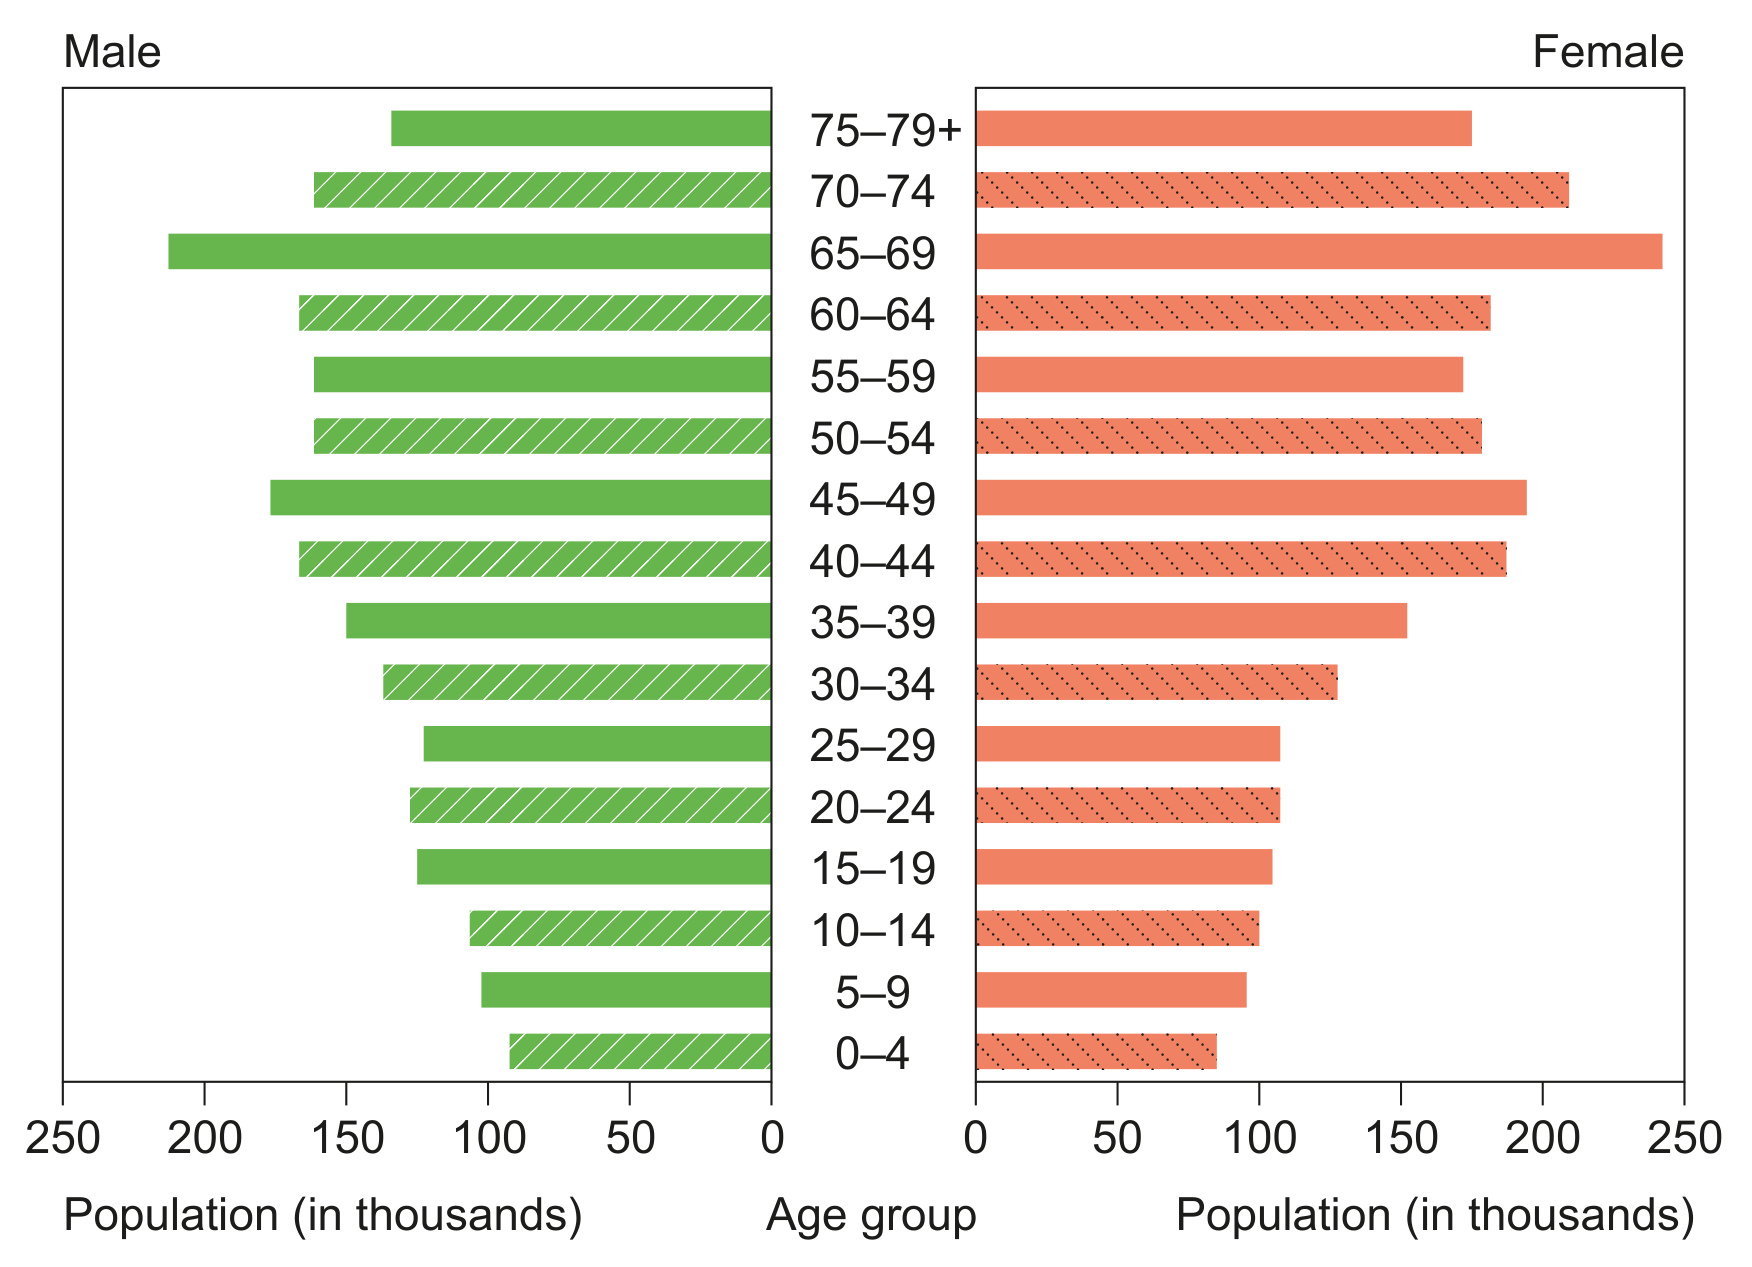
Figure 3(b): Age-gender pyramid for Timor-Leste, 2016

Figure 3(b): Age-gender pyramid for Timor-Leste, 2016

With reference to Figure 3(b), outline two reasons for differences between the age-gender pyramids for Indonesia and Timor-Leste.

Question 3

Question 3(a)(i)

(a)

Using Figure 3(a), identify the year in which the median prediction of the world population will reach 10 billion.

[ 1 ]

Question 3(a)(ii)

(b)

Outline one reason for the uncertainty in predicting the world's population in

Figure 3(a).

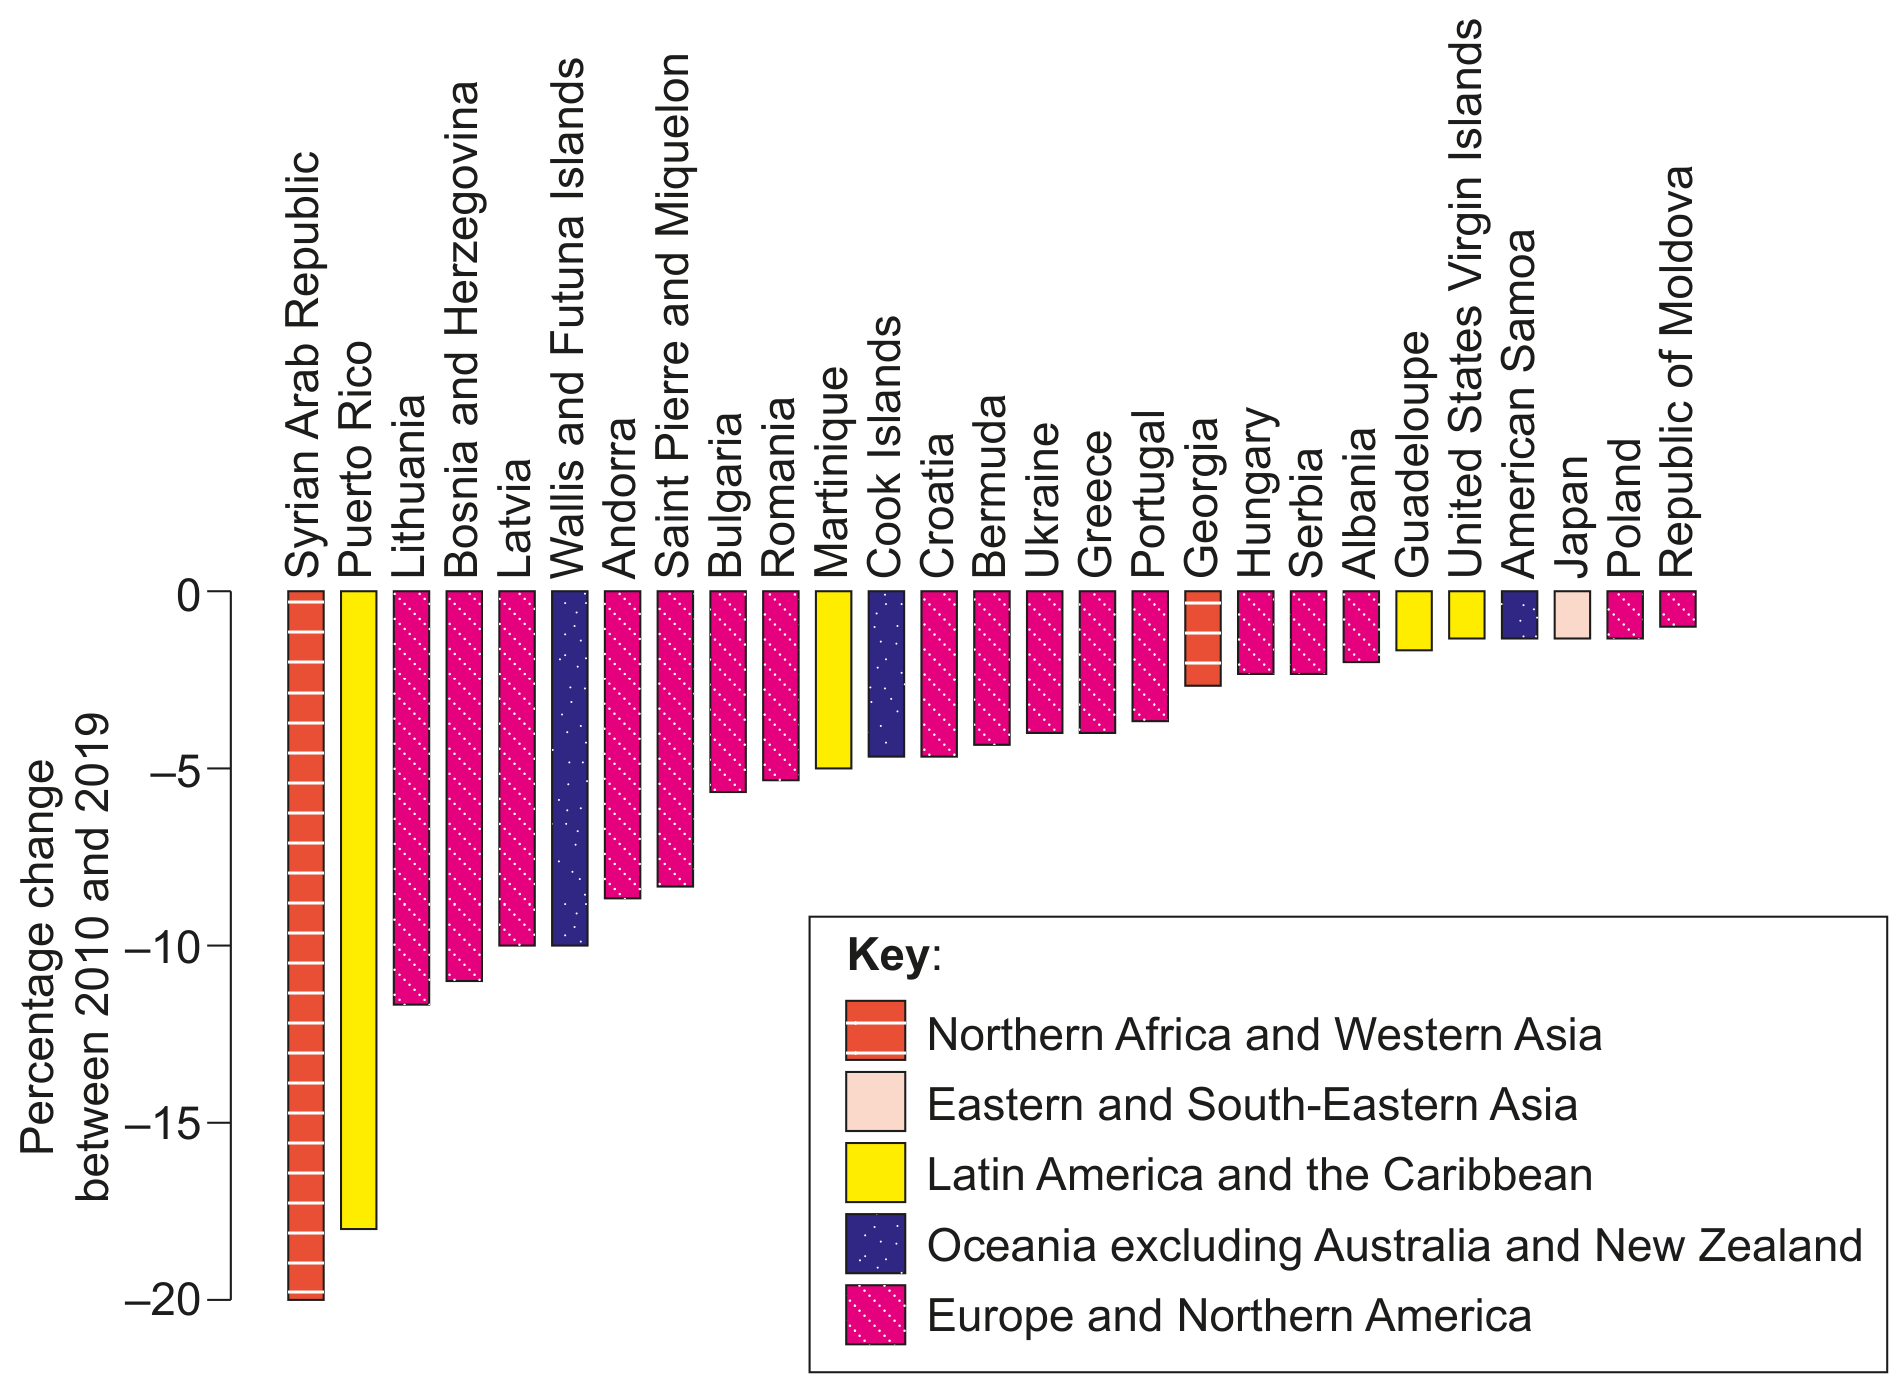
Figure 3(b): Countries and regions where population decreased by at least one per cent between 2010 and 2019

Figure 3(b): Countries and regions where population decreased by at least one per cent between 2010 and 2019

[ 1 ]

Question 3(b)(i)

(c)

Using Figure 3(b), identify the region that has the most countries with a decrease in the percentage change in population between 2010 and 2019.

[ 1 ]

Question 3(b)(ii)

(d)

Outline two factors that could contribute to a reduction in population in the countries in Figure 3(b).

[ 2 ]

Question 3(c)

(e)

Discuss how a country's stage in the demographic transition model (DTM) might influence its national population policy.

[ 4 ]

Question 5

[Maximum number: 4]

hurricane social effects
- After the hurricane, thousands of men and women left Dominica in search of work.
- 90% of housing was damaged and food crops were destroyed.

Question 5(a)

Question 5(b)

(b)
Figure 4(a): Population pyramid for Dominica, 2018

Figure 4(a): Population pyramid for Dominica, 2018

After the hurricane, thousands of men and women left Dominica in search of work. With reference to Figure 4(a), draw a post-hurricane age-gender pyramid for Dominica to illustrate this outward migration.

Birth rate15.1 per 1000
Death rate7.9 per 1000
Net migration rate-5.4 per 1000
Median age33.5 years
Urban population70.5%70.5 \%
Total fertility rate2.03 children per woman

Figure 4(b): Population statistics for Dominica, 2017

With reference to Figures 4(a) and 4(b), suggest how population change may impact resource use on Dominica in the future.

[ 2 ]

Question 4

Question 4(a)

(a)
RegionFertility rateBirth rateDeath rate
Japan1.407.3910.97
Hokkaido1.286.2112.22

Figure 8(a): Demographic data for Japan and Hokkaido, 2018

Using the data in Figure 8(a), calculate the natural increase rate for Hokkaido.

[ 1 ]

Question 4(b)

(b)
Figure 8(b): Age-gender pyramid for Hokkaido, 2018

Figure 8(b): Age-gender pyramid for Hokkaido, 2018

Using Figure 8(b), state Hokkaido's location on the demographic transition model.

[ 1 ]

Question 4(c)

(c)

Describe three socio-economic factors which may have led to Hokkaido's low fertility rate.

[ 3 ]

Question 6(a)

[Maximum number: 4]

Outline two factors that enable a human population to increase its local carrying capacity.

0 selected