IB ESS 7.3 Solid Waste Topic Practice

EduNinja

Question 1

[Maximum number: 7]
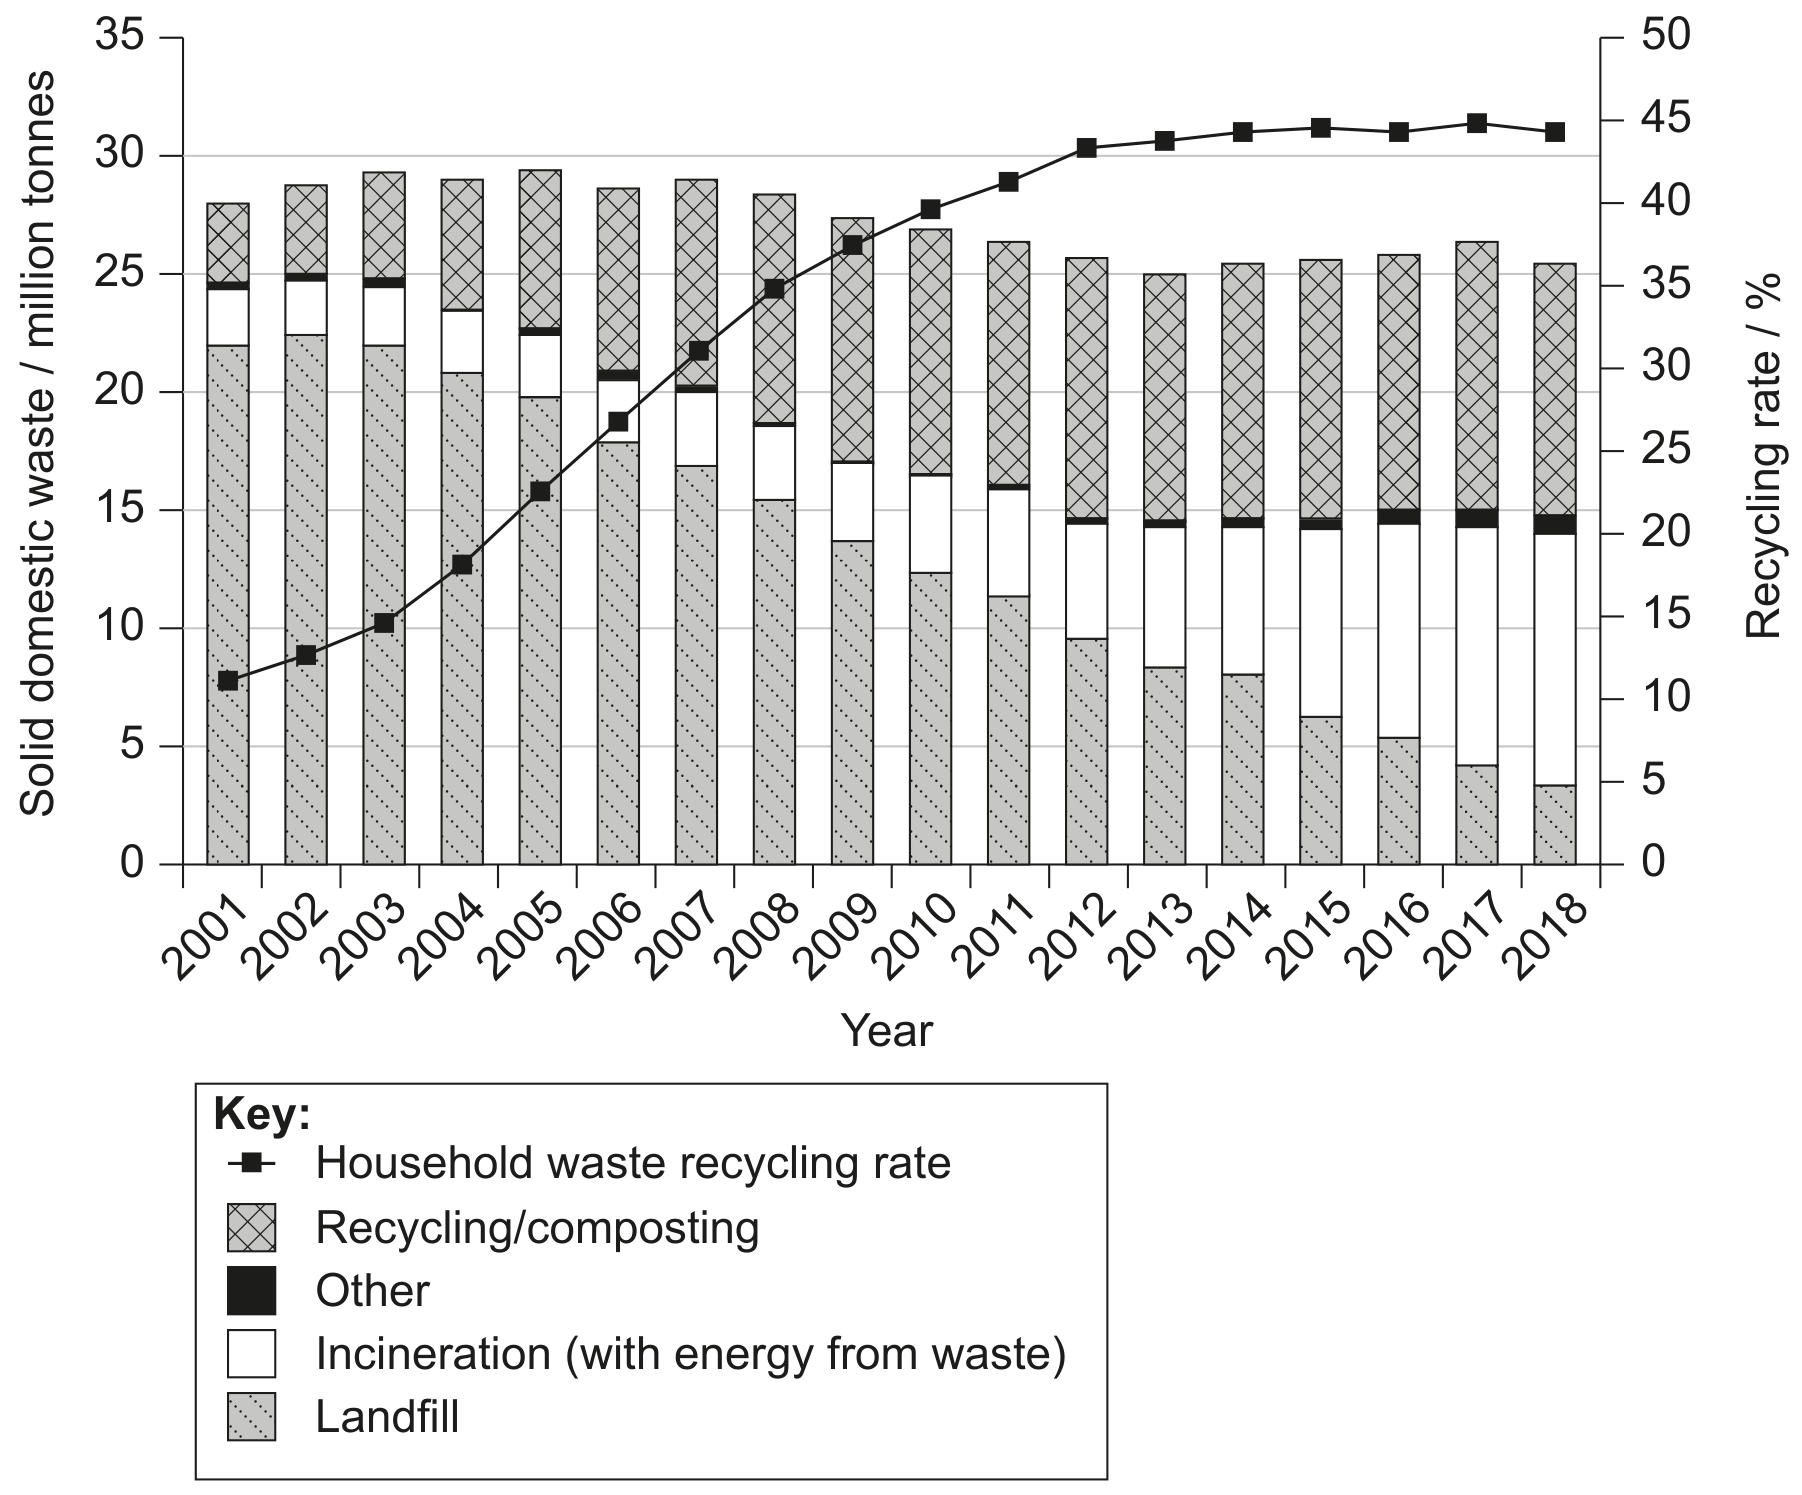
Figure 1: Management of solid domestic waste in England, 2001-2018

Figure 1: Management of solid domestic waste in England, 2001-2018

Question 1(a)

(a)

With reference to Figure 1, identify the recycling rate in England in 2018.

[ 1 ]

Question 1(b)

(b)

Outline one reason for the shape of the recycling rate curve from 2013 to 2018.

[ 1 ]

Question 1(c)

(c)

Estimate the reduction in solid domestic waste (in million tonnes) going to landfill from 2001 to 2018.

[ 1 ]

Question 1(d)

(d)

Describe three reasons why the proportion of solid domestic waste being recycled/ composted and incinerated has changed.

[ 3 ]

Question 1(e)

(e)

Outline one reason why there has been an overall change in recorded total solid domestic waste between 2001 and 2018.

[ 1 ]
Question 2

[Maximum number: 7]
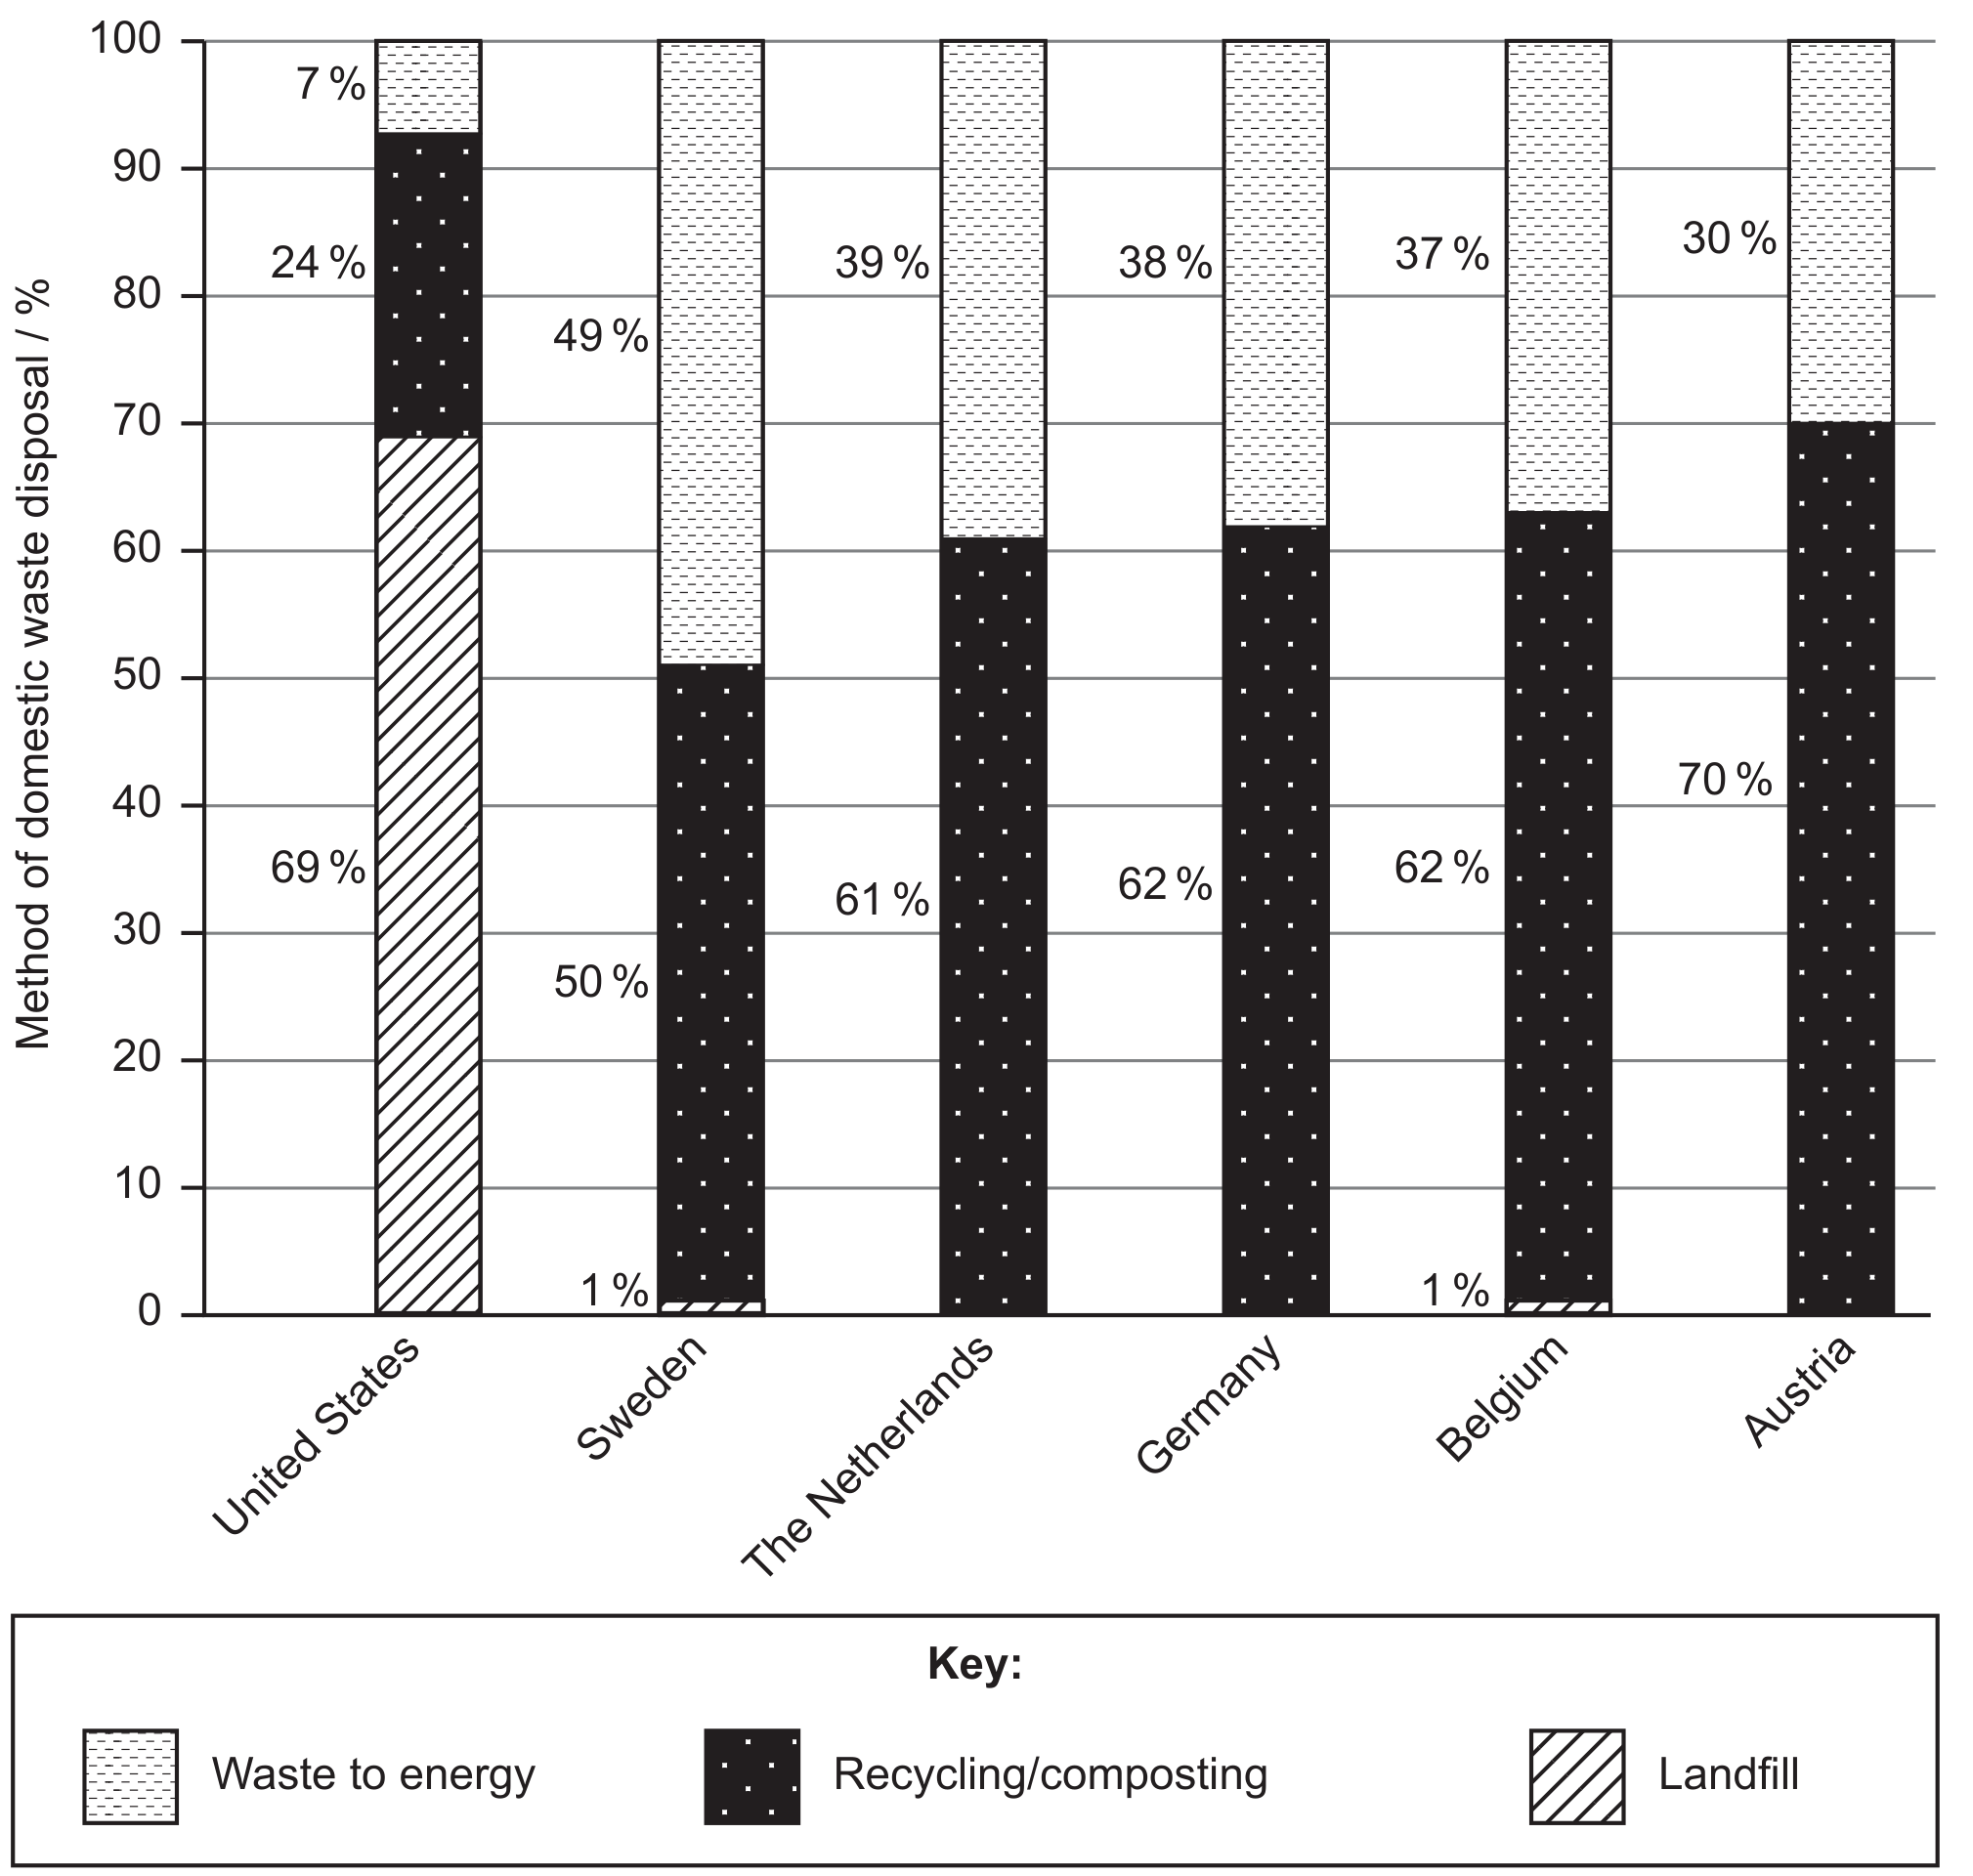
Figure 2: Methods of domestic waste disposal for selected countries

Figure 2: Methods of domestic waste disposal for selected countries

Question 2(a)

(a)

With reference to Figure 2, state the country that has the highest level of recycling/composting.

[ 1 ]

Question 2(b)

(b)

Outline two possible reasons for greater use of landfills in the United States compared with the European countries shown in Figure 2.

[ 2 ]

Question 2(c)

(c)

Outline two strategies for reducing the environmental impact of landfill sites.

[ 2 ]

Question 2(d)

(d)

Identify two problems associated with one of the waste disposal choices of Germany.

[ 2 ]

Question 5

Question 5(a)

(a)
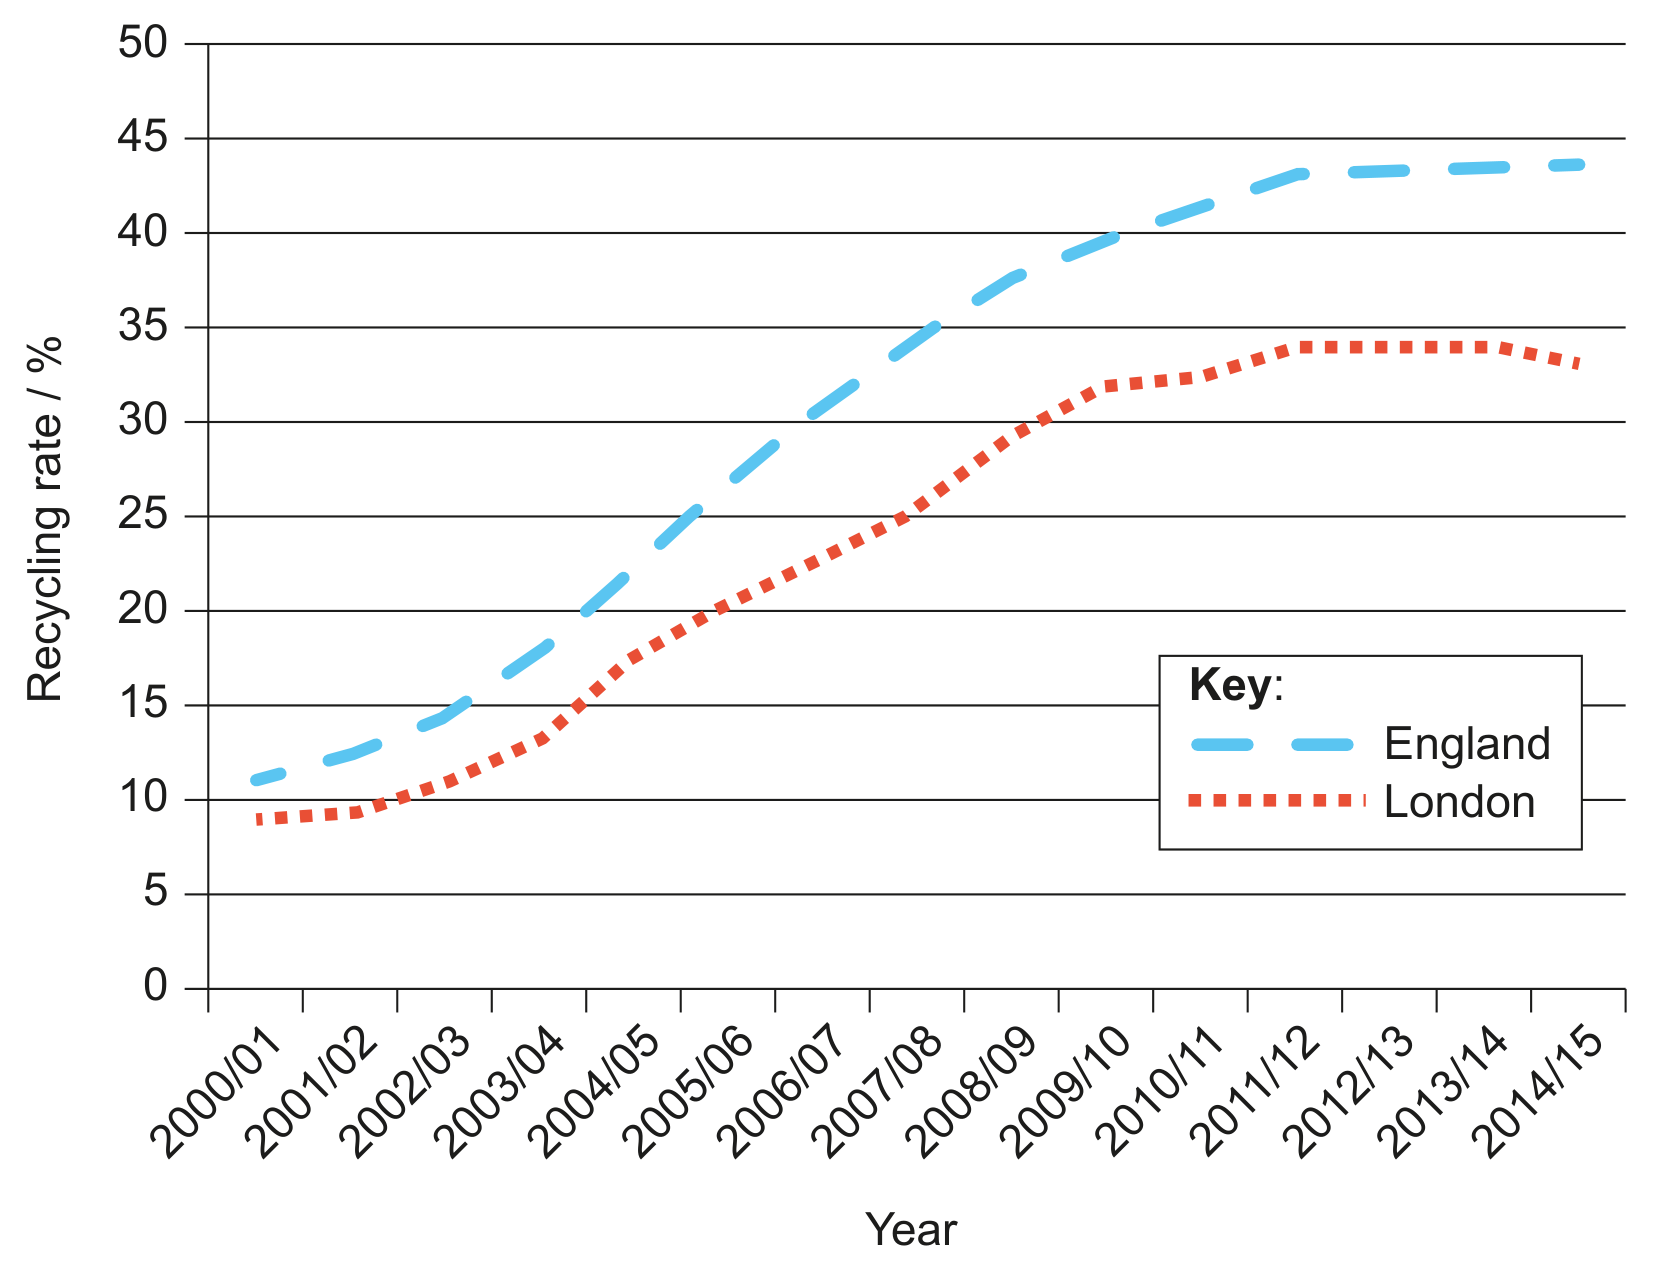
Figure 10(a): Recycling rates in London and England, 2000-2015

Figure 10(a): Recycling rates in London and England, 2000-2015

MaterialProportion recycled / \%
Plastic10
Paper57
Aluminium cans33
Steel cans45
Glass51

Figure 10(b): Proportions of material recycled in London, 2006

With reference to Figures 10(a) and 10(b), suggest one reason why London's recycling rates are lower than in the rest of England.

[ 1 ]

Question 5(b)

(b)

recycling in London
- London recycling rates are lower than England overall.
- Recycling can reduce landfill demand and resource extraction but depends on participation and infrastructure.

Evaluate the effectiveness of recycling as a waste management strategy for London.

[ 3 ]

Question 9

[Maximum number: 2]

In 2018, 9.29 million tonnes of household waste were collected; about 40% went to landfill and 46% to incineration.
Beijing is building incinerators aiming for no waste going to landfill by 2035; waste-to-energy incinerators generate electricity.
In 2020 regulations included compulsory sorting of household waste, ending free supermarket plastic bags, and reducing waste at source.

Explain why Beijing may want to stop the use of landfill for the disposal of solid domestic waste.

Question 6(b)

[Maximum number: 7]

Using examples, evaluate two solid domestic waste disposal strategies as methods to mitigate climate change.

Question 6(b)

[Maximum number: 7]

Solid domestic waste may contain non-biodegradable material and toxins that have the potential to reduce the fertility of soils.

Explain how strategies for the management of this waste may help to preserve soil fertility.

Question 7(c)

[Maximum number: 9]

To what extent do different strategies for the management of solid domestic waste (SDW) influence the sustainability of human populations?

0 selected