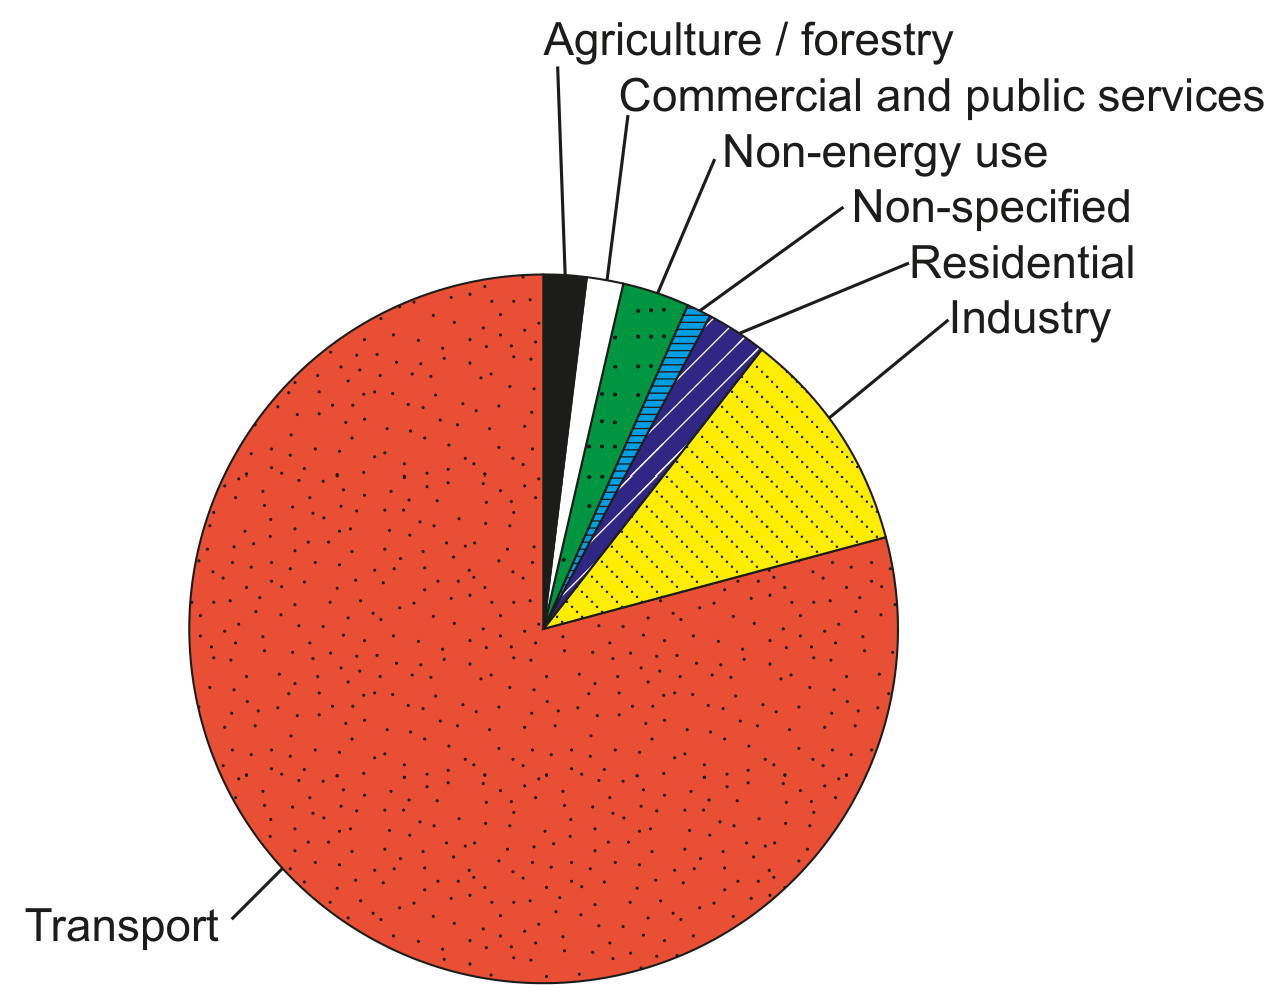
IB ESS 7.2 Energy Sources Uses and Management Topic Practice

EduNinja

Question 1

Question 1(a)(i)

(a)

In the table below, state two advantages and two disadvantages of using oil from fossil fuels as an energy source.
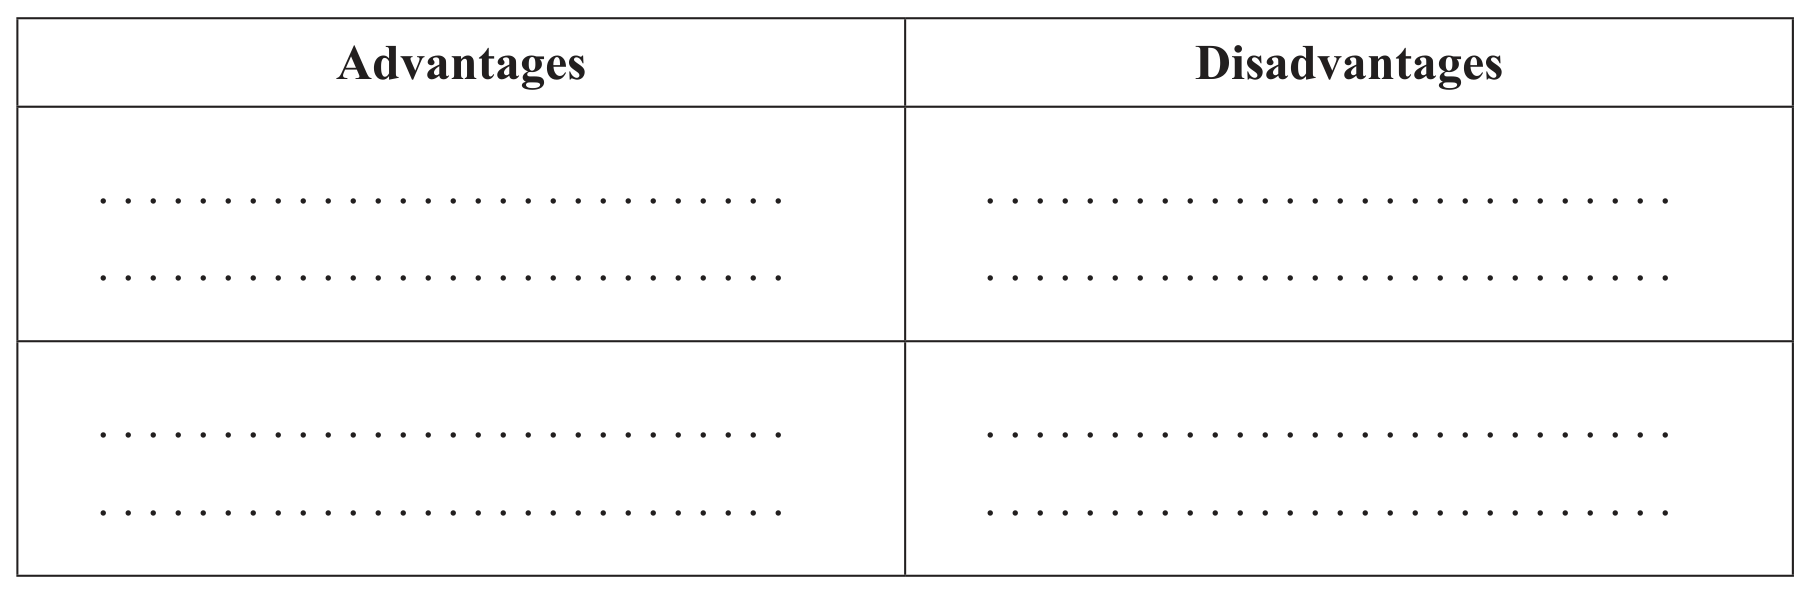
Table for advantages and disadvantages of using oil from fossil fuels as an energy source

Table for advantages and disadvantages of using oil from fossil fuels as an energy source

Opponents say tar sands produce three times more greenhouse gas emissions than conventional fossil fuels; fossil fuels are burned to heat extraction water; underground carbon stores become available; oil produced is burned; boreal forest is cut down; wildlife is displaced or dies; only 10% of water taken from the Athabasca River is returned; toxic waste ponds may leak into river and groundwater; indigenous people may be displaced and face health impacts. Supporters say tar sands improve energy security for Canada and the USA; Canada supplied much crude oil to the USA; Keystone XL may create jobs; companies reinvest in carbon capture and storage; 7.5 million trees have been replanted.

[ 2 ]

Question 1(a)(ii)

(b)

Using Figure 8, estimate the percentage of world oil equivalent consumption that came from renewable sources in 2011.
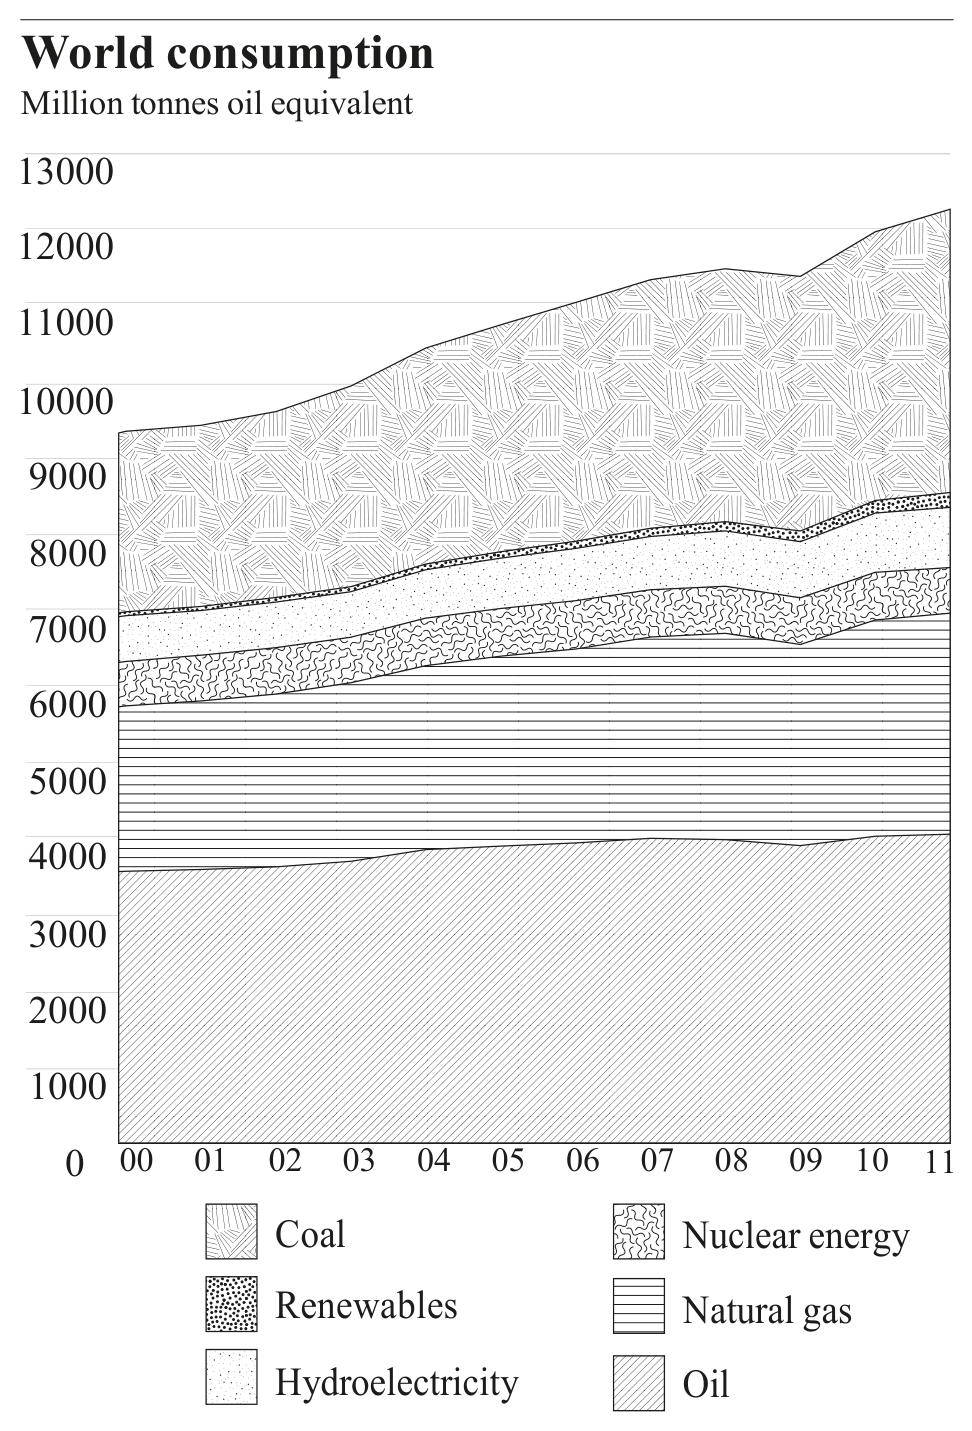
Figure 8: World consumption of oil equivalent by fuel type, 2000-2011

Figure 8: World consumption of oil equivalent by fuel type, 2000-2011

[ 1 ]

Question 1(a)(iv)

(c)

Suggest three different strategies that may be used to manage global energy consumption.
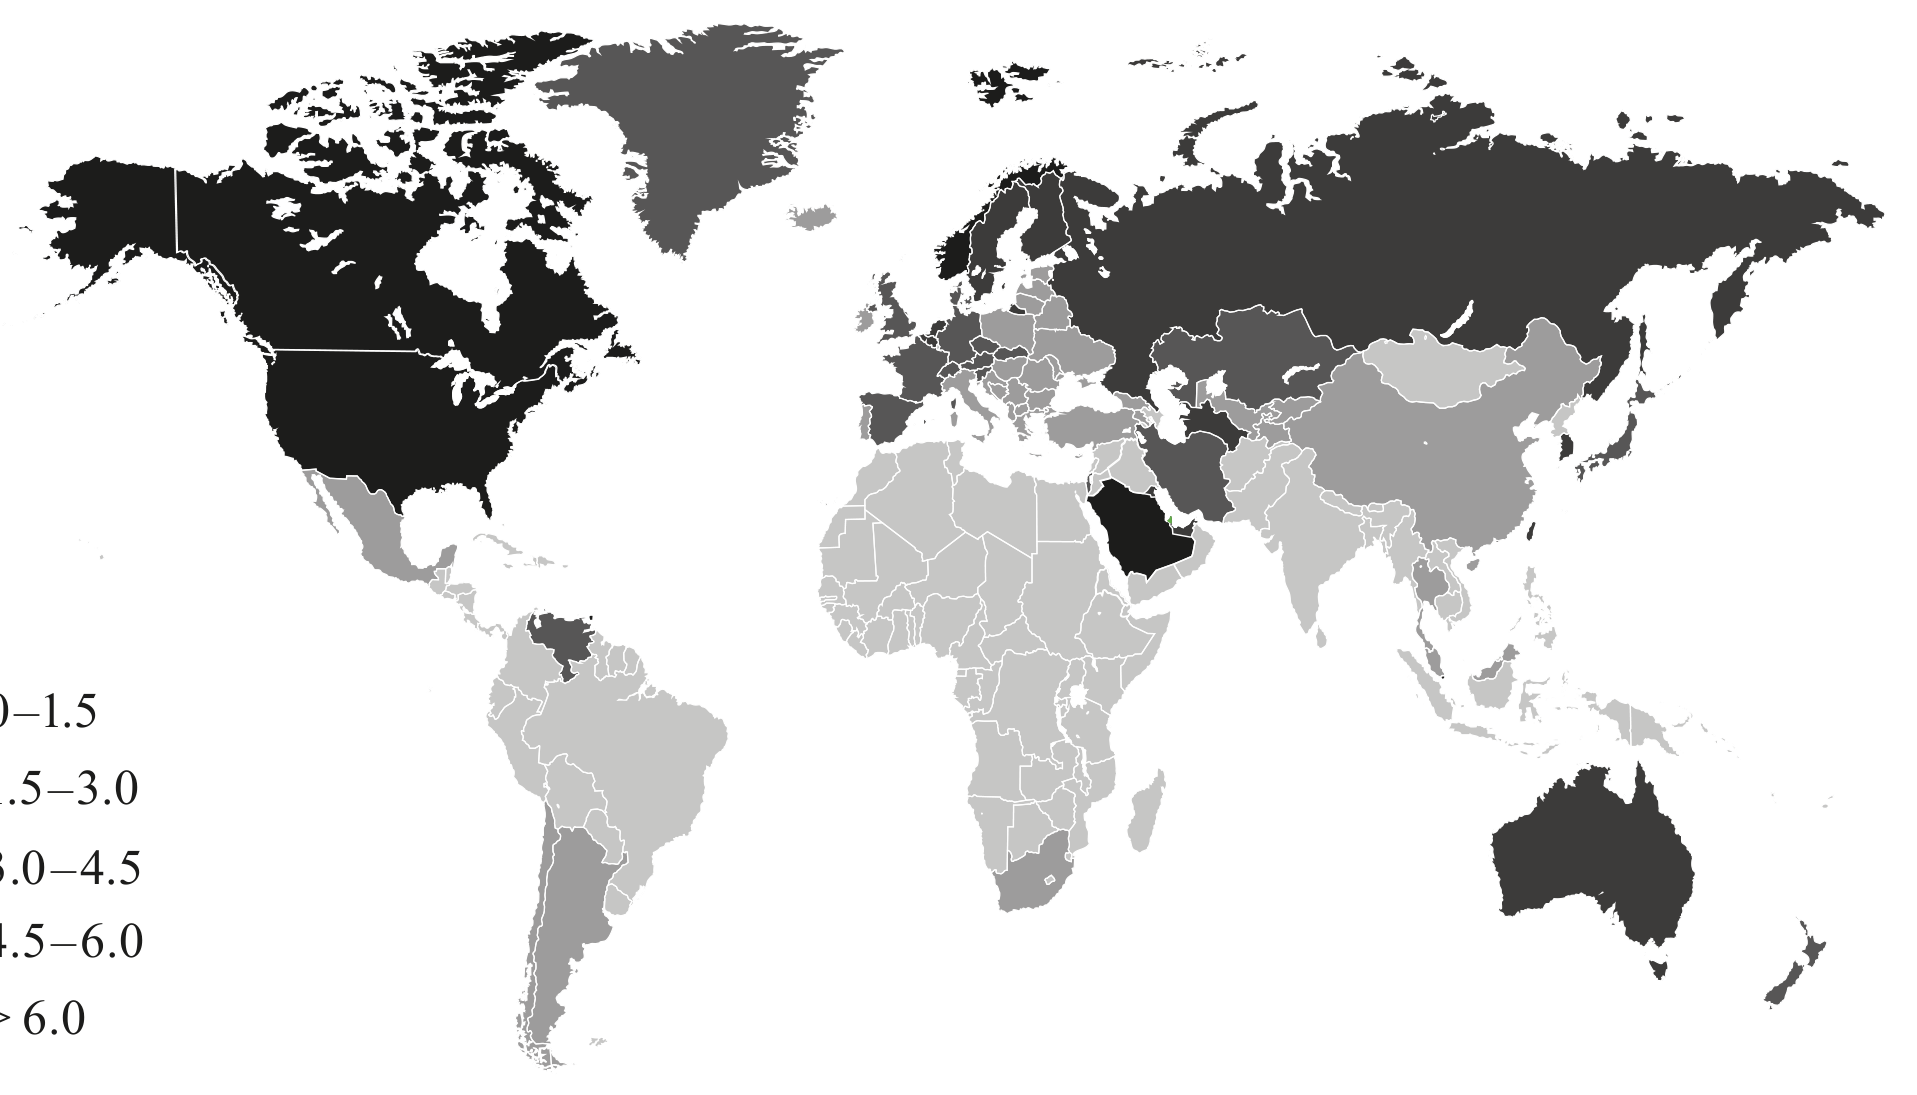
Figure 7: Oil equivalent consumption per capita in 2011

Figure 7: Oil equivalent consumption per capita in 2011

Figure 8: World consumption of oil equivalent by fuel type, 2000-2011

Figure 8: World consumption of oil equivalent by fuel type, 2000-2011

[ 3 ]

Question 1(c)(ii)

(d)

Using Figure 7, suggest one reason why per capita oil equivalent consumption is greater in some regions than in others.

Figure 7: Oil equivalent consumption per capita in 2011
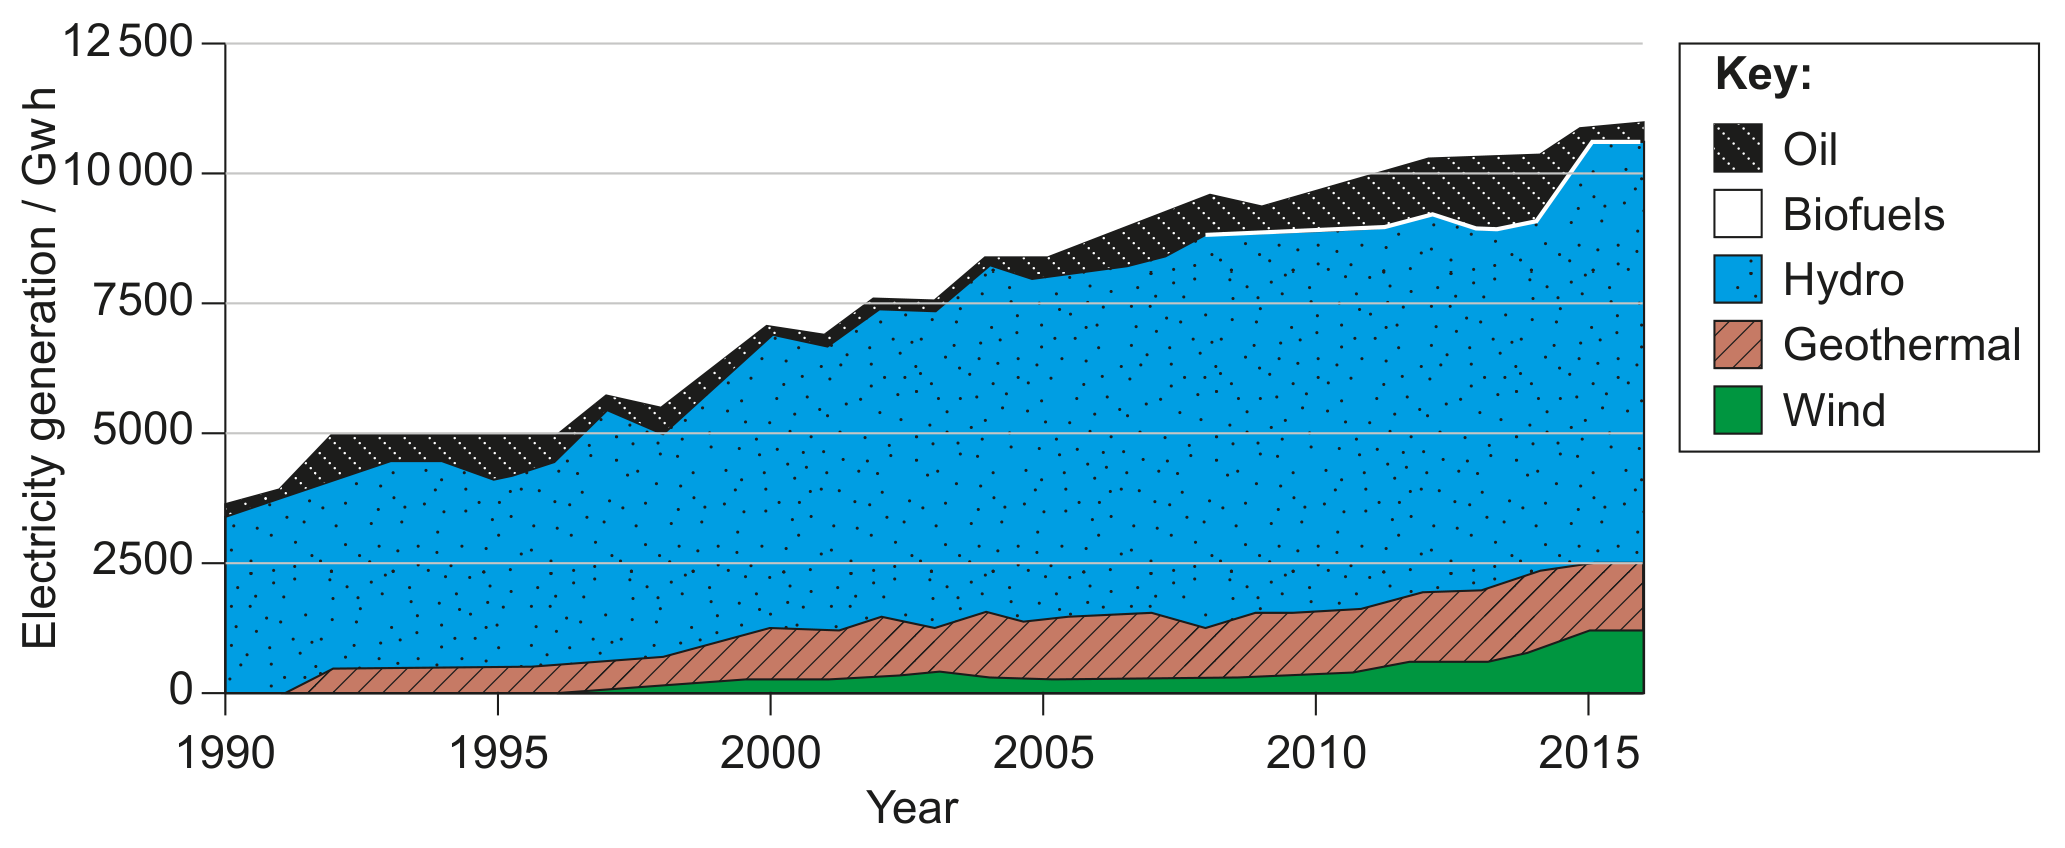
Figure 7: Oil equivalent consumption per capita in 2011
[ 1 ]

Question 2

Question 2(a)

(a)
YearRecorded electricity consumption (kWh bn)
2019117.020
2018114.351
2017107.002
2016101.998
201594.982
201492.884
201390.655
201290.954
201184.893
201082.794
200976.016
200871.195

Figure 5: Recorded electricity consumption for Beijing, 2008-2019

With reference to the data in Figure 5, calculate the average annual increase in energy demand between 2008 and 2019 in billion kWh.

[ 2 ]

Question 2(b)

(b)

Figure 6(a): Beijing Clean Air Action Plan
Figure 6(a): In 2018, the Beijing Clean Air Action Plan included limiting car ownership with quotas of 100000 new car purchases per year.
Coal consumption was reduced from 30 million tonnes in 2005 to 4 million tonnes.
The plan created forested areas and green spaces including 5 urban forests, 21 green spaces, 10 leisure parks and 100 km of greenways.
Beijing has the potential to reach net zero carbon emissions by 2050.

Describe one way in which the change in coal consumption between 2005 and 2018 referred to in Figure 6(a) was achieved.

[ 1 ]

Question 3(b)

[Maximum number: 6]

Explain the factors which influence the choice of energy sources in two different societies.

Question 8

Question 8(a)

(a)
Figure 9(a): Electricity generation in Costa Rica by energy source (1990-2016)

Figure 9(a): Electricity generation in Costa Rica by energy source (1990-2016)

Identify one possible reason why there has been a change in the quantity of electricity generated from wind as shown in Figure 9(a).

[ 1 ]

Question 8(b)

(b)
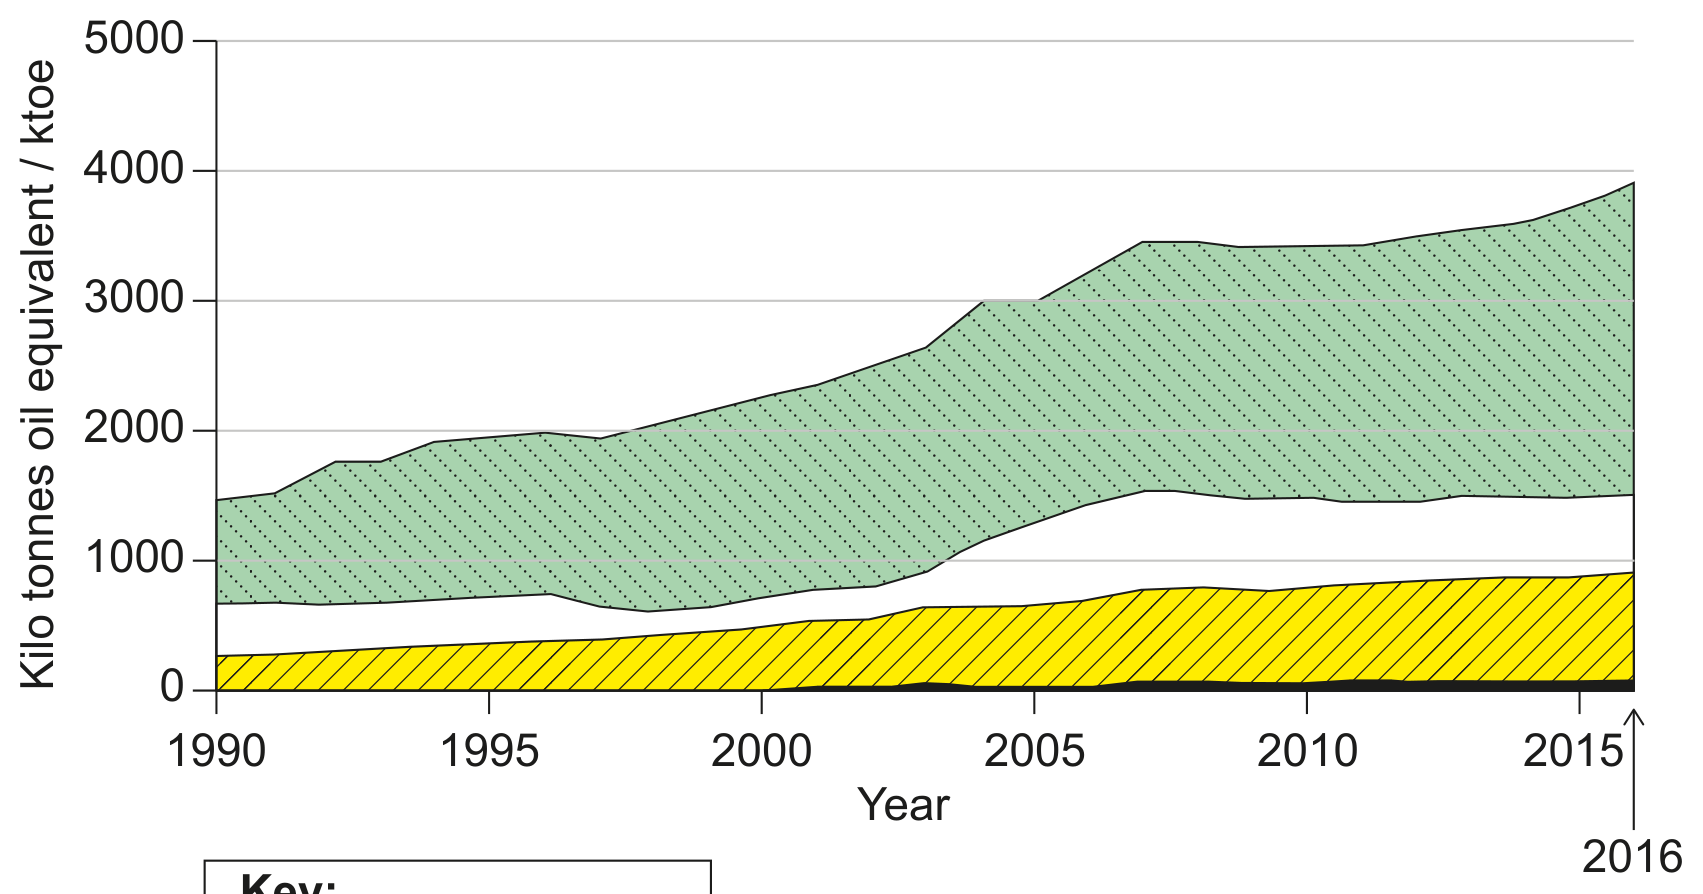
Figure 9(b): Total energy consumption in Costa Rica (including electricity) between 1990 and 2016

Figure 9(b): Total energy consumption in Costa Rica (including electricity) between 1990 and 2016

With reference to Figure 9(b), calculate the percentage of energy consumed that came from fossil fuels in 2016.

[ 2 ]

Question 8(c)

(c)
Figure 9(c): Consumption of crude oil in Costa Rica by sector (2016)

Figure 9(c): Consumption of crude oil in Costa Rica by sector (2016)

Figure 10(a): Fact file on carbon neutrality
- Costa Rica pledged to become carbon neutral by balancing carbon dioxide output with carbon dioxide input.
- Since the mid-1980s, national methane emissions have decreased and a twenty-year ban was placed on oil exploration in 2002.
- Government encourages public transport, lower-emission vehicles, electric/biofuel/hybrid/hydrogen vehicles, renewable electricity and carbon offset schemes.
- The world's first certified carbon-neutral coffee producer was established in Costa Rica.

With reference to Figure 9(c), suggest two strategies that would be most effective in reducing the use of crude oil in Costa Rica.

[ 2 ]

Question 7(c)

[Maximum number: 9]

The future growth of human populations is unlikely to be limited by the availability of energy resources. However, they could easily be limited by the impacts of energy production.

Discuss the validity of this statement.

Question 7(c)

[Maximum number: 9]

Increasing concern for energy security is likely to lead to more sustainable energy choices.

Discuss the validity of this statement, with reference to named countries.

Question 7(c)

[Maximum number: 9]

Examine the driving factors behind the changing energy choices of different countries using named examples.

0 selected