Question 2
[Maximum number: 6]
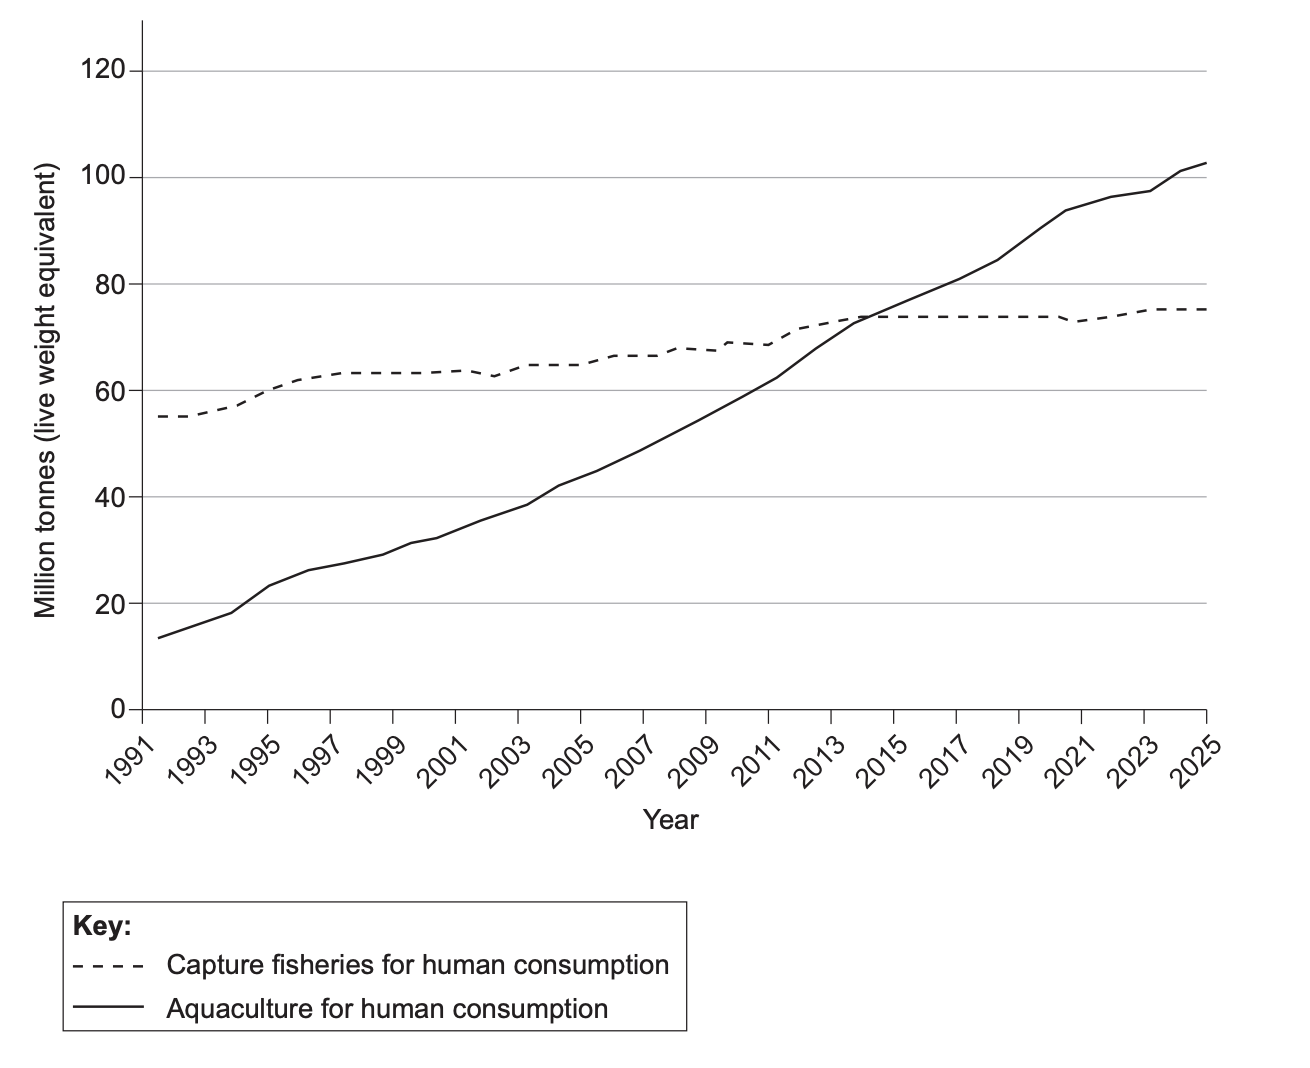
Figure 2: Global capture fisheries and aquaculture production from 1991 and projected to 2025
Question 2(a)
(a)
Using Figure 2, identify one reason for the trend shown in the curve for:
[ 2 ]
Question 2(a)(i)
(i)
aquaculture.
[ 1 ]
Question 2(a)(ii)
(ii)
capture fisheries.
[ 1 ]
Question 2(b)
(b)
Outline two negative environmental impacts of aquaculture.
[ 2 ]
Question 2(c)
(c)
Describe two strategies for the management of sustainable capture fisheries.
[ 2 ]