IB ESS 4.2 Water Access Use and Security Topic Practice

EduNinja

Question 1

[Maximum number: 6]

Figures 1(a) and 1(b) show the availability of renewable freshwater per capita in 2013 and its predicted availability in 2040.
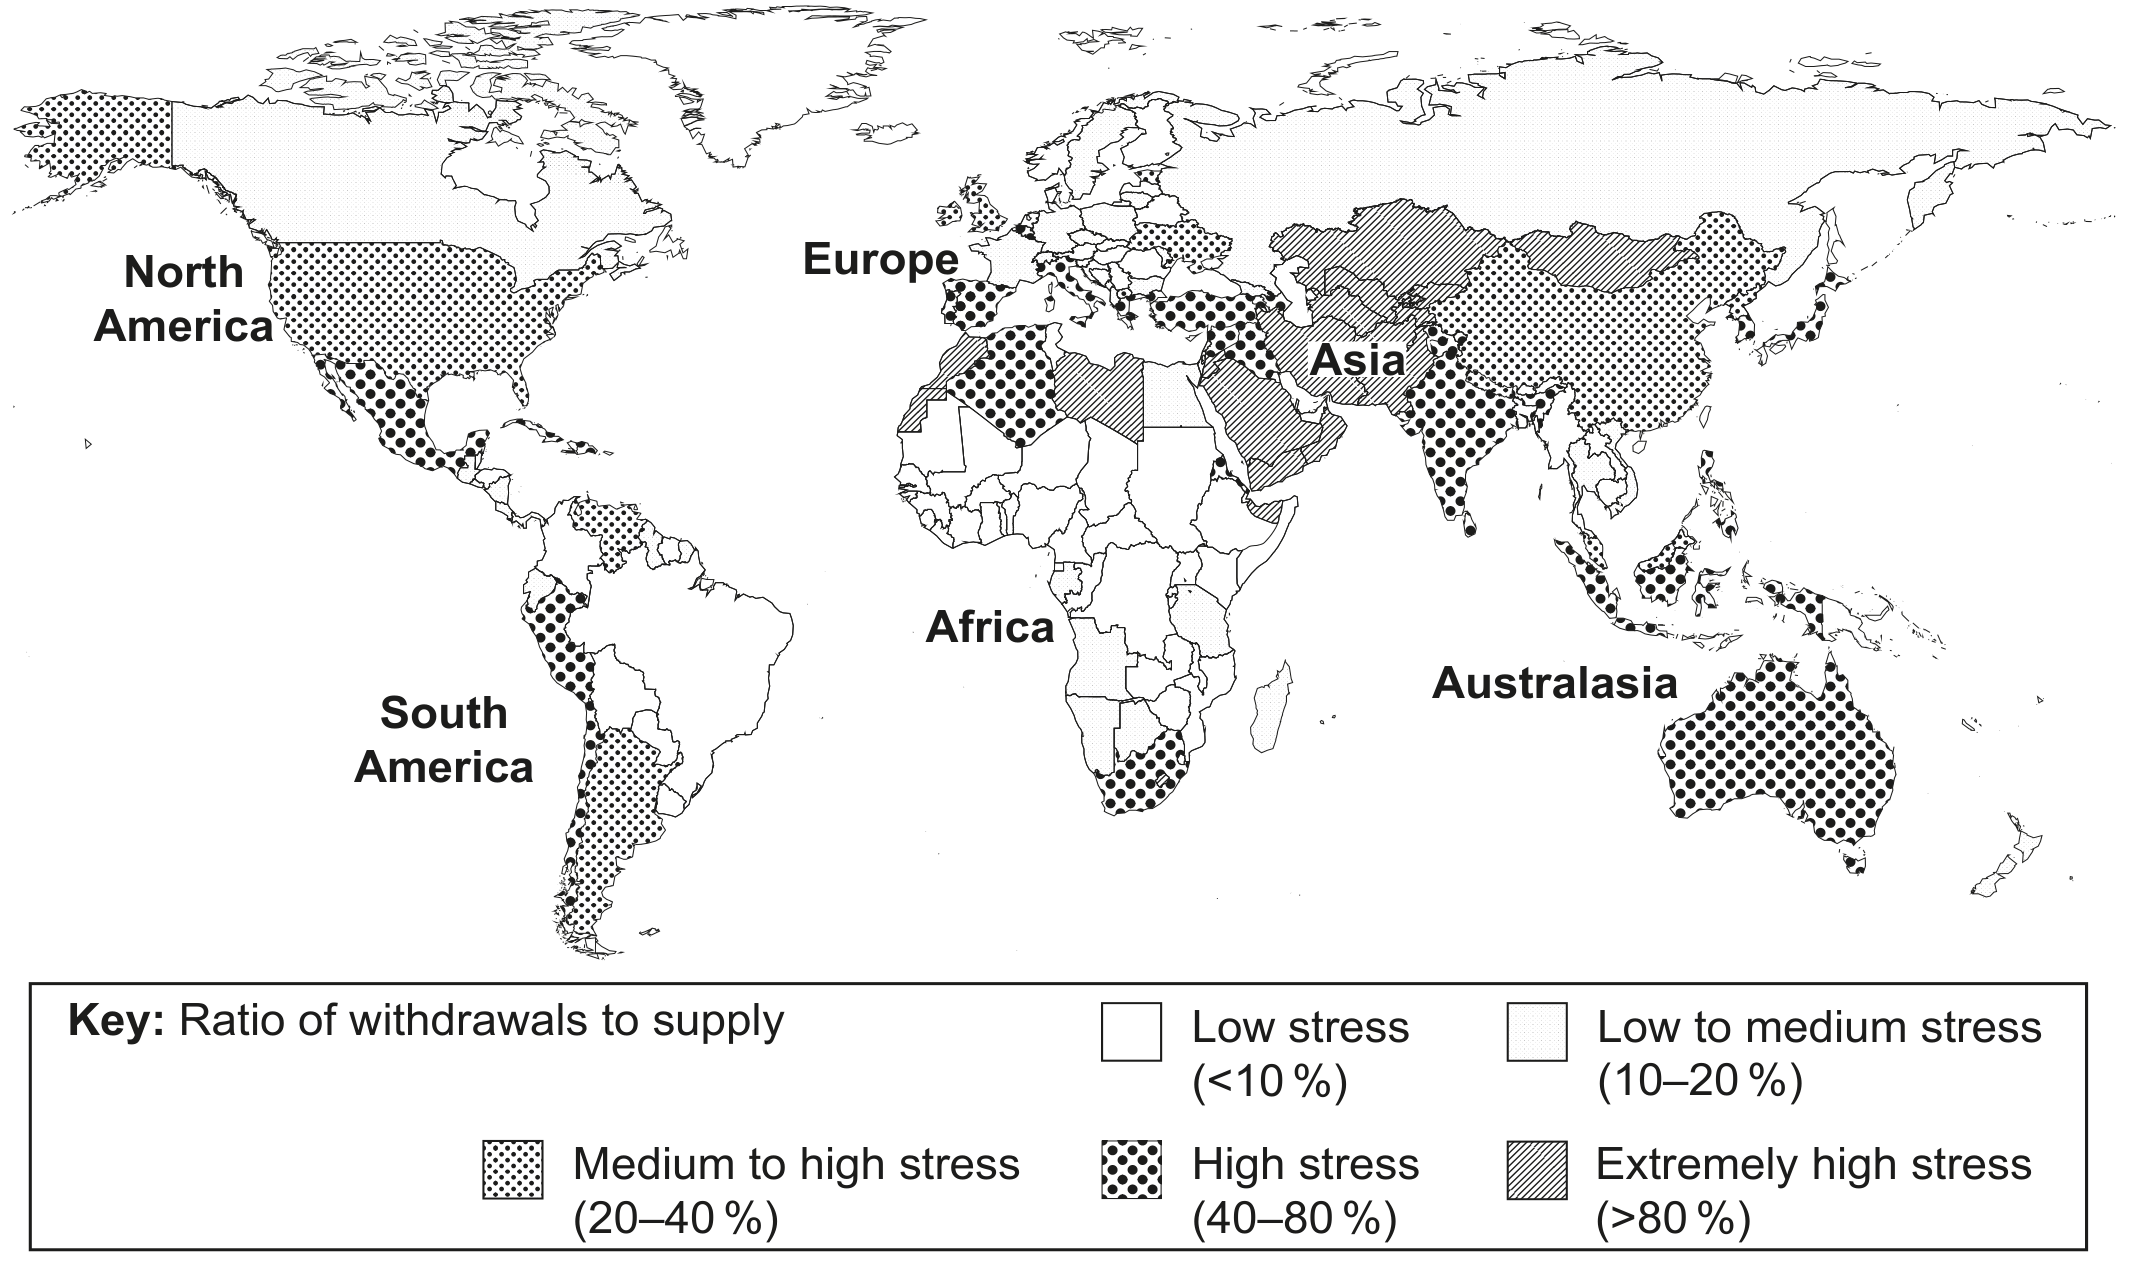
Figure 1(a): Water stress by country in 2013
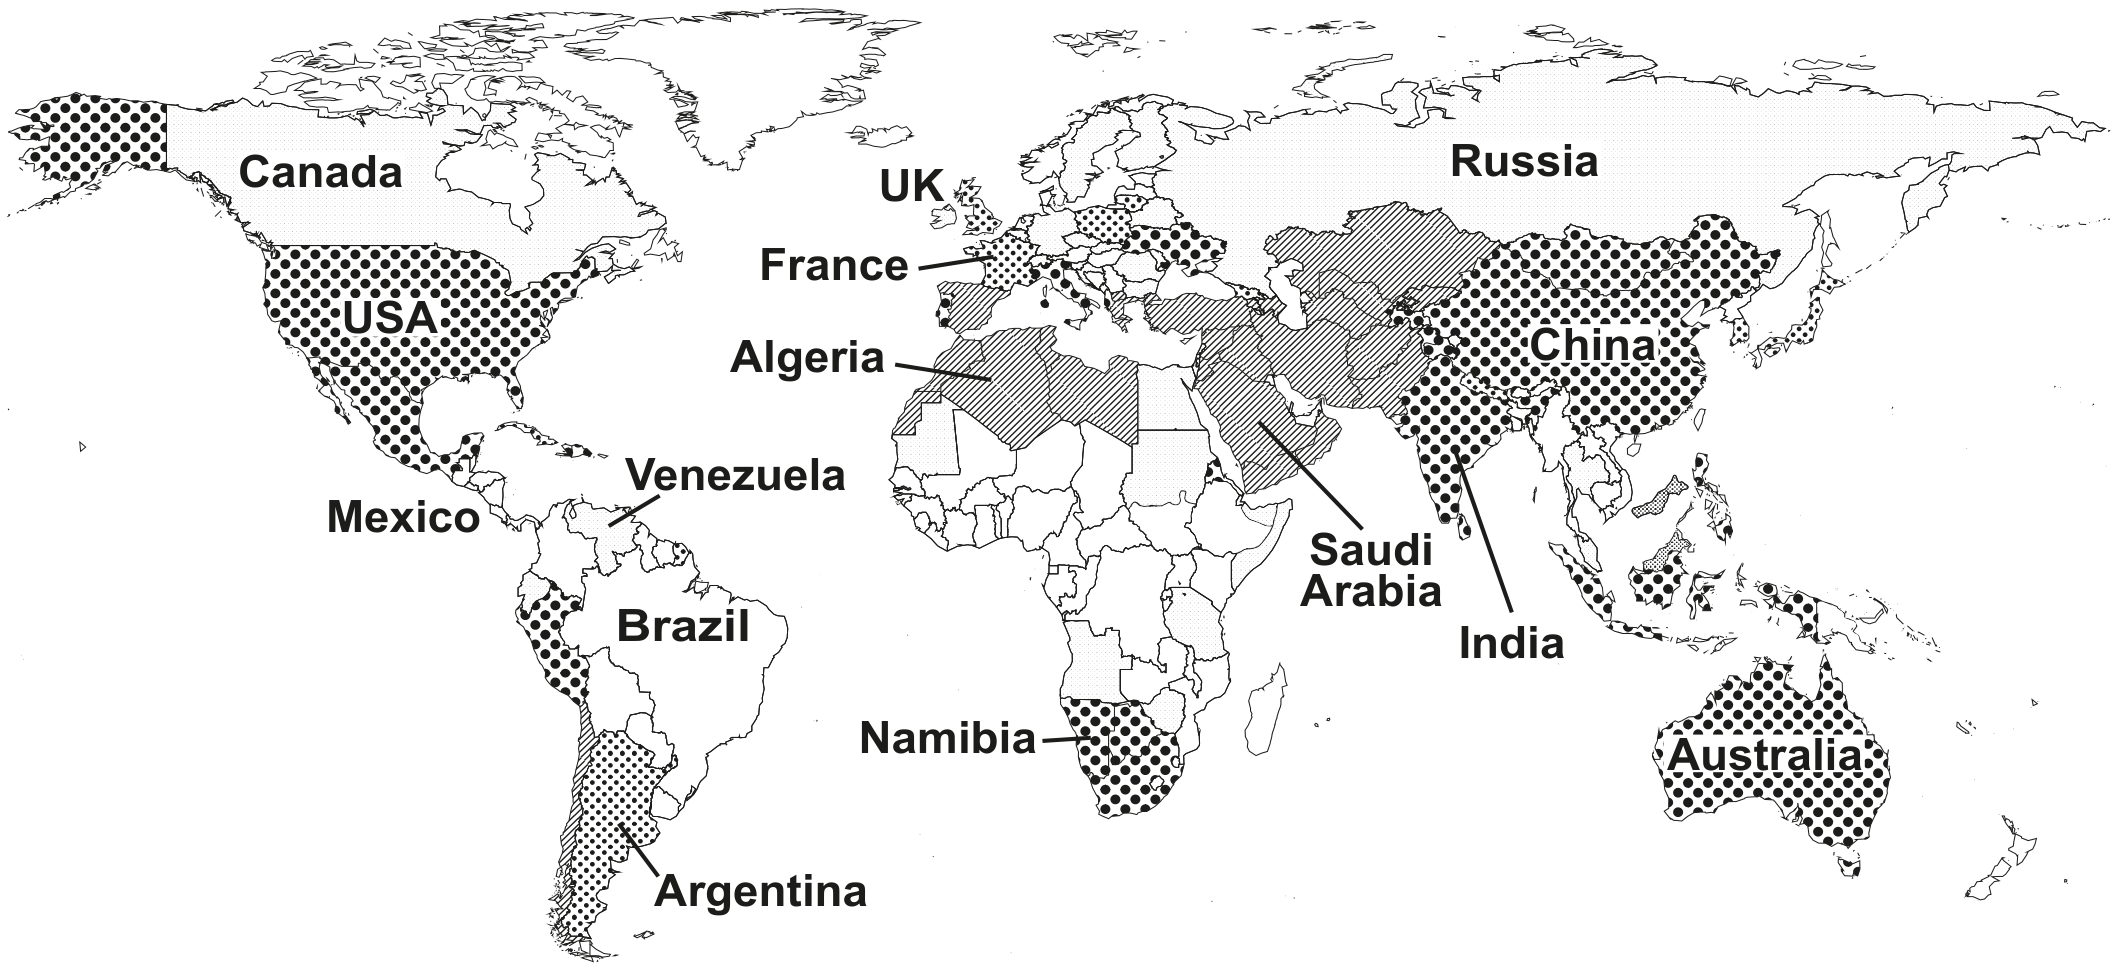
Figure 1(a): Water stress by country in 2013

Figure 1(b): Predicted water stress by country in 2040
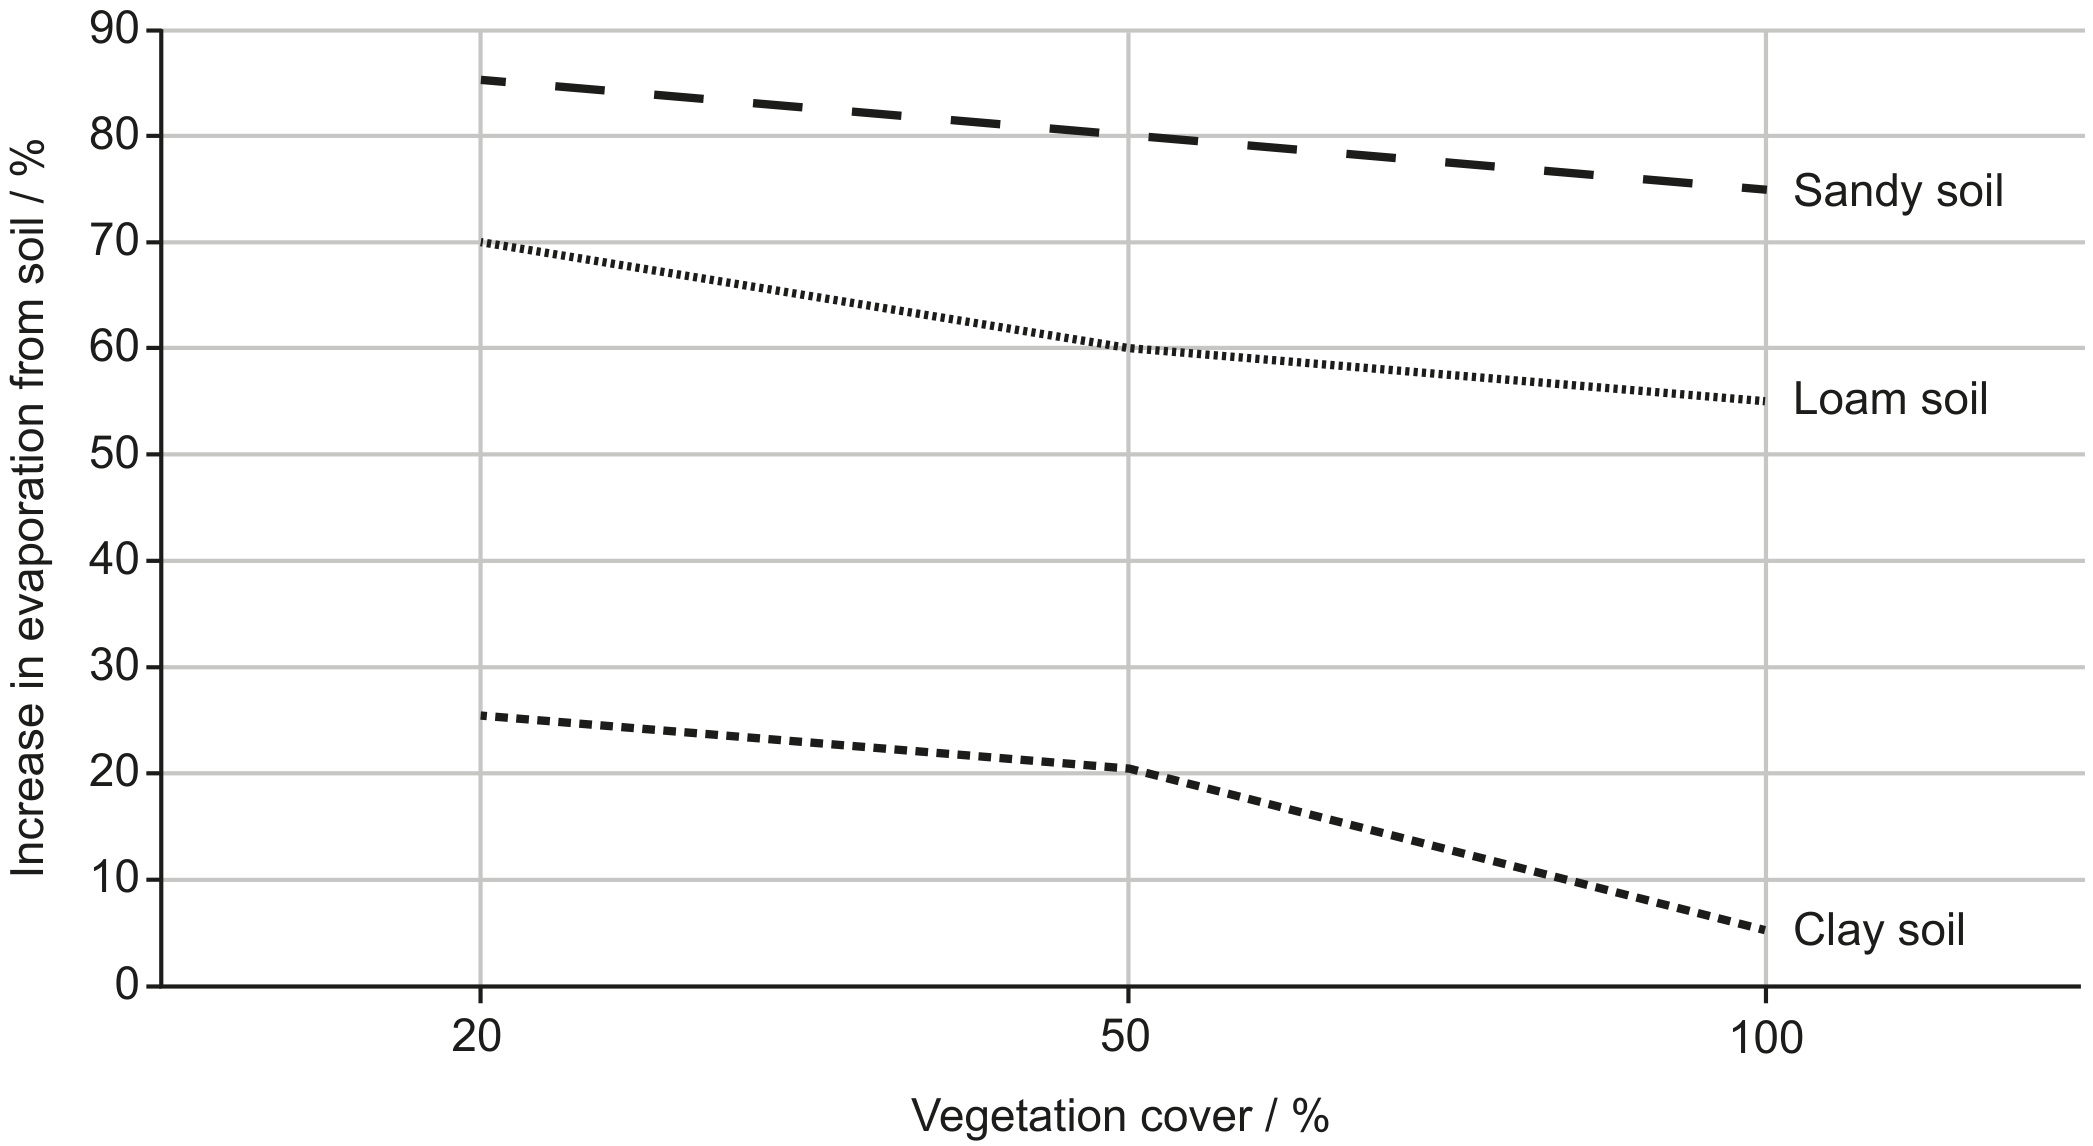
Figure 1(b): Predicted water stress by country in 2040

Figure 2: Relationship between vegetation cover and evaporation from different soil types

Figure 2: Relationship between vegetation cover and evaporation from different soil types

Question 1(a)

(a)

Using Figures 1(a) and 1(b):

[ 2 ]

Question 1(a)(i)

(i)

State one country with no expected change in water stress between 2013 and the 2040 prediction.

[ 1 ]

Question 1(a)(ii)

(ii)

State one difference in water scarcity between 2013 and the 2040 prediction.

[ 1 ]

Question 1(b)

(b)

Outline how climate change may affect the availability of freshwater resources.

[ 2 ]

Question 1(c)

(c)

Describe two water management strategies that can reduce water scarcity.

[ 2 ]
Question 2

[Maximum number: 6]
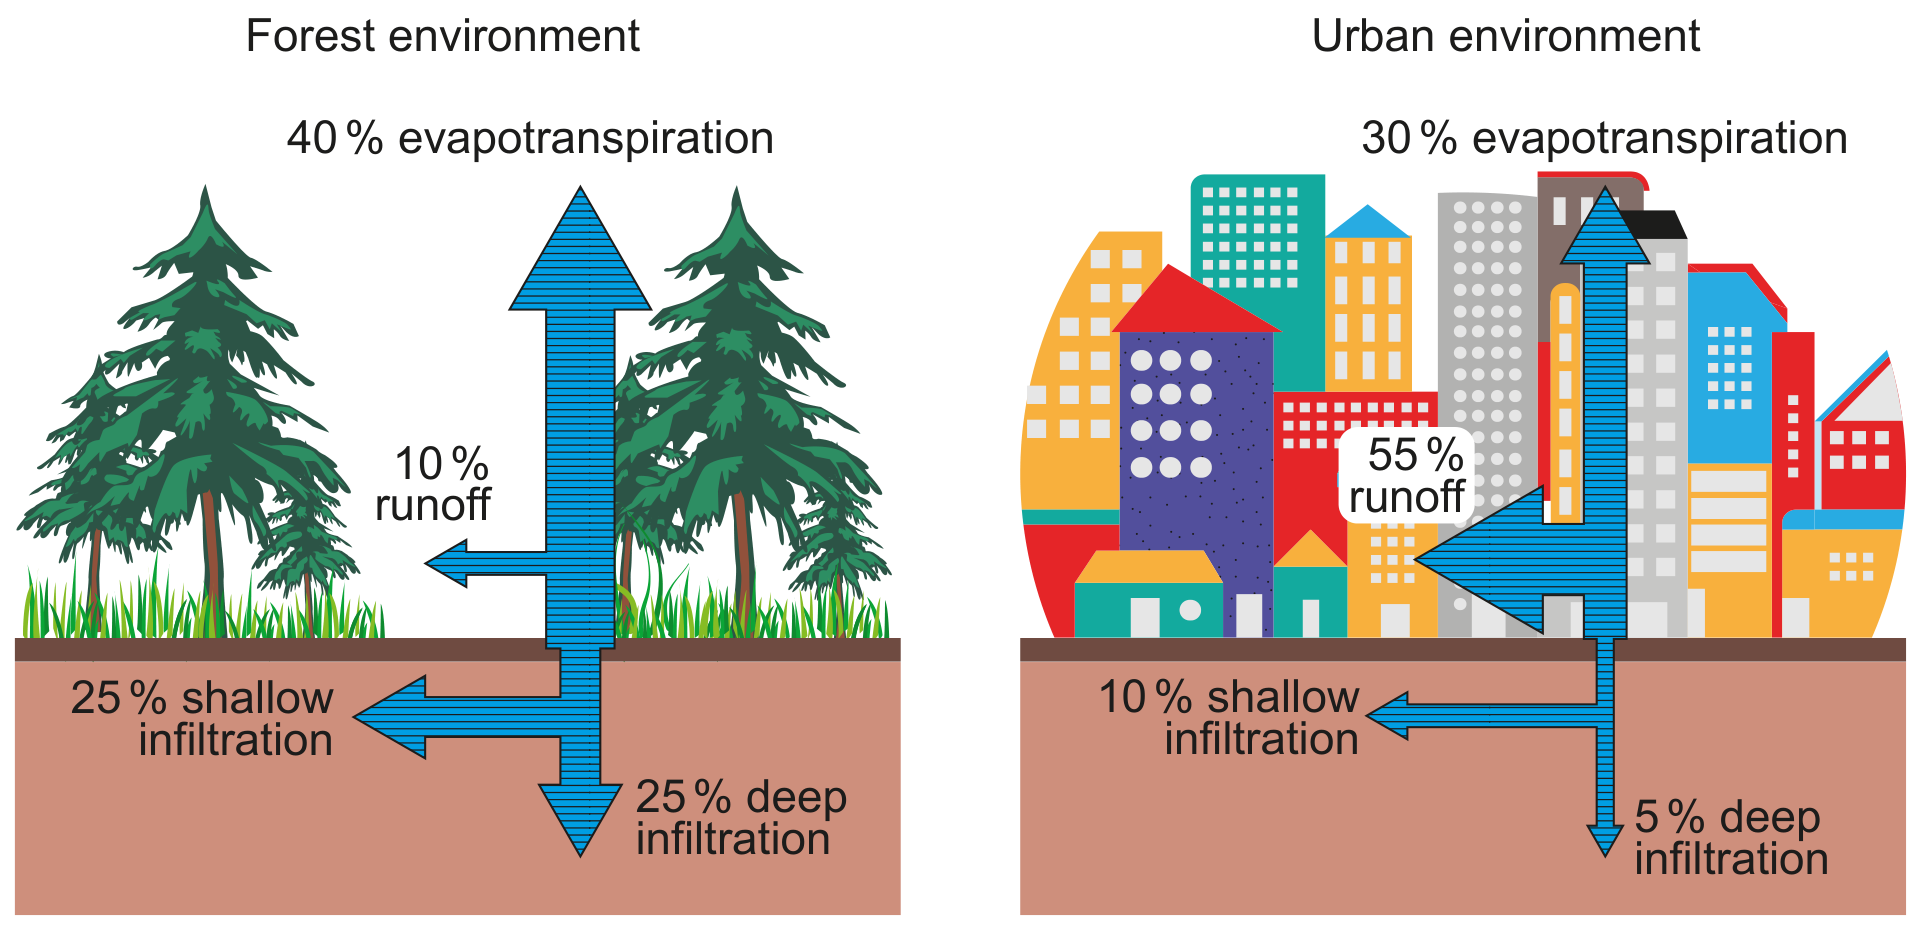
Figure 2(a): Water transfers and transformations after rainfall in forest and urban environments

Figure 2(a): Water transfers and transformations after rainfall in forest and urban environments

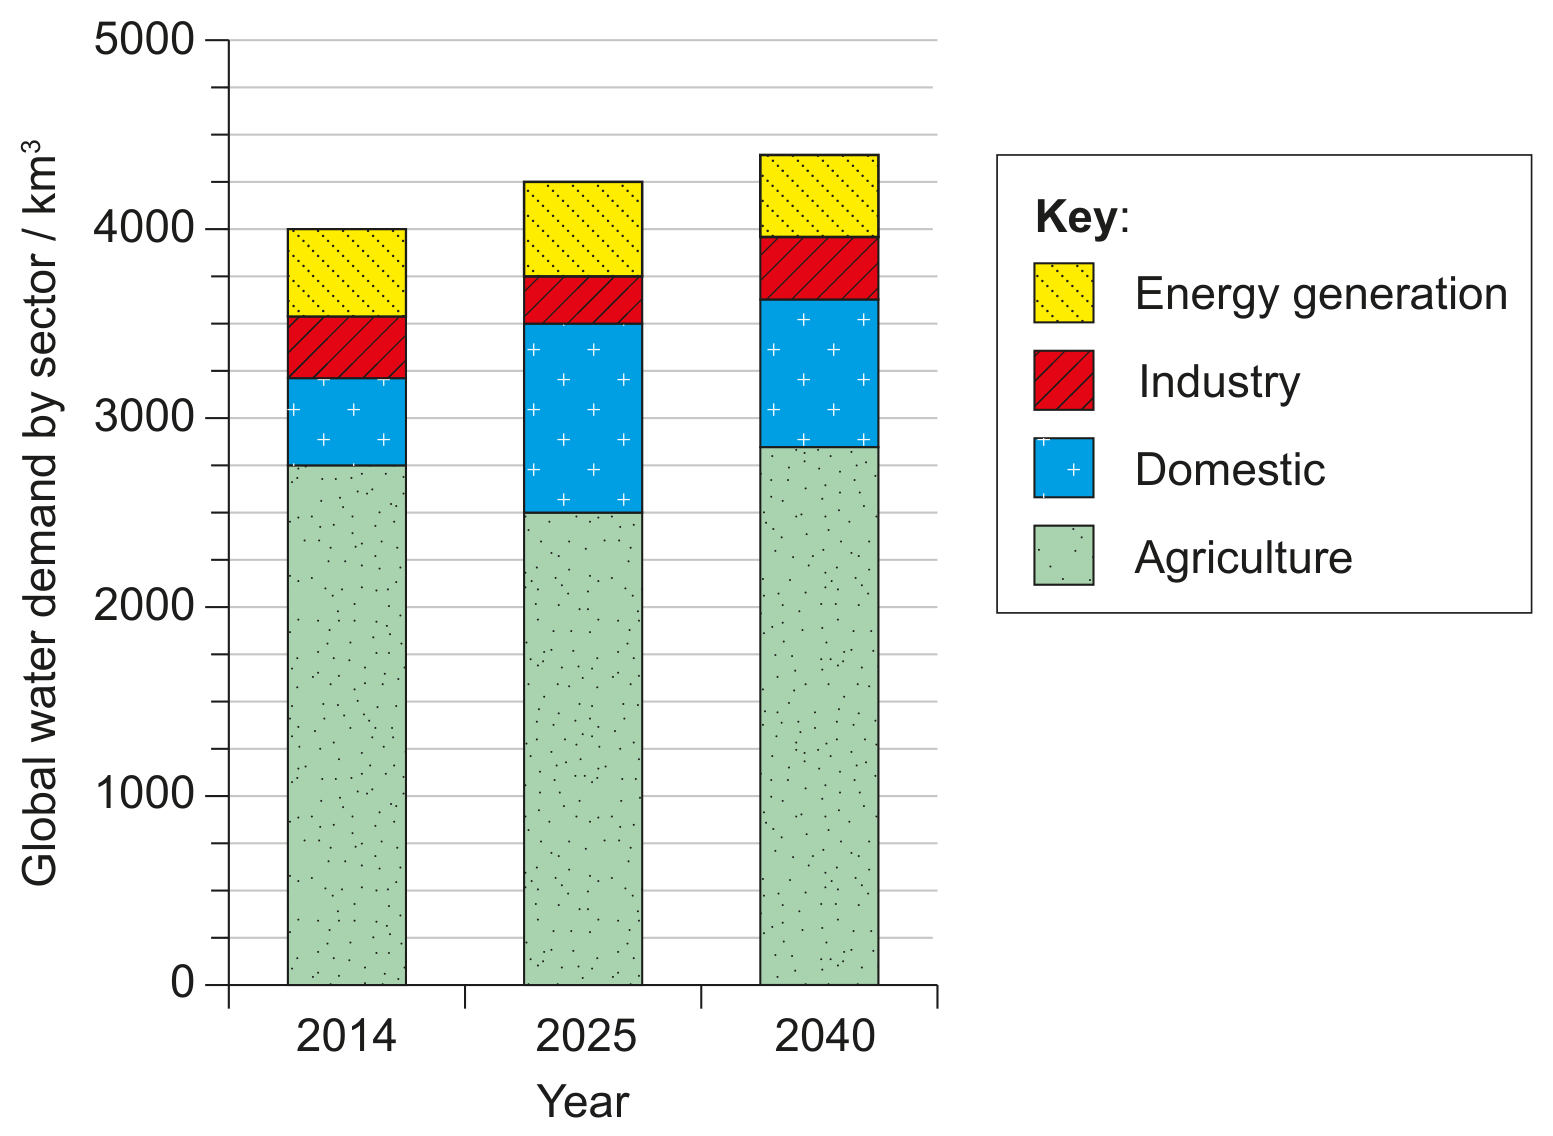
Figure 2(b): Global water demand by sector for 2014, and projected for 2025 and 2040

Figure 2(b): Global water demand by sector for 2014, and projected for 2025 and 2040

Question 2(d)

(a)

Calculate the percentage of water projected to be used for agriculture in 2025, shown in Figure 2(b).

[ 1 ]

Question 2(e)

(b)

Suggest one reason for the projected decrease in the demand for water in agriculture between 2014 and 2025, shown in Figure 2(b).

[ 1 ]

Question 2(f)

(c)

Outline two reasons why water demand shown in Figure 2(b) is projected to increase globally from 2014-2040.

[ 2 ]

Question 2(g)

(d)

Outline two strategies to meet an increasing demand for domestic water.

[ 2 ]

Question 2

[Maximum number: 6]

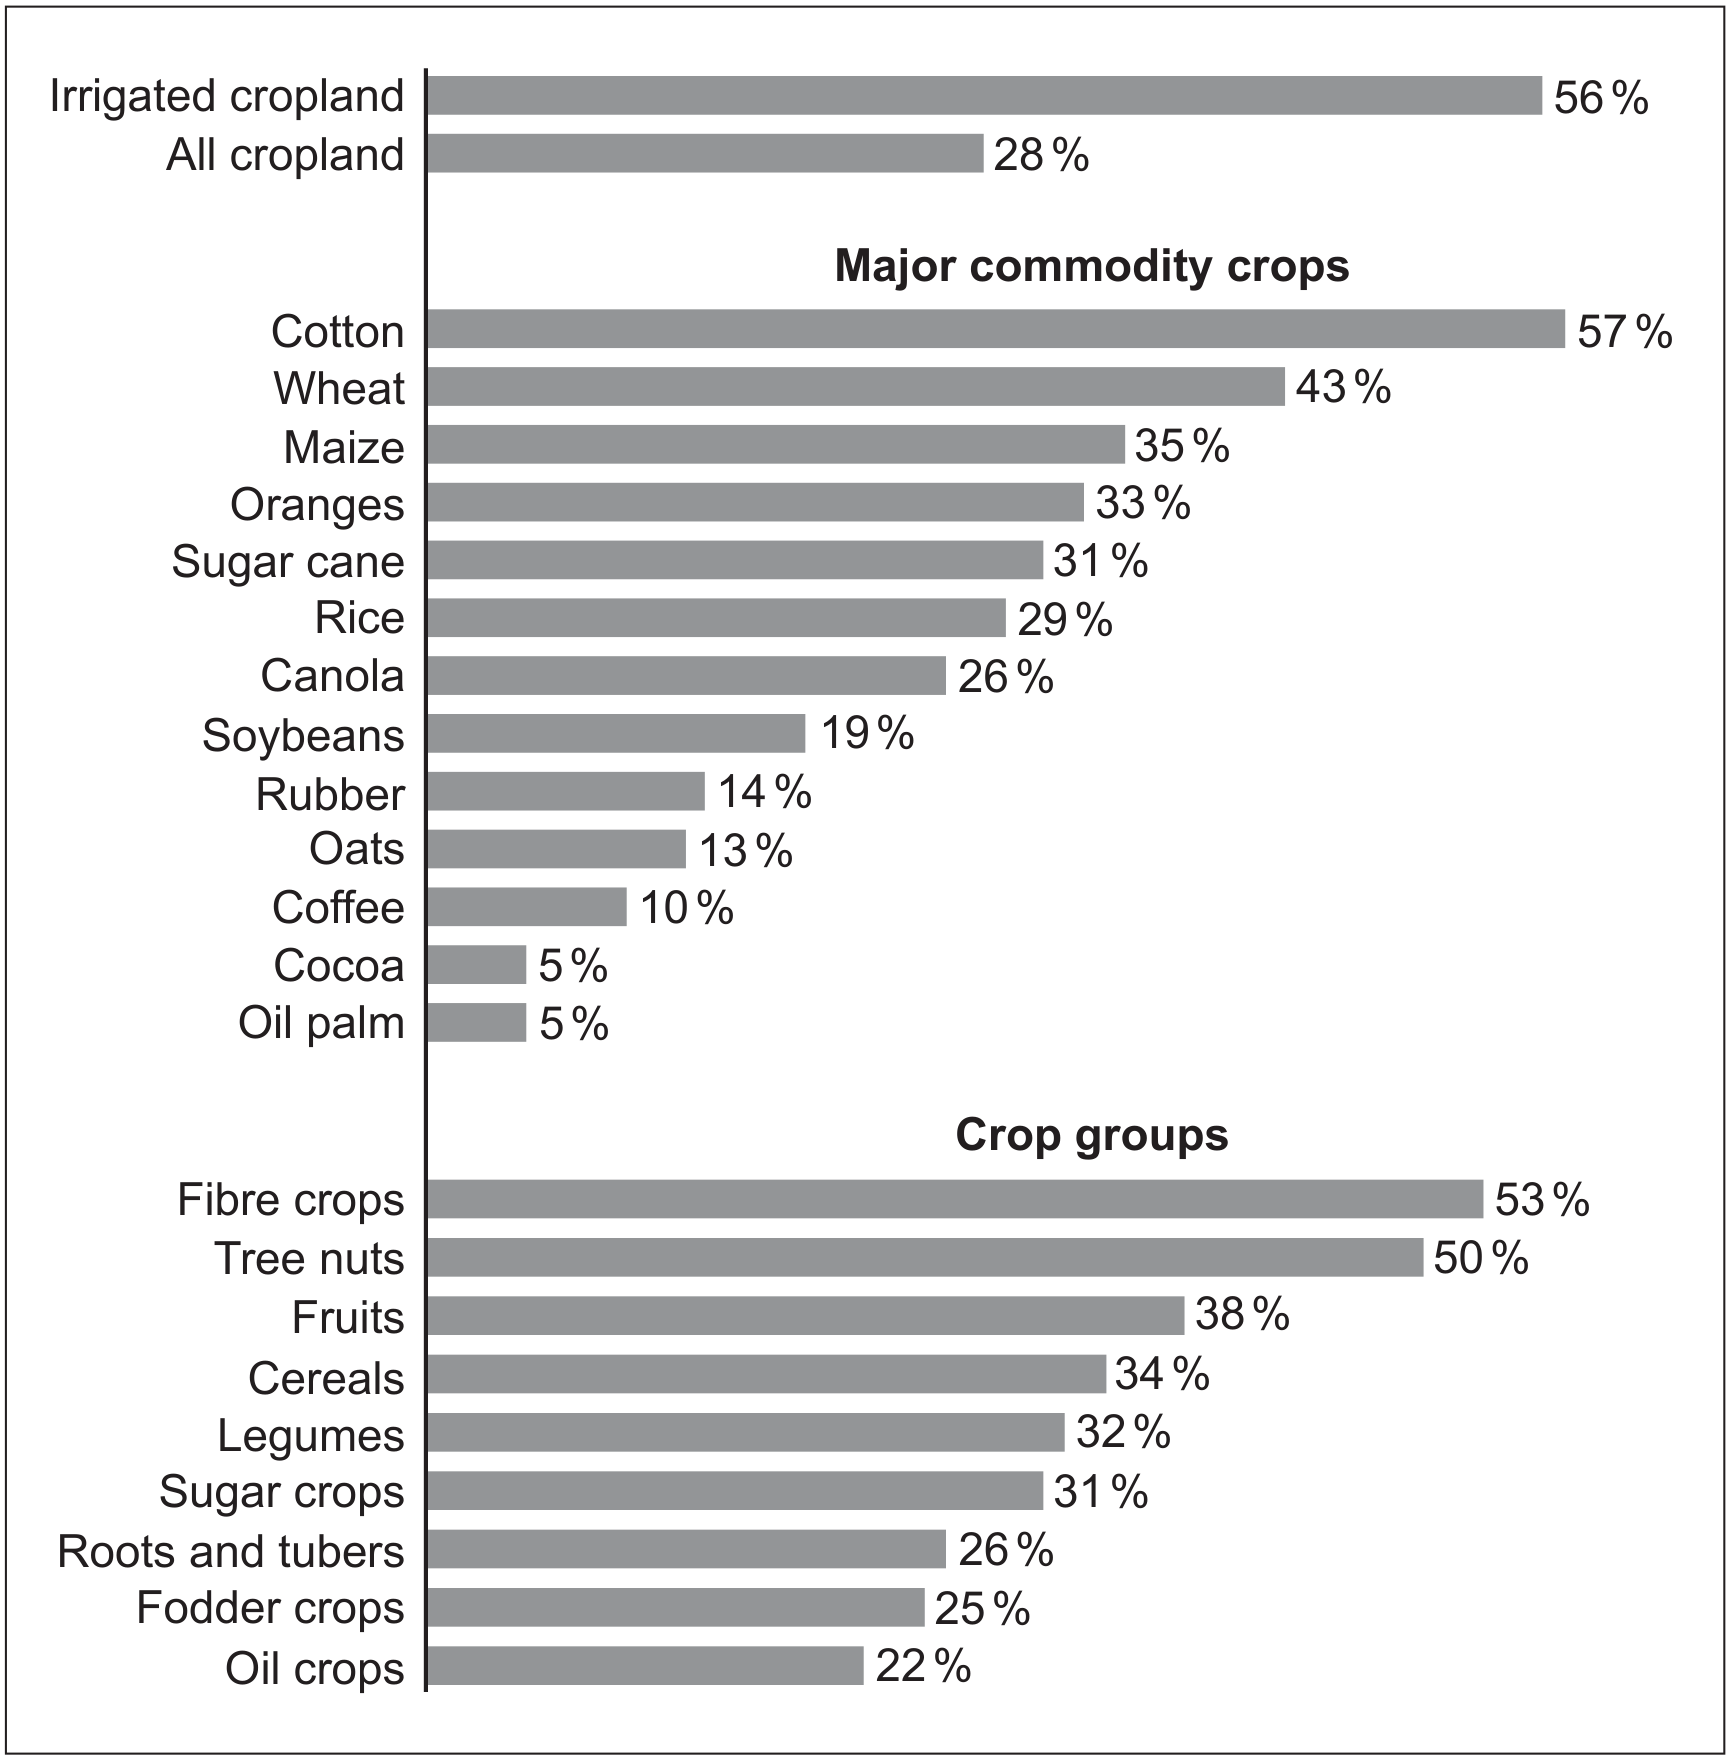
Water stress is the total annual extraction of water as a proportion of the renewable supply in a given area. If the extraction represents 40 % or more of the available supply it is described as a high risk area.

Figure 2: Water stress for selected crops

Figure 2: Water stress for selected crops

Question 2(a)

(a)

State the crop that is under the greatest water stress.

[ 1 ]

Question 2(b)

(b)

Identify two strategies that could be used to grow crops in areas of high water stress.

[ 2 ]

Question 2(c)

(c)

Identify three factors that may lead to an increase in water stress.

[ 3 ]

Question 7

[Maximum number: 4]

Figure 9(a): Fact file on water resources in Beijing
Figure 9(a): Beijing is water scarce. Water use per person has decreased, but total demand has increased because of population growth.
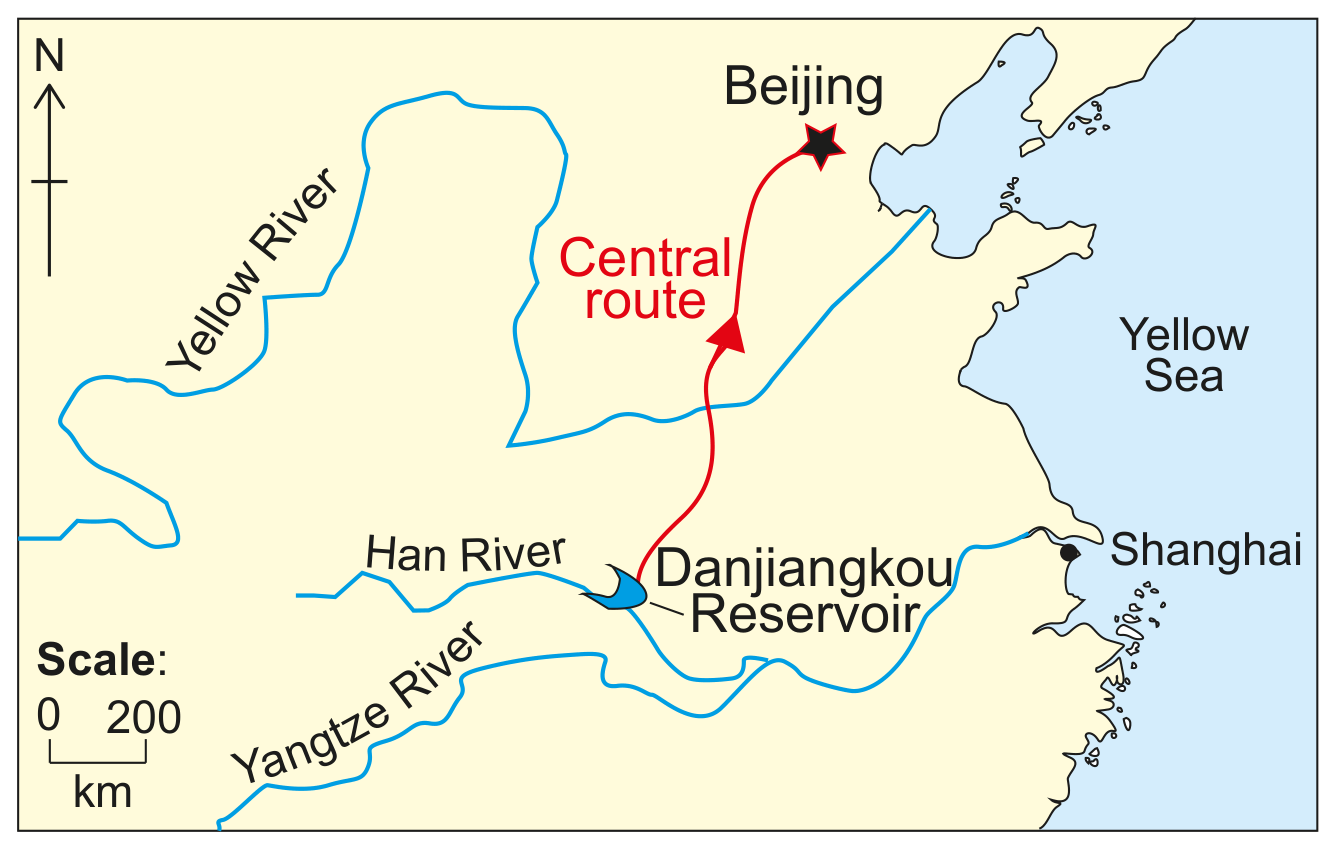
By 2020 about 70% of Beijing water was supplied from the South-North Water Diversion Project.
The project expanded the Danjiangkou dam and reservoir, transfers water over 1200 km to Beijing, generates hydroelectricity and provides flood control.

Question 7(a)

(a)

Outline one way in which a reduction in water usage per person as referred to in

Figure 9(a) could have been achieved.

[ 1 ]

Question 7(b)

(b)
Figure 9(b): Central route of the South-North Water Diversion Project

Figure 9(b): Central route of the South-North Water Diversion Project

With reference to Figures 9(a) and 9(b), evaluate the South-North Water

Diversion Project.

[ 3 ]

Question 6(b)

[Maximum number: 7]

Explain how the growth in human population can affect local and regional water resources.

Question 6(c)

[Maximum number: 9]

To what extent are water scarcity issues better addressed through changing human behaviour than through technological development?

Question 7(b)

[Maximum number: 7]

Evaluate the sustainability of two water management strategies to improve access to freshwater resources in a society.

0 selected