IB ESS 4.4 Water Pollution Topic Practice

EduNinja

Question 2

[Maximum number: 4]
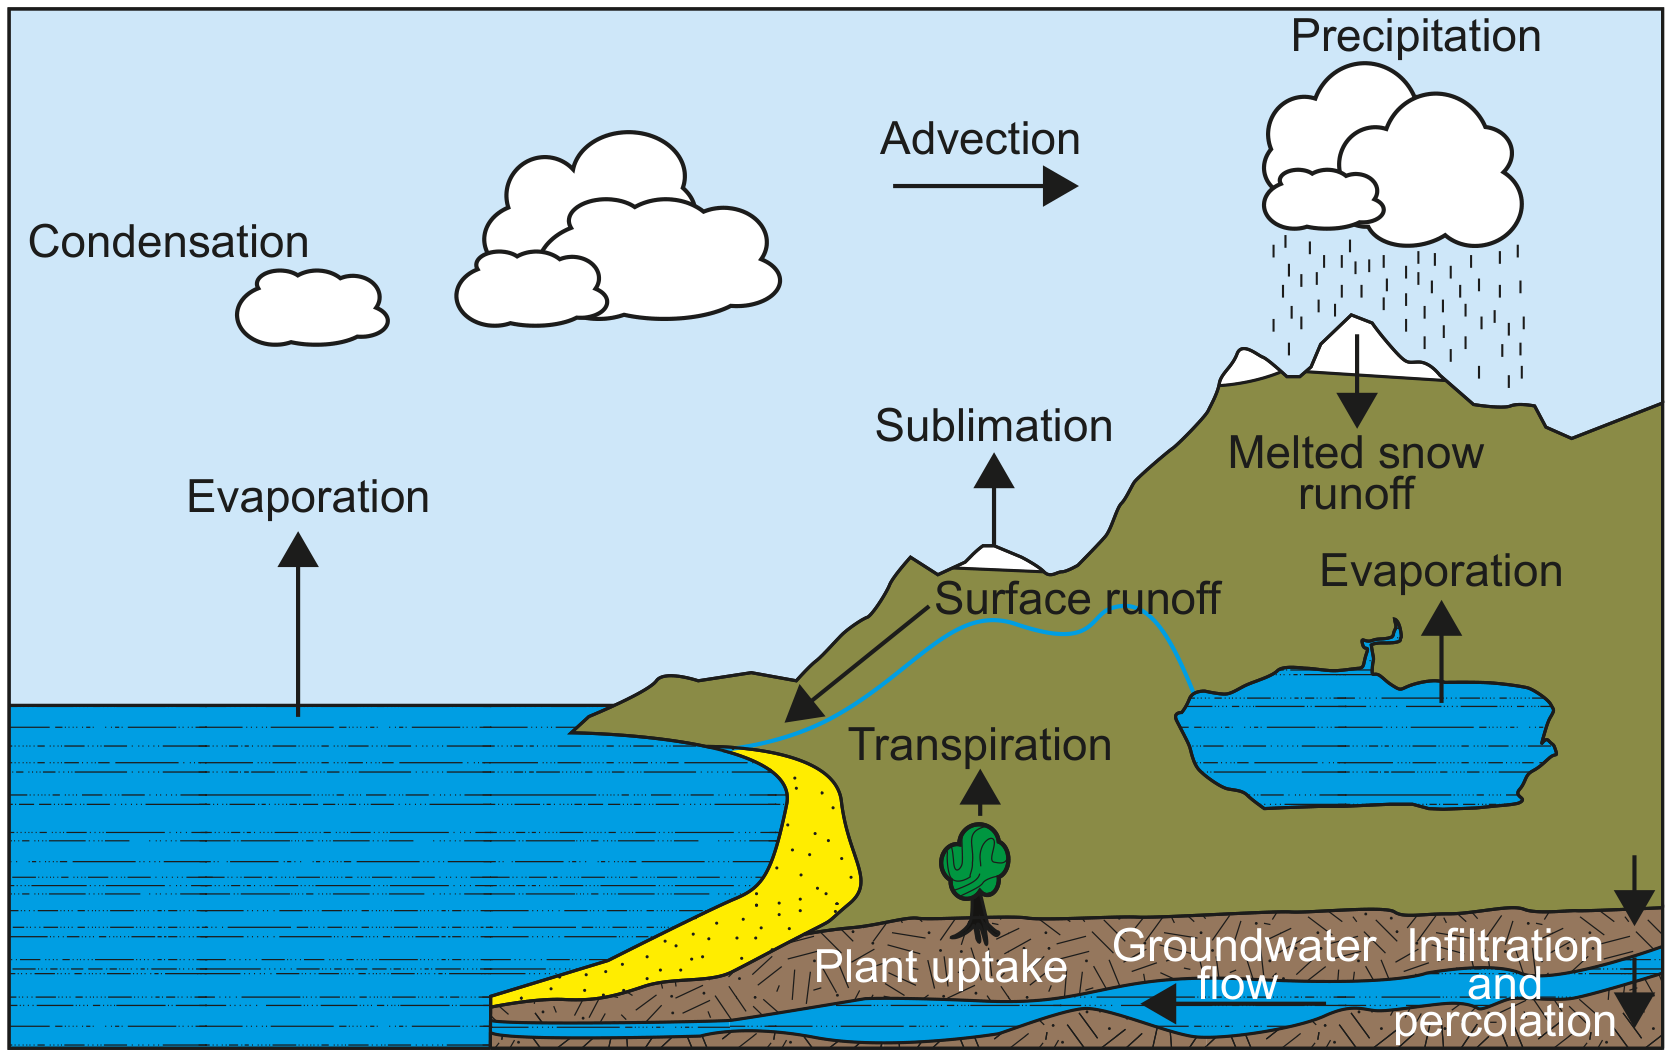
Figure 2: Representation of the water cycle

Figure 2: Representation of the water cycle

Question 2(b)

(a)

Runoff from agricultural land can result in excess nutrients entering water bodies.

[ 4 ]

Question 2(b)(i)

(i)

Outline one indirect measure of organic pollution.

[ 3 ]

Question 2(b)(ii)

(ii)

State one management strategy that could control the release of agricultural runoff.

[ 1 ]
Question 5

Question 5(a)

(a)
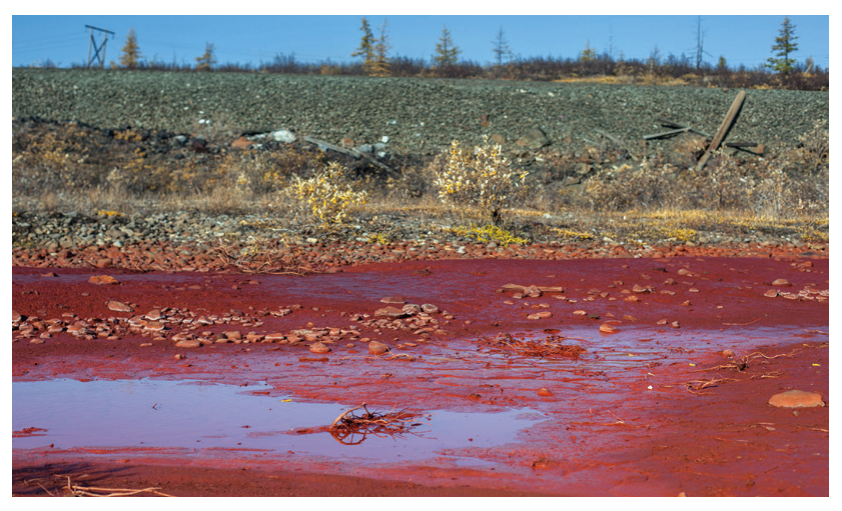
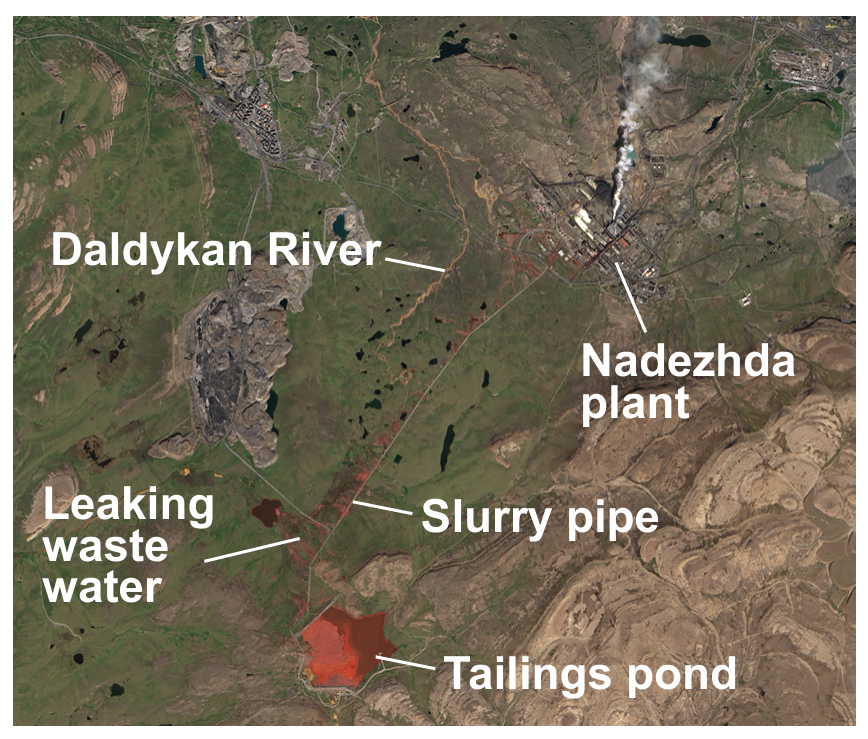
Figure 6(e): Daldykan River in Norilsk

Figure 6(e): Daldykan River in Norilsk

Figure 6(e): Daldykan River in Norilsk (continued)

Figure 6(e): Daldykan River in Norilsk (continued)

Figure 6(d): The Nadezhda smelting plant in Norilsk
- Opened in 1979.
- The plant may be a possible source of water discolouration.

Describe a practical strategy using a biotic index to provide evidence that the Daldykan River (Figures 6(d) and 6(e)) is damaged by effluent from the metal processing plant.

[ 3 ]

Question 5(b)

(b)

When measuring levels of pollution, state one advantage and one disadvantage of using a biotic index compared to measuring the pollutants directly.

[ 2 ]

Question 5(b)(i)

(i)

Advantage

[ 1 ]

Question 5(b)(ii)

(ii)

Disadvantage

[ 1 ]

Question 4

Question 4(a)

(a)
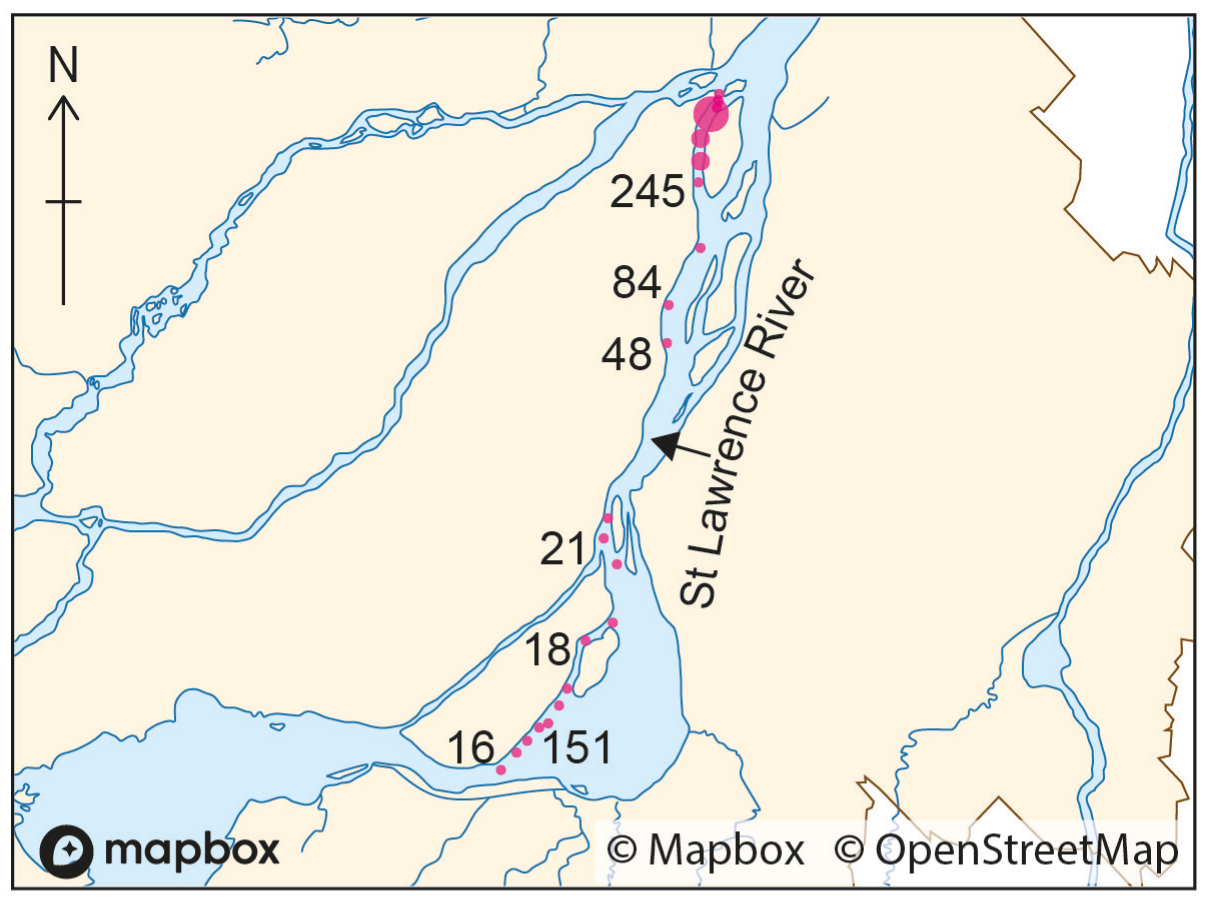
Figure 11(b): Coliform bacteria one day after untreated sewage release

Figure 11(b): Coliform bacteria one day after untreated sewage release

Using Figure 11(b), estimate the highest concentrations of coliform bacteria (in units/ 100 mL ) found in the St Lawrence River one day after the untreated sewage was released.

[ 1 ]

Question 4(b)

(b)

Outline an environmental problem that may result from the release of untreated sewage into a river.

[ 2 ]

Question 4(c)

(c)
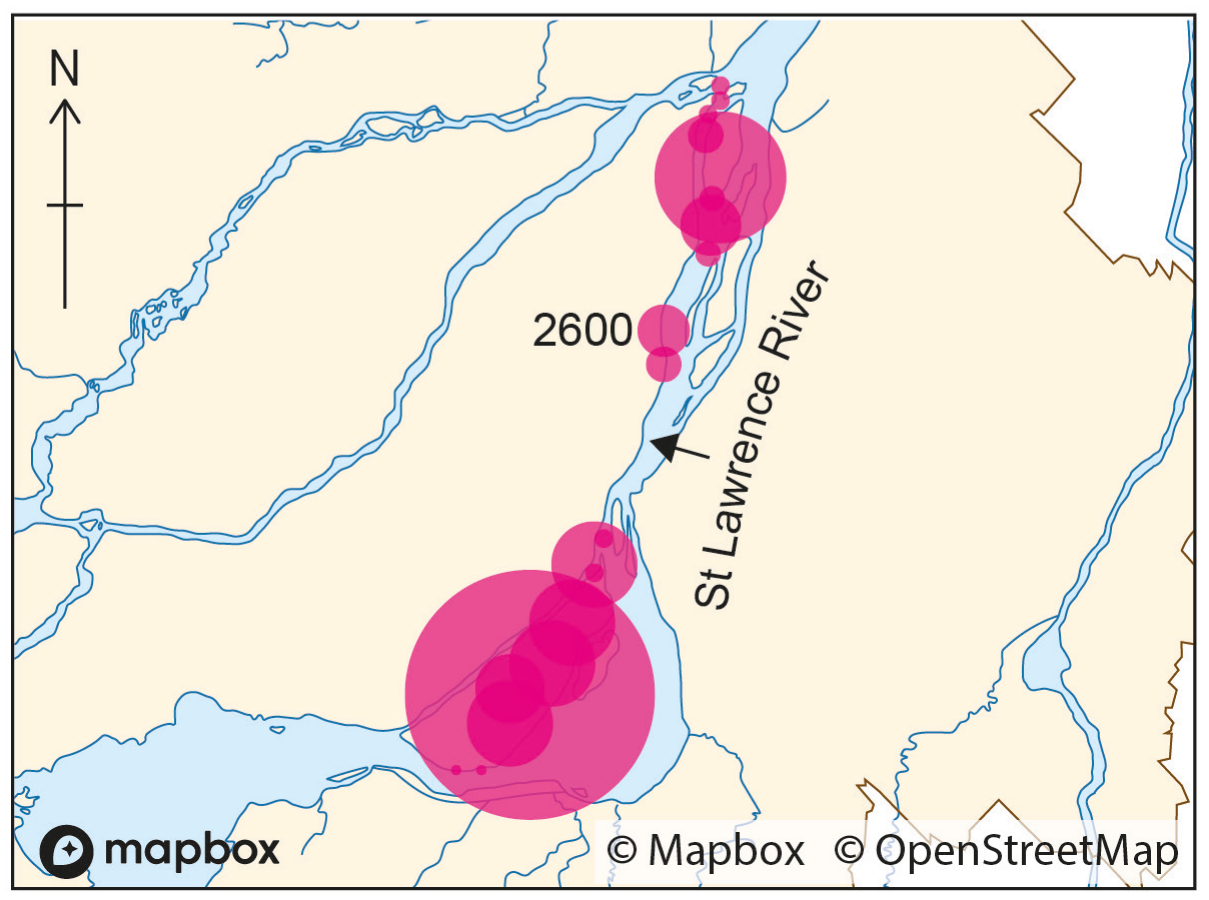
Figure 11(a): Coliform bacteria before untreated sewage release

Figure 11(a): Coliform bacteria before untreated sewage release

Figure 10: Untreated sewage release into the St Lawrence River
Figure 10: Montreal discharged 5-8 billion litres of untreated sewage into the St Lawrence River in November 2015; river pollution returned to normal within 4-10 days.
Quebec discharged 110 million litres in November 2016; nationally, 205 billion litres of untreated sewage are released into Canadian rivers and oceans each year.

With reference to Figures 10, 11(a) and 11(b), describe a method to monitor the impact of the release of untreated sewage into the St Lawrence River ecosystem.

[ 3 ]

Question 4

Question 4(a)

(a)

Distinguish between point and non-point sources of pollution with reference to named examples.

[ 4 ]

Question 4(b)

(b)

For a named water pollutant, evaluate two management strategies to maintain the sustainability of water sources.

[ 7 ]

Question 8

[Maximum number: 3]
PollutantUnit20112012201320142015
Nitratekt32.8032.6031.3037.1032.90
Phosphatekt4.504.404.004.804.40
Leadkg186.18215.91201.0041.213.57
Chromiumkg508.68460.10438.05266.6593.59

Figure 9(d): Pollutants in wastewater discharged into Beijing rivers, 2011-2015

Question 8(a)

(a)

With reference to Figure 9(d), identify the year in which eutrophication was most likely to have occurred.

[ 1 ]

Question 8(b)(i)

(b)

Outline one advantage of using the data in Figure 9(d) compared to using a biotic index for assessing pollution.

[ 1 ]

Question 8(b)(ii)

(c)

Outline one advantage of using a biotic index compared to using the data in Figure 9(d) for assessing pollution.

[ 1 ]

Question 5

Question 5(a)

(a)

Outline, using examples, the differences between primary and secondary pollution.

[ 4 ]

Question 5(b)

(b)

Explain the causes and effects of acid deposition on natural ecosystems.

[ 7 ]

Question 5(c)

(c)

To what extent is pollution impacting human food production systems?

[ 9 ]

Question 5(a)

[Maximum number: 4]

Outline one method for measuring the impact of a build-up of dead organic matter in an aquatic ecosystem.

0 selected