Interferon-alpha (IFN- ) can be produced as a recombinant human protein to treat some types of cancer. The gene IFNA2 codes for IFN- .
One method of producing recombinant IFN- uses genetically engineered Escherichia coli bacteria that contain recombinant plasmids. Each recombinant plasmid contains:
- the gene IFNA2
- three regulatory sequences of the lac operon (promoter, operator and lacl)
- a gene for antibiotic resistance, .
Each of the sequences for the lacI gene and gene contains its own promoter. As a result, these genes are always expressed in E. coli bacteria that contain this recombinant plasmid.
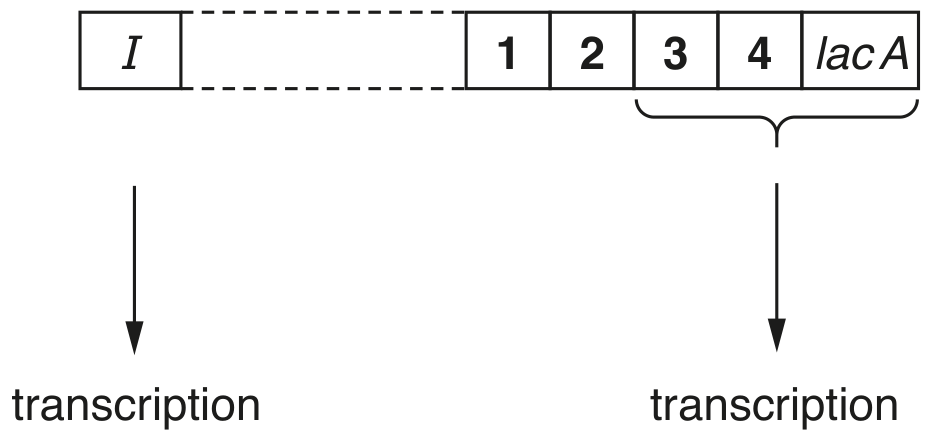
Fig. 2.1 is a diagram of the recombinant plasmid. The promoter regions of the lacI gene and gene are not shown.
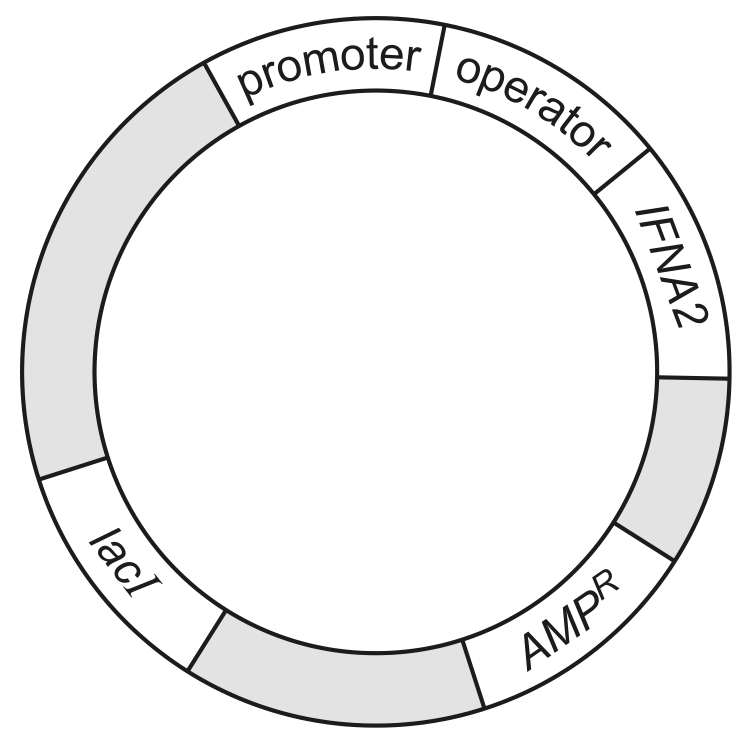
Fig. 2.1
The start of transcription of the gene IFNA2 by E. coli with the recombinant plasmid shown in Fig. 2.1 needs to be controlled to obtain an optimum yield of IFN .
Scientists investigated the effect of two inducers of transcription on the production of recombinant IFN- :
- lactose, which is converted to allolactose in E. coli
- IPTG, which is a synthetic molecule with a very similar structure to allolactose. IPTG cannot be broken down by E. coli.
The scientists grew three cultures of E. coli containing the recombinant plasmid in the same growth medium. The growth medium contained glucose, amino acids, essential vitamins and minerals. The growth medium did not contain lactose.
After four hours, either lactose or IPTG at the same concentration was added to two of the cultures of E. coli. As a control, the third culture of E. coli was grown without adding lactose or IPTG.
The concentration of recombinant IFN- in the cultures was measured at different times over a period of 28 hours. The results are shown in Fig. 2.2.
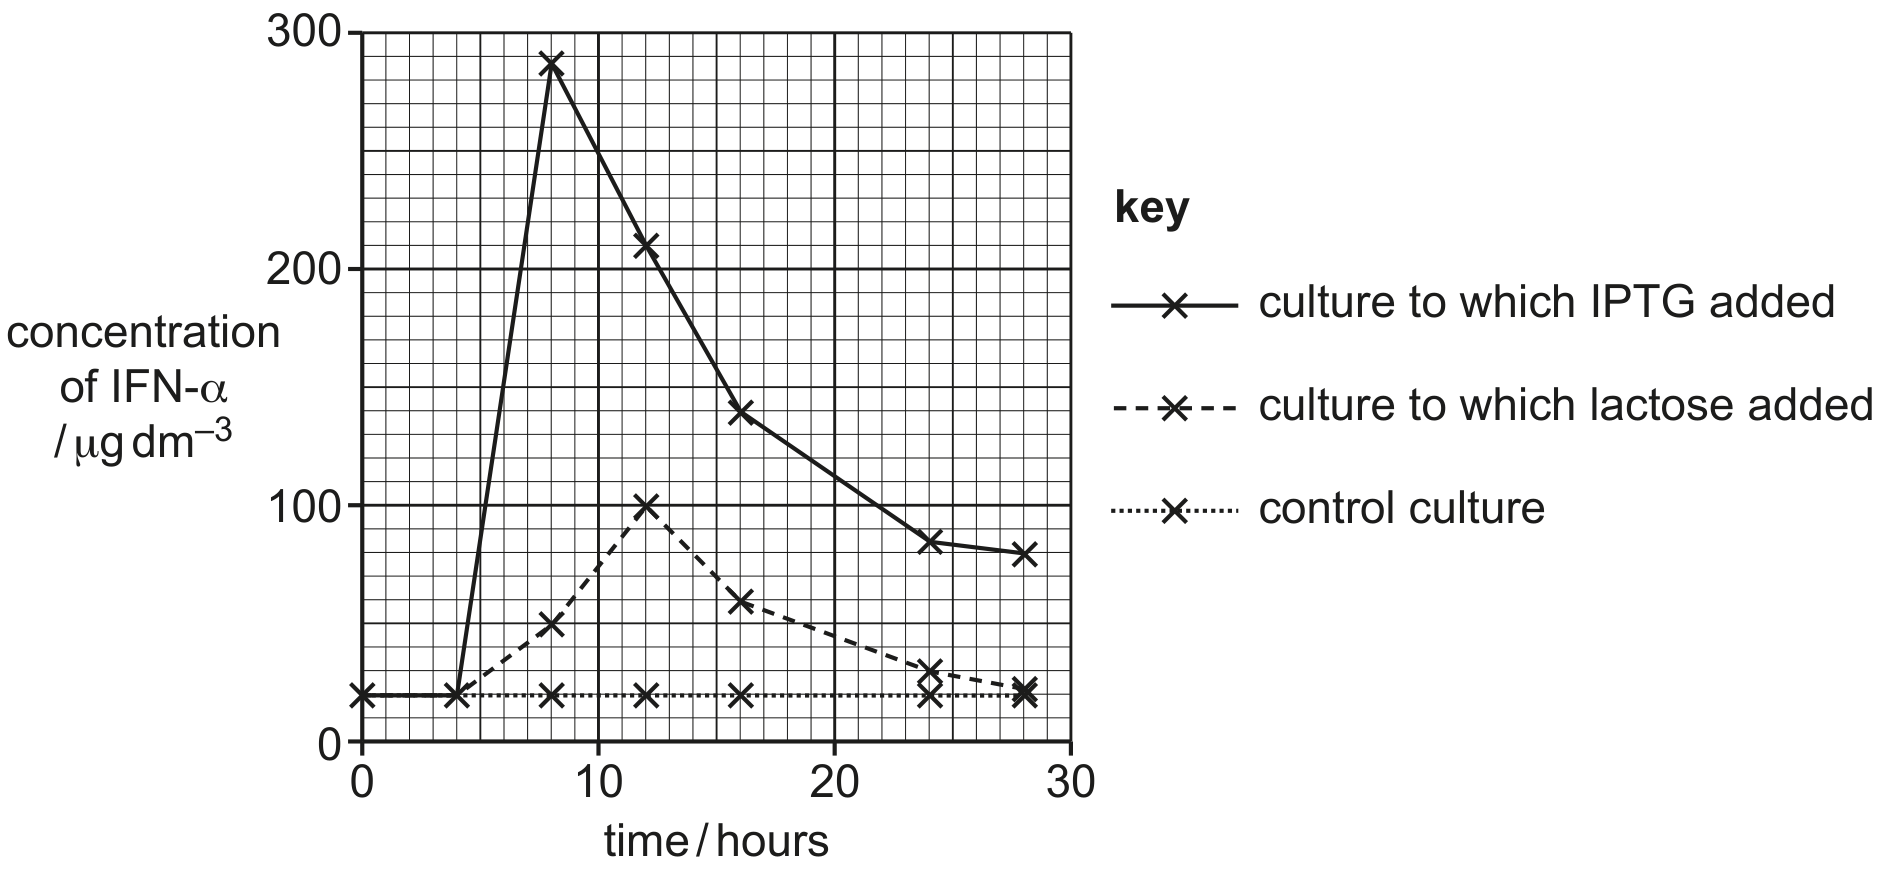
Fig. 2.2
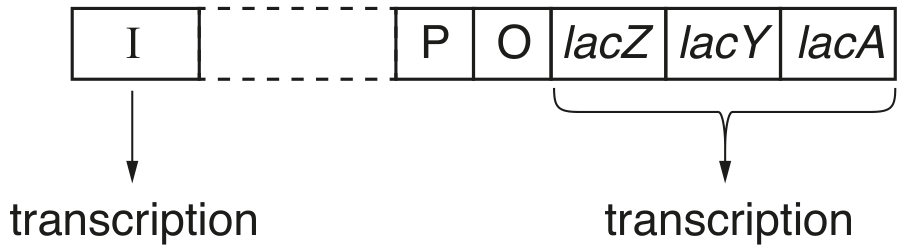
The regulatory sequences of the lac operon contained in the recombinant plasmid are involved in the control of transcription of the gene IFNA2.
Explain the role of the gene lacI in the control of transcription of the IFNA2 gene between 0 hours and 4 hours.
With reference to Fig. 2.2, describe the changes in the concentration of recombinant IFN- in the culture containing IPTG from when IPTG was added at 4 hours to the end of the experiment at 2 8 hours.
Suggest one reason for the difference between the concentration of recombinant IFN- in the culture at 8 hours in the presence of lactose and the concentration of recombinant IFN- in the culture at 8 hours in the presence of IPTG.
Suggest one reason for the change in the concentration of recombinant IFN- in the culture containing IPTG from 12 hours to 16 hours.