The rate of photosynthesis is affected by many environmental factors.
A student carried out an experiment to investigate the relationship between the concentration of carbon dioxide available to an aquatic plant, Cabomba caroliniana, and its rate of photosynthesis.
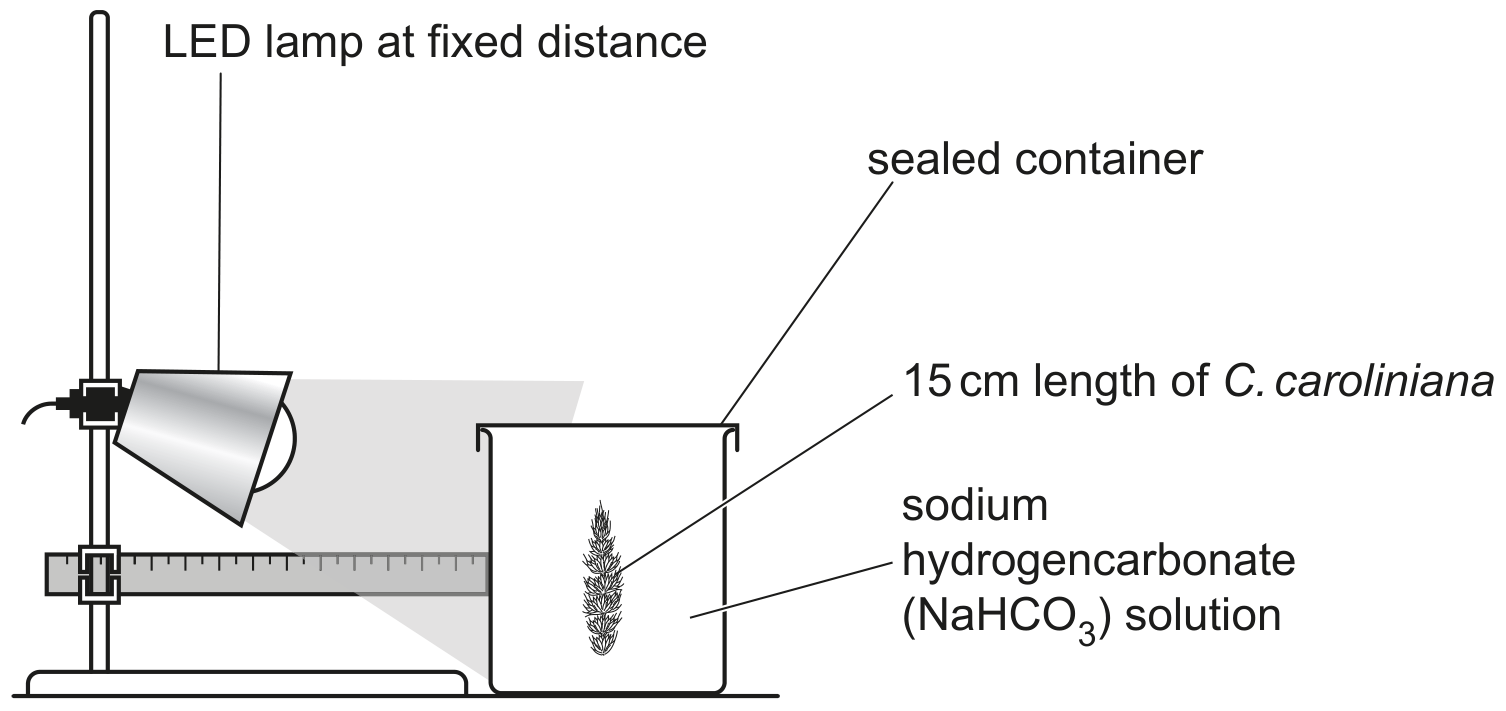
Fig. 1.1 shows the experimental set-up for this investigation.
- Sodium hydrogencarbonate solution was used as a source of carbon dioxide.
- The concentration of carbon dioxide was varied using six different concentrations of sodium hydrogencarbonate solution.
- All C. caroliniana plants were kept in the dark before the light was switched on at the start of the experiment.
- Five replicates were carried out at each concentration.
- The rate of photosynthesis was obtained by calculating the percentage change in dissolved oxygen concentration in the solution over five minutes.
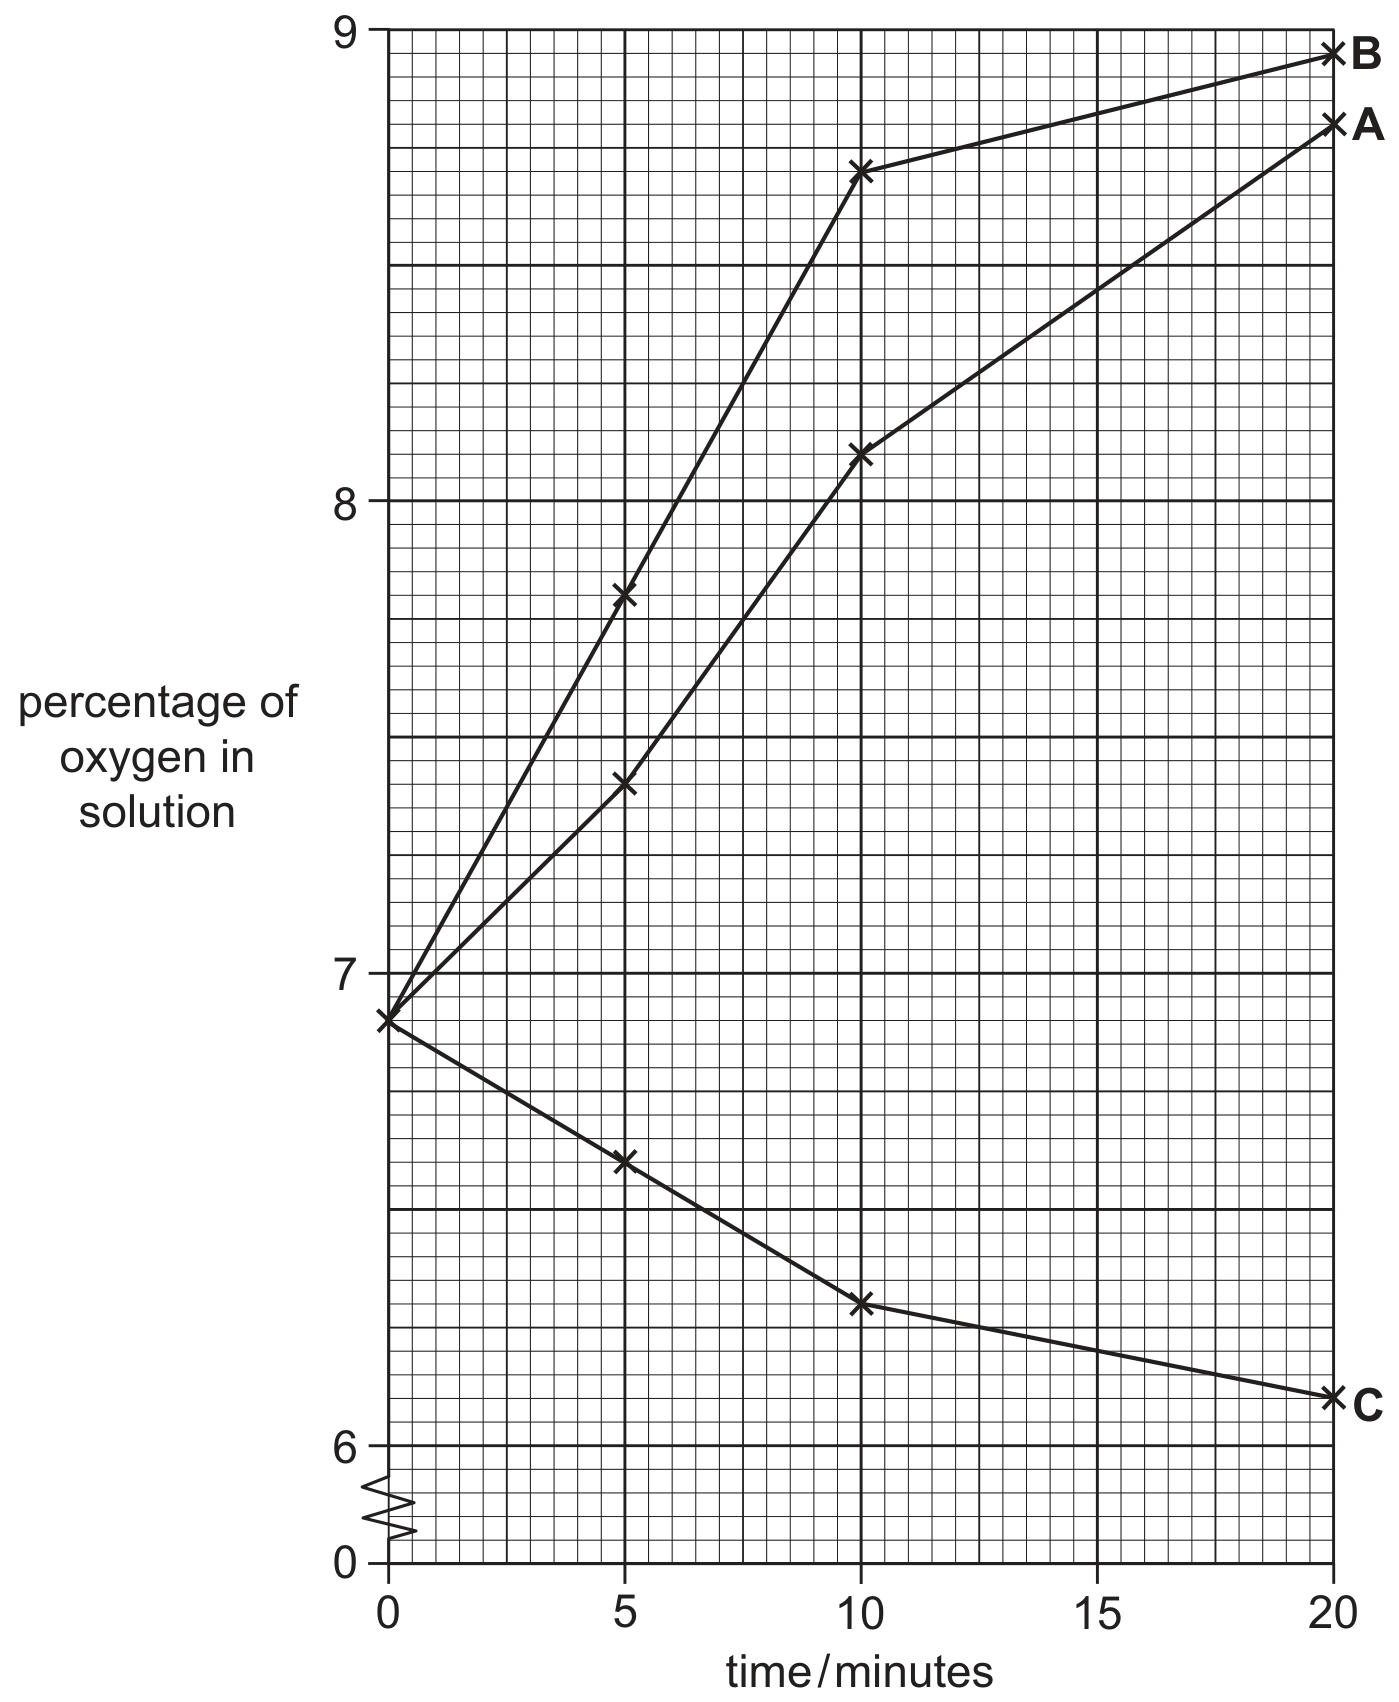
Fig. 1.2 shows the results of the investigation.
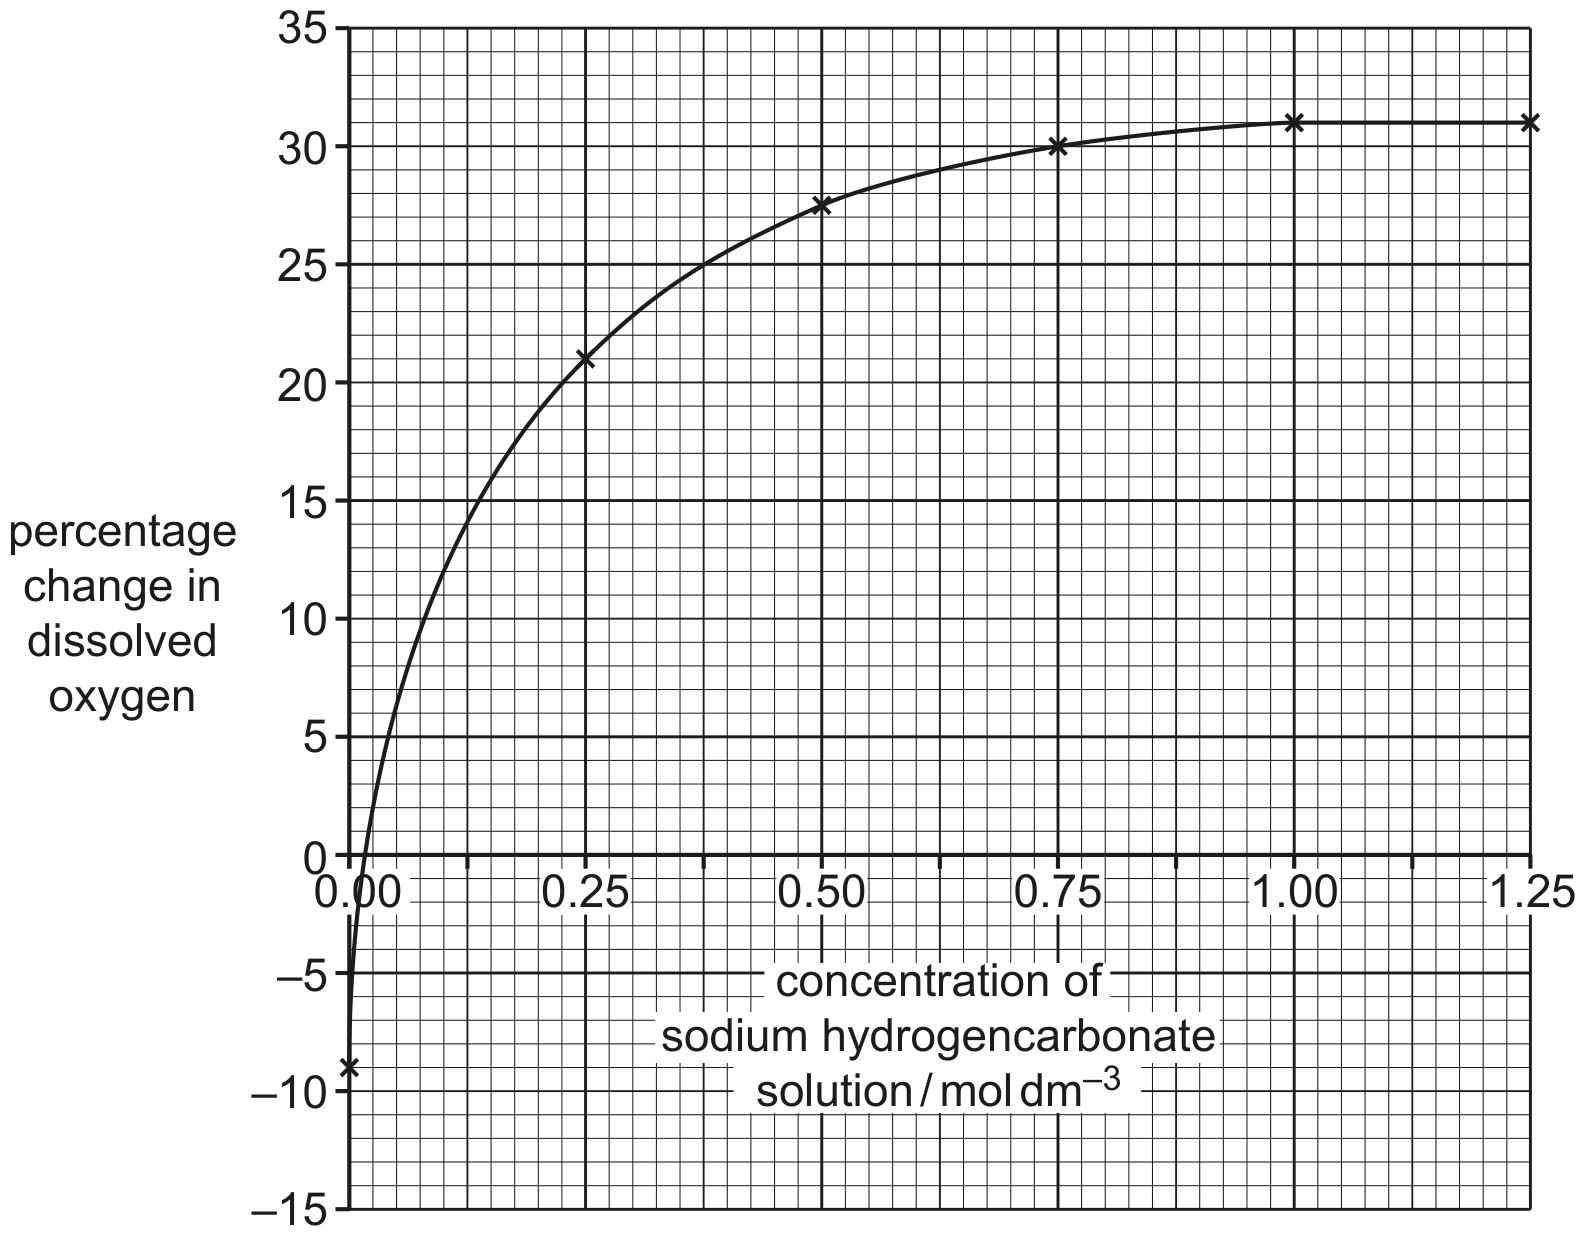
Fig. 1.2
The percentage change in dissolved oxygen for C. caroliniana at of sodium hydrogencarbonate solution is negative.
Suggest reasons for this negative value.