EduNinja
[Maximum number: 2]

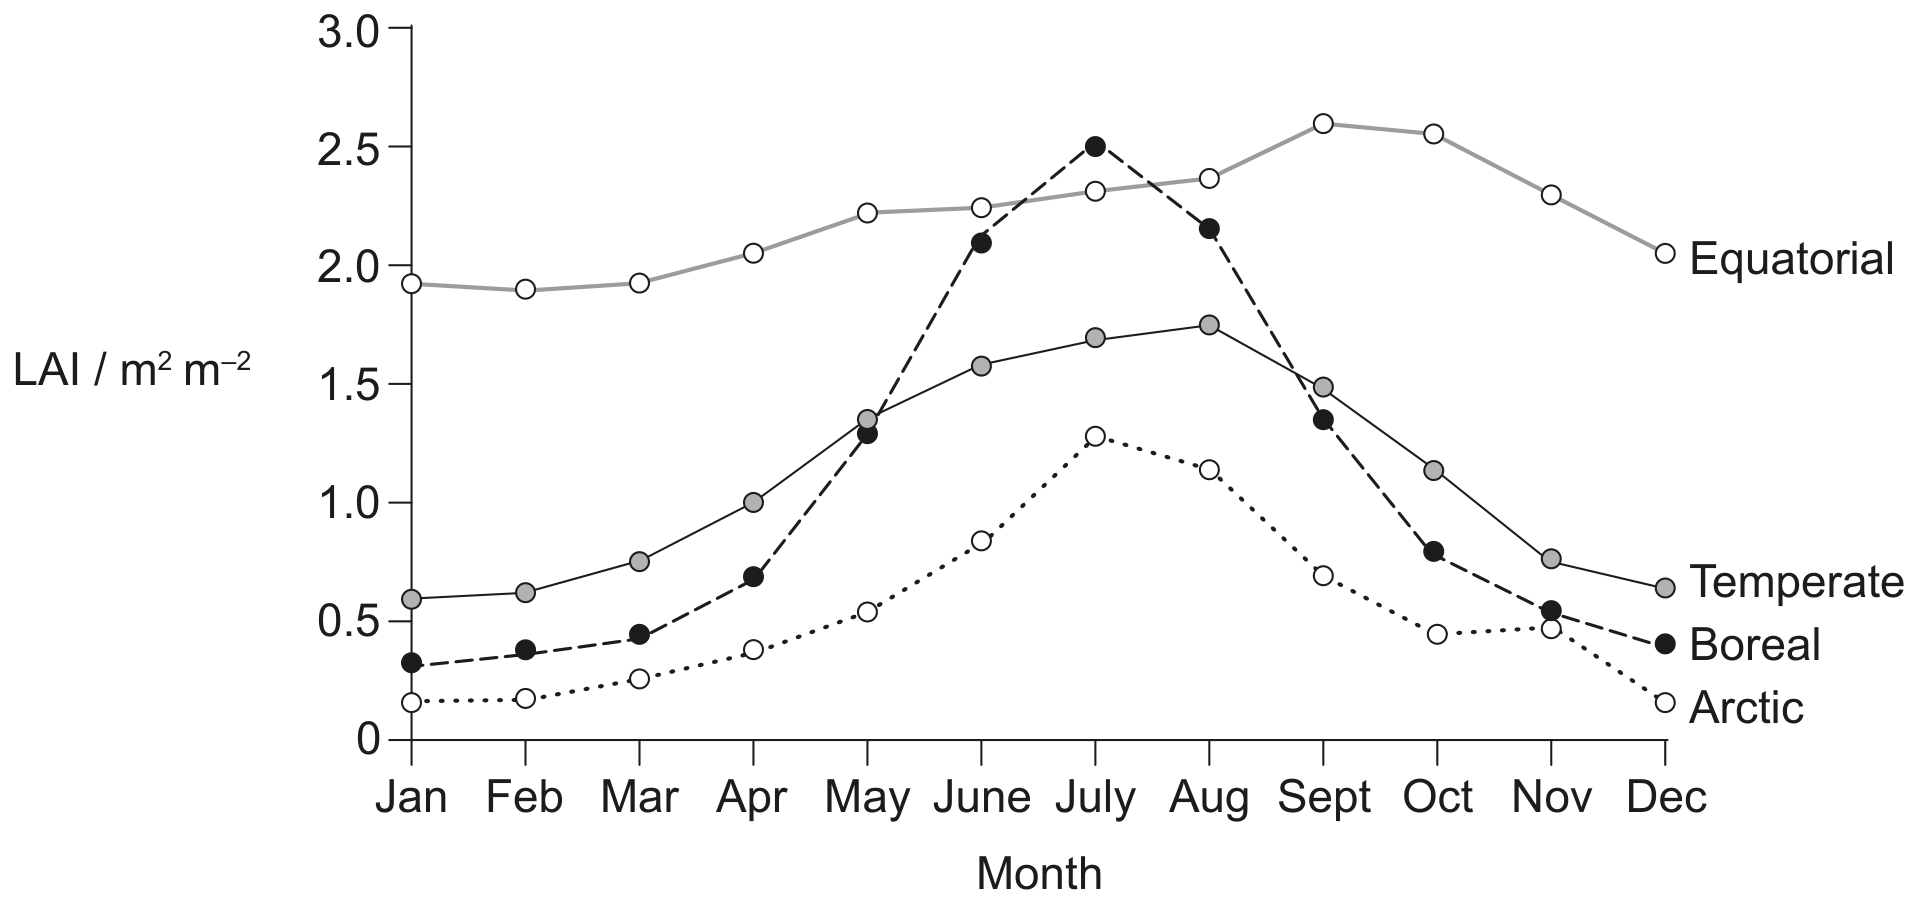
Remote sensing satellites are used to monitor the Earth's ecosystems. One measure of ecosystem status is leaf area index (LAI), which is the total area of leaves in square metres per square metre ( m2 m2\mathrm{m}^{2} \mathrm{~m}^{-2} ) of the Earth's surface. The graph shows LAI estimates, calculated using data from the Global Inventory Monitoring and Modelling System (GIMMS), during the period from 1981 to 2011. The data points are monthly averages in four latitudinal zones in the northern hemisphere.

Question image
(a)

There is evidence of a change in mean LAI values on Earth over recent decades. Changes can be quantified by calculating LAI anomalies. These are differences between annual LAI values and the mean LAI for the entire given time period.

The graph shows global LAI anomalies for the period from 1981 to 2014, based on data from GIMMS. It also shows mean global LAI anomalies between 1981 and 2009, based on data from three other remote sensing programmes. Vertical bars show the timing of El Niño events. The darkness of the bars indicates the intensity of the El Niño events. The darker the bar, the more intense the event.

Question image

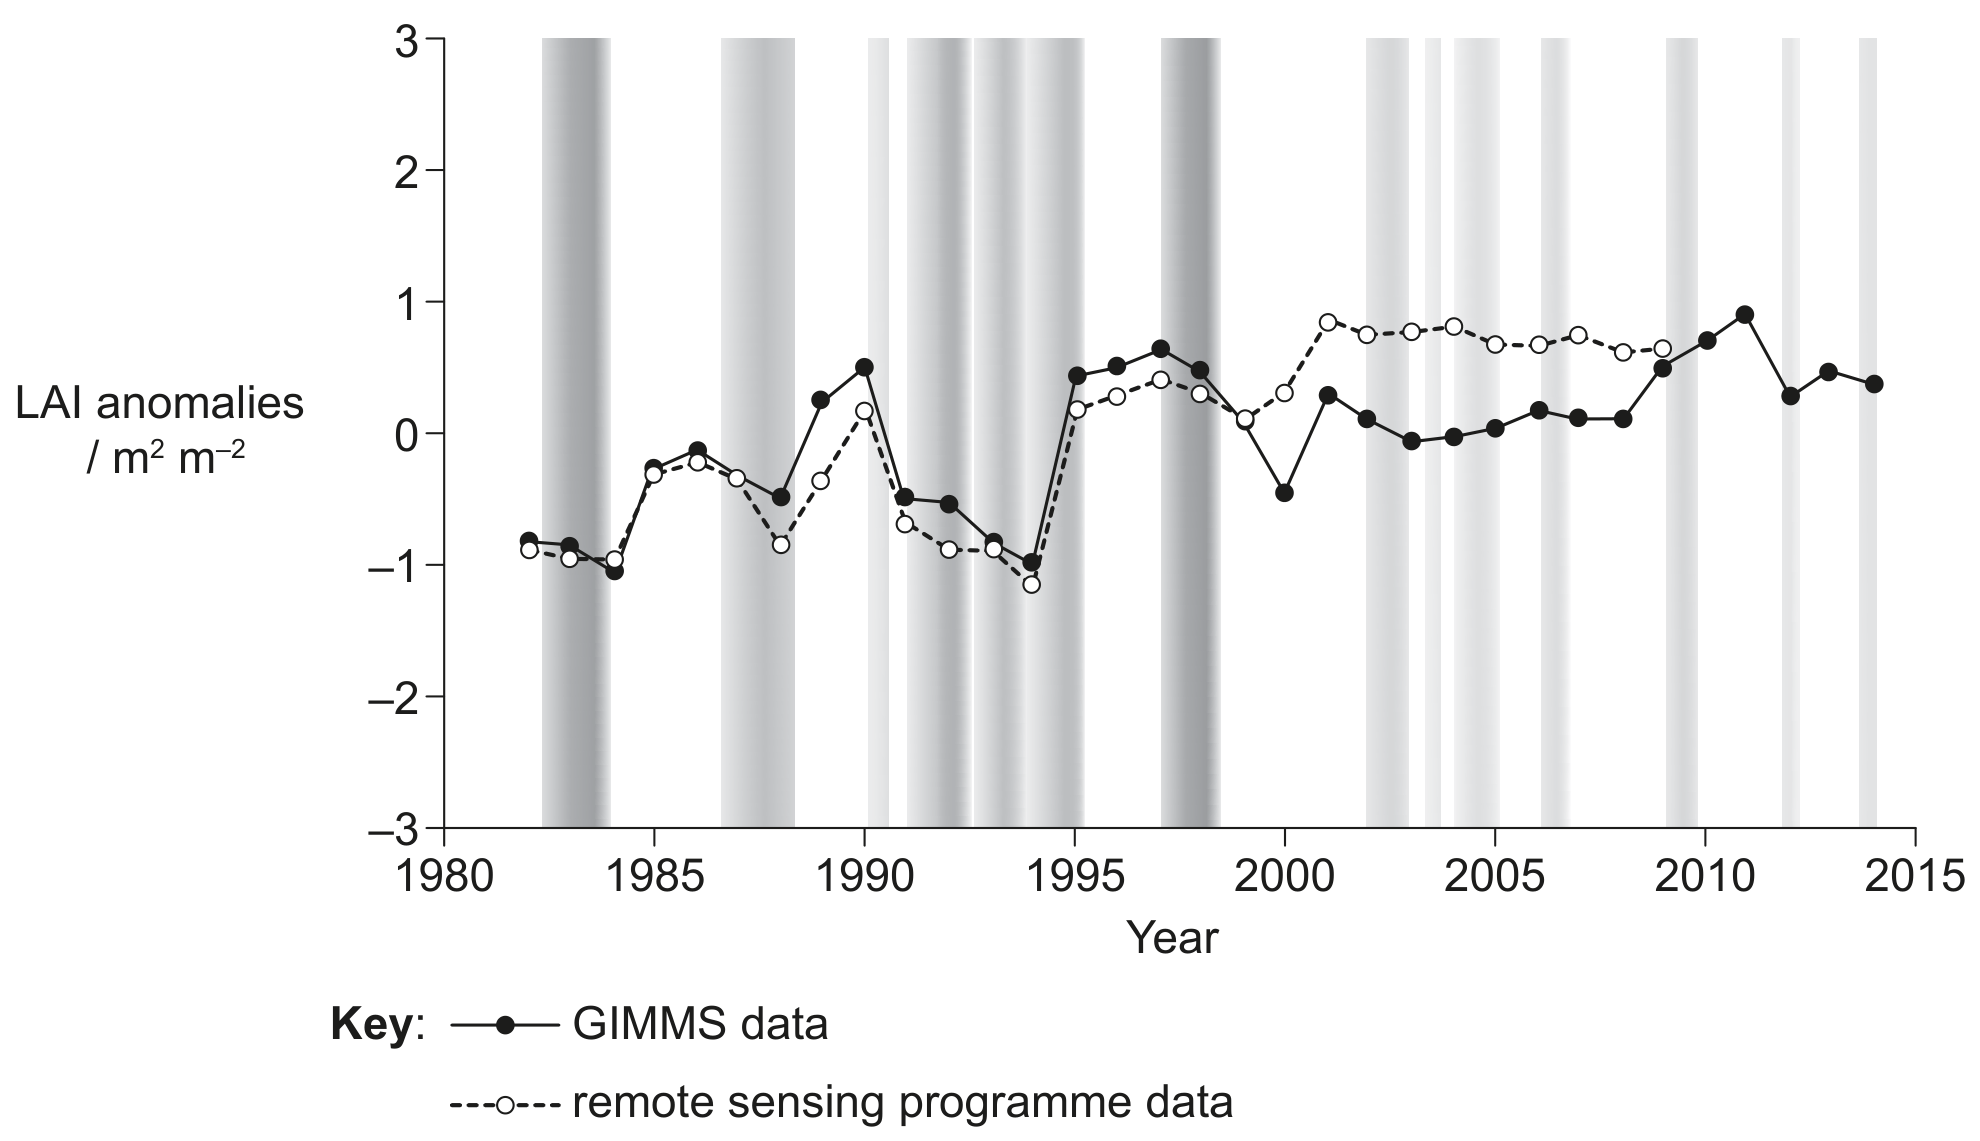
Analyse the data shown in the graph for evidence of a relationship between LAI and
El Niño events.

[ 2 ]
[Maximum number: 11]

Global warming has changed both the thickness and surface area of sea ice of the Arctic Ocean as well as the Southern Ocean that surrounds Antarctica. Sea ice is highly sensitive to changes in temperature.

Scientists have calculated a long-term mean for the surface area of sea ice in the Arctic and in the Southern Ocean around Antarctica. This mean value is used as a reference to examine changes in ice extent. The graph shows the variations from this mean (zero line) over a period of time.

Question image
(a)

State the trend in the surface area of sea ice in the Southern Ocean around Antarctica.

[ 1 ]
(b)

Distinguish between changes in the surface area of sea ice in the Arctic and Antarctica.

[ 2 ]
(c)

Describe the trends in the length of the sea ice season around the Antarctic Peninsula and in the Ross Sea.

[ 2 ]
(d)

The graphs show the changes in penguin population in three of the colonies shown on the map.

Question image

Analyse the trends in colony size of the Adélie penguins in relation to the changes in the sea ice.

[ 3 ]
(e)

Discuss the use of Adélie penguins in studying the effects of global warming.

[ 3 ]
[Maximum number: 2]

Coral reefs are among the most spectacular ecosystems on Earth. They support a rich diversity of life and provide economic benefits to the people who use them. In Papua New Guinea in the Pacific Ocean north of Australia the following data were collected. Coral cover is the percentage of the reef surface covered by live hard coral.

Question image
(a)

Suggest causes for the changes in ocean temperature.

[ 2 ]
[Maximum number: 2]

PanI is a gene in cod fish that codes for an integral membrane protein called pantophysin. Two alleles of the gene, PanIA\operatorname{PanI}{ }^{\mathrm{A}} and PanIB\operatorname{PanI}{ }^{\mathrm{B}}, code for versions of pantophysin, that differ by four amino acids in one region of the protein. Samples of cod fish were collected from 23 locations in the north Atlantic and were tested to find the proportions of PanI A{ }^{\mathrm{A}} and PanI B{ }^{\mathrm{B}} alleles in each population. The results are shown in pie charts, numbered 1-23, on the map below. The proportions of alleles in a population are called the allele frequencies. The frequency of an allele can vary from 0.0 to 1.0 . The light grey sectors of the pie charts show the allele frequency of PanI A{ }^{\mathrm{A}} and the black sectors show the allele frequency of PanI B{ }^{\mathrm{B}}.

Question image
(a)

Using the data in this question, predict the effects of global warming on cod fish populations.

[ 2 ]
[Maximum number: 2]

Bottlenose dolphins (Tursiops truncatus) inhabit almost all tropical and temperate oceans between 45N45^{\circ} \mathrm{N} and 45S45^{\circ} \mathrm{S}. Over a two-year period, aerial surveys were carried out to investigate the seasonal distribution of these animals along the mid-Atlantic and eastern coastal waters of the USA. Sightings were recorded using a global positioning system (GPS) while flying parallel to the coast approximately 500 m offshore. The diagram below shows a map of the section of coast surveyed. The bar graph shows the seasonal data for summer and winter at the corresponding latitudes ( N{ }^{\circ} \mathrm{N} ). A total of 5431 bottlenose dolphins were sighted during these surveys.

Question image
(a)

Explain how an increase in water temperature due to global warming could affect the distribution of bottlenose dolphins along the eastern coast of the USA.

[ 2 ]
[Maximum number: 6]

The black-legged tick (lxodes scapularis) is an arthropod which sucks blood from humans and other mammals. It is encountered mainly in wooded and semi-wooded areas.
Some ticks can be infected by the bacterium Borrelia burgdorferi. When a tick bites a human, the bacterium is often introduced, causing Lyme disease. Lyme disease is a public health problem in North America and, if left untreated, can cause important neurological impairment. The diagram represents the two-year life cycle of a tick.

Question image
(a)

Scientists fear that global warming will change the distribution range of ticks.
The graphs show the developmental stages of ticks throughout seasons in a densely human-populated area of south-eastern Canada, surrounded by woods (circled on the map). Values are already established for 2000 and are predicted for 2080.

Question image

Identify the month when small birds had the greatest chance of being infected by B. burgdorferi bacteria in the year 2000 and the month when they would be most likely to become infected according to the 2080 predictions.

2000:
2080:

[ 1 ]
(b)

Using the life cycle diagram and the graph for the year 2000, analyse the distribution of adult ticks throughout the different seasons.

[ 2 ]
(c)

Evaluate the effect of the change in distribution of the different life stages of ticks on the spread of Lyme disease in south-eastern Canada.

[ 3 ]
[Maximum number: 3]

Average human internal (core) body temperature is 36.4C36.4^{\circ} \mathrm{C}, with slight variations between day and night. The average surface temperature of the Earth in the 20th century was 13.9C13.9^{\circ} \mathrm{C}. It has now risen to 14.8C14.8^{\circ} \mathrm{C}.

(a)

Explain how the burning of fossil fuels has contributed to the increase in the Earth's temperature.

[ 2 ]
(b)

Melting polar ice due to global warming is reducing reflection of sunlight from the Earth. Identify with a reason whether this will result in positive or negative feedback.

[ 1 ]
[Maximum number: 7]

E1. European robins (Erithacus rubecula) migrate South in the autumn (fall) and North in the spring. They orient their direction of flight using the local magnetic field, which they detect through magnetoreceptors in the upper beak. The orientation of the birds in a captive environment was studied in spring and autumn, which are the times of year when the birds normally migrate. The response of the birds to green light, red light and total darkness was investigated. Triangles on the edge of circles indicate the mean direction flown by individual birds while the arrows indicate the overall mean direction of flight.

Question image
(a)

Identify the season and light conditions which result in the strongest northerly direction flown by the robins.
Season:
Light conditions:

[ 1 ]
(b)

Distinguish between the effect of red light and green light on the behaviour of the robins in spring and autumn (fall).

[ 2 ]
(c)

Based on the results of these experiments, suggest one possible conclusion that could be drawn regarding the effect of red light on the behaviour of robins.

[ 1 ]
(d)

Using the data in the diagram, deduce with a reason, whether European robins migrate during the daytime or at night.

[ 2 ]
(e)

Scientists anesthetized the beaks of some robins in order to deactivate the magnetoreceptors. Predict how this would affect their orientation in red light.

[ 1 ]
(a)

Explain how the following influence the enhanced greenhouse effect.

[ 3 ]
(i)

Reforestation of desert

[ 1 ]
(ii)

Change in energy source from fossil fuels to solar energy

[ 1 ]
(iii)

Increase in the production of methane

[ 1 ]
[Maximum number: 4]

The graph shows the mean annual changes in global temperatures between 1880 and 2014. The mean temperature from 1951 to 1980 was used as the value of zero change in temperature.

Question image
(a)

Calculate the increase in mean global temperature between 1880 and 2010.

[ 1 ]
(b)

Explain how increased carbon dioxide in the air leads to the greenhouse effect.

[ 3 ]
0