EduNinja
[Maximum number: 6]

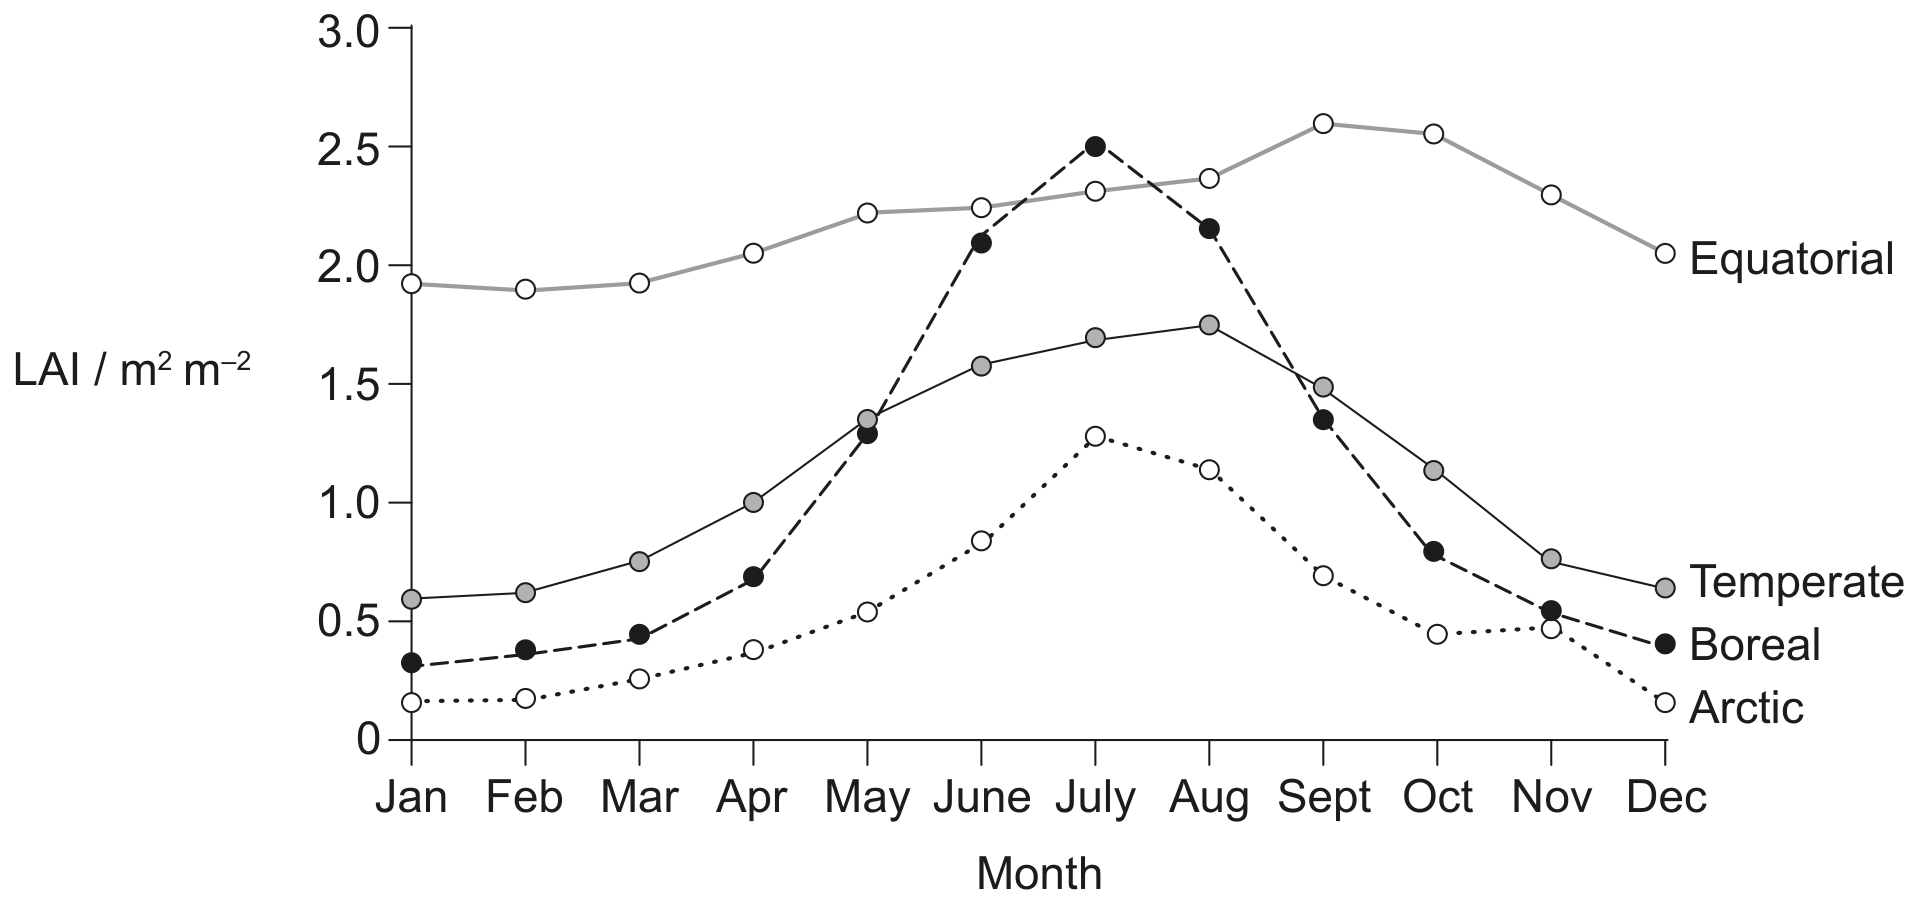
Remote sensing satellites are used to monitor the Earth's ecosystems. One measure of ecosystem status is leaf area index (LAI), which is the total area of leaves in square metres per square metre ( m2 m2\mathrm{m}^{2} \mathrm{~m}^{-2} ) of the Earth's surface. The graph shows LAI estimates, calculated using data from the Global Inventory Monitoring and Modelling System (GIMMS), during the period from 1981 to 2011. The data points are monthly averages in four latitudinal zones in the northern hemisphere.

Question image
(a)

Compare and contrast the LAI data for the arctic and temperate zones.

[ 2 ]
(b)

Suggest reasons for the differences in LAI between the boreal and equatorial zones.

[ 3 ]
(c)

The data in the graph show a long-term trend in global LAI.

[ 1 ]
(i)

State the trend.

[ 1 ]
[Maximum number: 2]

Increasing carbon dioxide concentration in the atmosphere leads to acidification of the ocean. This in turn reduces the amount of dissolved calcium carbonate. A study was undertaken to investigate the effect of increasing the concentration of atmospheric carbon dioxide on the calcification rate of marine organisms. Calcification is the uptake of calcium into the bodies and shells of marine organisms. The study was undertaken inside Biosphere-2, a large-scale closed mesocosm. The graph shows the results of the data collection.

Question image
(a)

Outline one way in which reef-building corals are affected by increasing atmospheric carbon dioxide.

[ 2 ]
[Maximum number: 2]

Coral reefs are among the most spectacular ecosystems on Earth. They support a rich diversity of life and provide economic benefits to the people who use them. In Papua New Guinea in the Pacific Ocean north of Australia the following data were collected. Coral cover is the percentage of the reef surface covered by live hard coral.

Question image
(a)

Describe the evidence that the ocean temperature has an effect on coral cover.

[ 2 ]
[Maximum number: 1]

White-nose syndrome (WNS) is a disease caused by the fungus Geomyces destructans. This kills bats from many species during their winter hibernation. Scientists used echolocation to record the number of bat flights over a station in 10 minute sample periods during the summers of 2007 to 2009. The graph shows the mean number of flights and number of recording samples for little brown bats (Myotis lucifugus), a species affected by the fungus, along with those of hoary bats (Lasiurus cinereus), which are not affected.

Question image
(a)

Distinguish between the patterns of hibernation of the uninfected and infected bats.

[ 1 ]
[Maximum number: 4]

Beavers are large rodents that live in waterways throughout the northern hemisphere. Dams made by beavers change the temperature of the streams and affect the mayfly, Baetis bicaudatus. In the summer of 2008, beaver ponds in West Brush Creek and Cement Creek, Colorado, were studied to evaluate their impacts on mayflies. The study sites included streams flowing into (upstream) and out of (downstream) each beaver pond.

Question image

Mayflies, including the species B. bicaudatus, are aquatic insects that hatch and spend their larval stages in water emerging from the water as adults. Larger females produce an increased number of better quality eggs.

(a)

Describe the effect dams have on water temperature.

[ 2 ]
(b)

The graph shows the mean dry mass of mayflies relative to the water temperature in their habitats.

Question image

Using the graph, discuss evidence for the hypothesis that mayflies grow to greater dry mass in cooler water.

[ 2 ]
[Maximum number: 4]

Arabidopsis is a small flowering plant in the mustard family (Brassicaceae) that is widely used in basic research. It has a short life cycle, flowers quickly producing a large number of seeds and is easy to cultivate. It forms a circle of leaves known as a rosette that lies close to the soil. Flowers form at the end of short stems.

Question image

A study was carried out of differences in development between Arabidopsis plants grown in long days ( 16 hours light, 8 hours dark) or short days ( 8 hours light, 16 hours dark). The sixth leaf (L6) to emerge in the rosette of each plant was used in all investigations.

New leaves are initiated by the meristem and go through four stages as they develop.
- Stage 1 (S1) - rapid cell division
- Stage 2 (S2) - cell division has ceased, cell expansion continues
- Stage 3 (S3) - decreasing cell expansion rate
- Stage 4 (S4) - leaf growth complete

The start of each stage of leaf development for plants grown in long days and short days is shown above the first graph.

Question image
Question image
(a)

Distinguish between plants grown in long days and short days in the mean number of leaves per rosette during the experimental period.

[ 2 ]
(b)

Using all relevant data in this question, deduce with reasons whether Arabidopsis is a long day plant or a short day plant in terms of flowering.

[ 2 ]
[Maximum number: 3]

White clover (Trifolium repens) is native to Eurasia but is now a common plant found worldwide in lawns, next to roads, in pastures and similar habitats.

Question image

Some T. repens plants are able to produce the toxin hydrogen cyanide (HCN) by cyanogenesis. A study at 128 sites ( 2509 plants) in Toronto (Canada) looked at the proportion of T. repens plants producing HCN. The sites were at regular intervals from the city centre towards rural areas.

Question image
(a)

The researchers then investigated a possible correlation between cyanogenesis and exposure to freezing conditions. It had been proposed that when a cyanogenic plant freezes, its cells burst, releasing HCN which is toxic to the plant. Snow can insulate the ground and plants from freezing temperatures. However, snow is more likely to melt in cities, which then exposes plants to freezing temperatures.

All four of the cities studied receive below freezing temperatures and winter snowfall. Researchers looked at the number of days below freezing (0C)\left(0^{\circ} \mathrm{C}\right) that did not have snow cover in these cities.

Question image
[ 3 ]
(i)

Identify with a reason the city where the plants were more insulated from freezing temperatures.

[ 1 ]
(ii)

Using all of the data so far, suggest whether exposure to freezing temperatures in the four cities is supported as a reason for the differences in HCN production in T. repens.

[ 2 ]
[Maximum number: 2]

A community living in the water of an estuary was used to investigate how climate change may affect ecological systems. The food web in this community included phytoplankton (producers), zooplankton (consumers) and saprotrophic bacteria. Small plastic mesocosms were set up with water from the estuary containing only these three groups of organisms. The mesocosms were subjected to four different temperatures and two nutrient levels (control and nutrients added) to replicate local variations of the conditions in the estuary during springtime warming.

The graph shows the biomass of the community for each of the eight mesocosms at the end of the experimental period. Biomass was measured in terms of the amount of carbon present. The horizontal line indicates the initial biomass.

Question image
(a)

Suggest two abiotic factors, other than temperature and nutrient supply, that may affect the production of biomass of the grasslands.

[ 2 ]
[Maximum number: 13]

Pinnipeds are marine mammals with fins or flippers and include fur seals and sea lions. Some pinnipeds forage for prey near the surface (epipelagic) while others forage on the bottom of the sea (benthic). The graph shows the foraging behaviour and the relative time spent diving while at sea for five pinniped species.

Question image
(a)

State the relative time the Australian fur seal spent diving while at sea.
\%

[ 1 ]
(b)

Using the data in the bar chart, deduce which factor has the most significant effect on the relative time spent diving while at sea.

[ 2 ]
(c)

Different species are able to store different amounts of oxygen in their muscle tissues in preparation for diving. The graph shows the relationship between typical dive duration and oxygen storage in tissues in the same five species.

Question image

State the oxygen stores for a New Zealand sea lion for a dive of 3.4 minutes.
cm3 kg1\mathrm{cm}^{3} \mathrm{~kg}^{-1}

[ 1 ]
(d)

Using the data in the graph, analyse the correlation between dive duration and oxygen stores in the different species.

[ 2 ]
(e)

In another study on the Antarctic fur seal (epipelagic), scientists measured the temperature difference between the skin of diving seals and the water at all depths of the dives. The data shown is for one fur seal during one period of dives.

Question image

Describe the variations in the

[ 4 ]
(i)

characteristics of each successive dive during the period investigated.

[ 2 ]
(ii)

difference between the temperature of the skin and the water during the period investigated.

[ 2 ]
(f)

Using the data, discuss reasons for pinnipeds diving for less than 3.5 minutes.

[ 3 ]
[Maximum number: 10]

Three-toed sloths (Bradypus variegatus) are placental mammals that live in trees in Central and South America. They eat leaves and fruit and get almost all their water from succulent plants.

Question image

Three-toed sloths change their body posture in response to the temperature of their environment (ambient temperature). Researchers assessed posture on a scale from 1 to 6 , with 1 being when the sloth was curled into a tight ball and 6 when it had all limbs spread. The percentage of time the sloths were observed in each position was recorded at ambient temperatures from 22C22^{\circ} \mathrm{C} to 34C34^{\circ} \mathrm{C}. The researchers also measured the body temperature of the sloths over the same range of ambient temperatures.

Question image

Posture

Question image
(a)
(i)

State the relationship between sloth body temperature and ambient temperature.

[ 1 ]
(ii)

Explain how this relationship differs from that in humans.

[ 1 ]
(b)
(i)

Describe the trend in body posture as ambient temperature rises from 22 to 34C34^{\circ} \mathrm{C}.

[ 1 ]
(ii)

Suggest reasons for this trend.

[ 2 ]
(c)

State how the daily energy use of the sloth differs from the trend for other mammals.

[ 1 ]
(d)

The daily food intake of three-toed sloths and daily ambient temperatures were monitored over a 160-day period from February to early July. The graphs show the mean results.

Question image

The mean daily food intake fluctuated from day to day. State the month that contains the day on which the mean intake of food was highest.

[ 1 ]
(e)

Outline the relationship between ambient daily temperature and food intake in March.

[ 2 ]
(f)

Suggest, with a reason, how the activity of the sloth varies with ambient temperature.

[ 1 ]
0