EduNinja
[Maximum number: 7]

Lead is a toxic heavy metal responsible for a range of developmental and physiological disorders in children, including behaviour and learning problems, slowed growth and anaemia. The blood lead level (BLL) is a reliable biological indicator of a child's lead exposure. Scientists of the Environmental Protection Agency (EPA) looked at all the available data to determine the pathways by which lead entered the blood of children in three age categories in the US. The chart summarizes their findings.

Question image
(a)

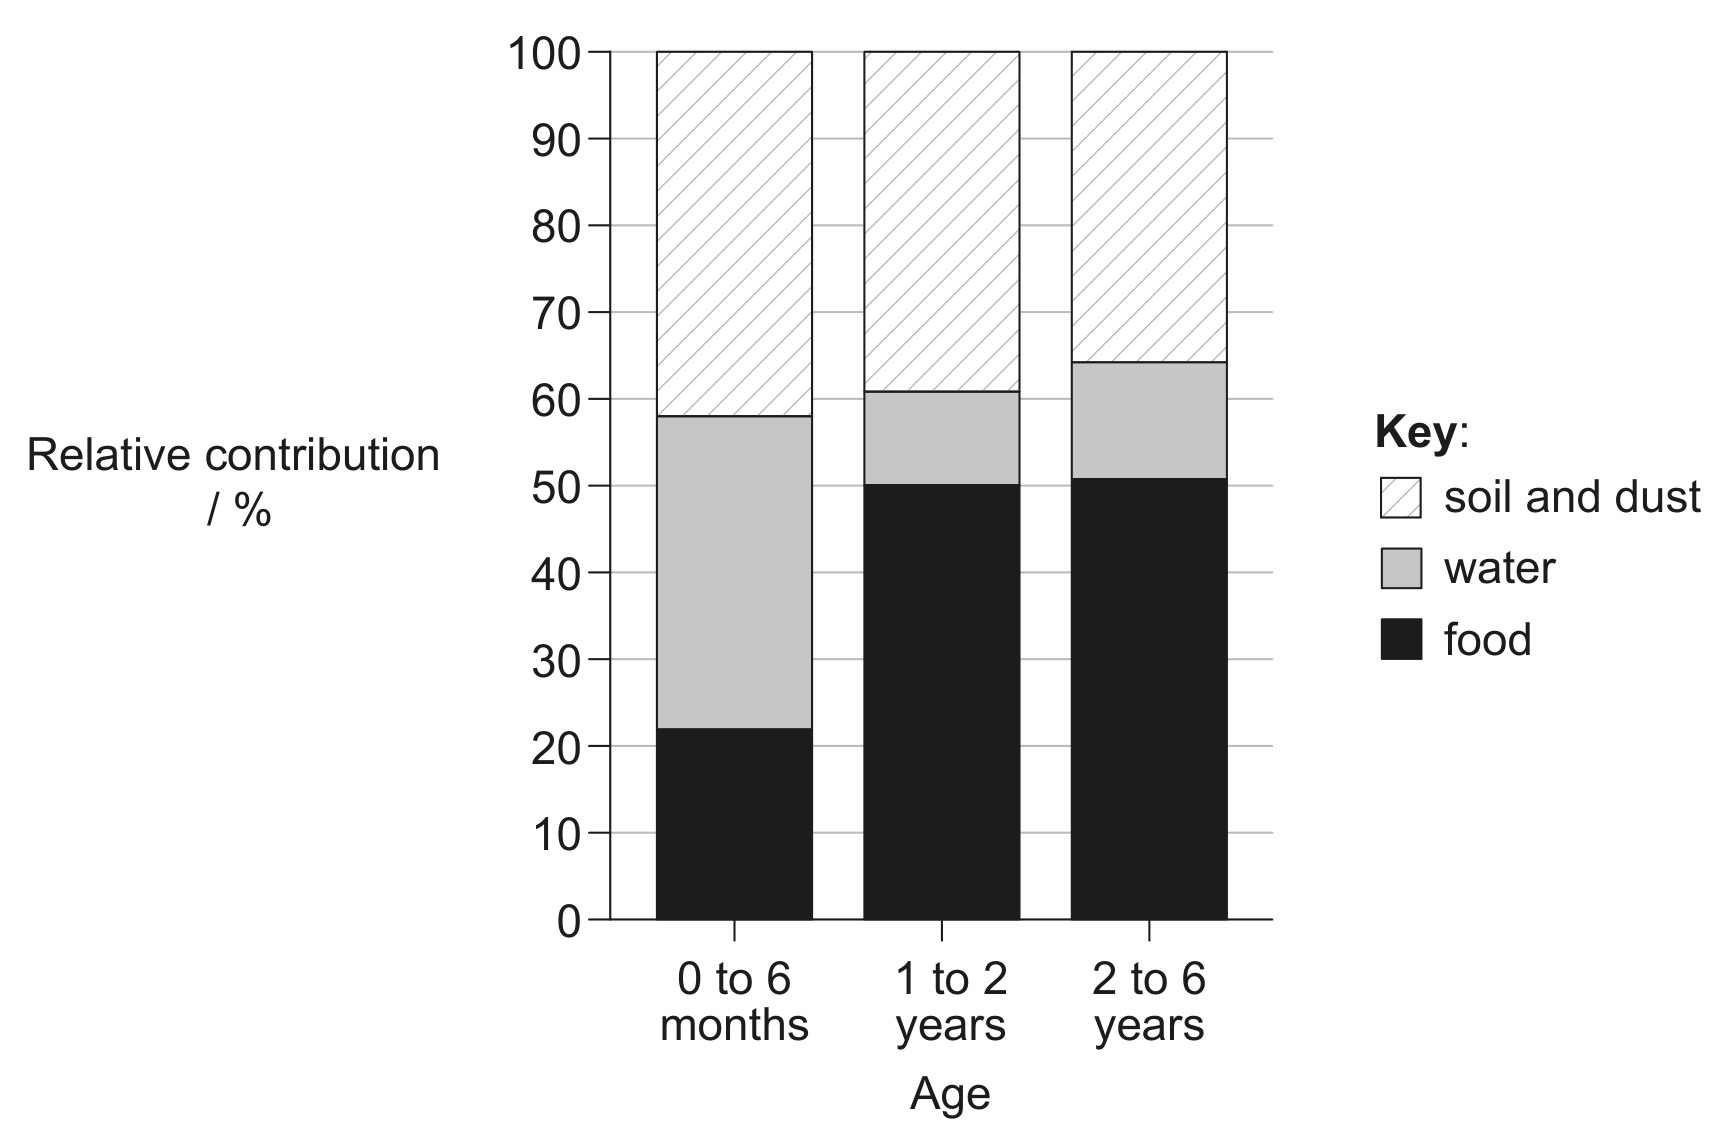
Suggest how a change in the habits of children as they grow older may affect the relative contribution of the three pathways by which lead enters the blood.

[ 1 ]
(b)

The Centers for Disease Control and Prevention (CDC) in the US recommended that children with a BLL of more than 35μ L135 \mu \mathrm{~L}^{-1} have treatment to remove lead from the blood. Outline the need for treatment for the children in both countries from 2000 onwards.

[ 2 ]
(c)

No data was recorded for heavy traffic environments from 1987 to 1996. Predict with a reason how the mean BLL for heavy traffic environments in this period would compare to the BLL for 1997 to 2006.

[ 1 ]
(d)

Using all the data, discuss the potential effect of e-waste dumping on the BLL of children.

[ 3 ]
[Maximum number: 12]

The incidence of white syndrome, an infectious disease of coral, was investigated in a six-year study on Australia's Great Barrier Reef. The map shows disease conditions on coral reefs at six study sites.

Question image
(a)
(i)

Identify the site with the highest incidence of diseased colonies.

[ 1 ]
(ii)

Deduce whether there is a trend in the incidence of white syndrome over the north-south range of latitude.

[ 1 ]
(b)

Satellites were used to record sea surface temperatures. The temperatures each week above a reef were compared with mean temperatures for that week between 1985 and 2004. If the sea surface temperature was 1C1^{\circ} \mathrm{C} or more above the mean, this was recorded as a weekly sea surface temperature anomaly (WSSTA). The number of WSSTAs was calculated for the twelve months preceding the date on which a reef was surveyed for white syndrome.

On each reef, the number of cases of white syndrome in a 1500 m21500 \mathrm{~m}^{2} sample area was surveyed once per year. The table shows these cases in relation to numbers of WSSTAs and coral cover on the reef. Low coral cover was 0-24 % and high coral cover was 50-75 %.

Question image
[ 4 ]
(i)

Describe the evidence that is provided by the data in the table for the harmful effects of rising sea temperatures on corals.

[ 2 ]
(ii)

The researchers concluded that there was a threshold coral cover percentage, below which infection rates tended to remain fairly low. Using the data in the table, identify this threshold level.

[ 1 ]
(iii)

Suggest a reason for a larger percentage of corals being infected with white syndrome on reefs with a higher cover of corals.

Weekly sea surface temperature anomalies (WSSTA)

Weekly sea surface temperature anomalies (WSSTA)

[ 1 ]
(c)

The graphs show the relationship between the weekly sea surface temperature anomalies (WSSTA) and coral cover during two twelve-month periods (1998-99 and 2002-03), which were the warmest in the six-year study. Each dot represents one studied reef.

Question image
[ 3 ]
(i)

Compare and contrast the data for 1998-1999 and 2002-2003.

[ 2 ]
(ii)

Suggest a reason for the correlation between coral cover and WSSTA in 1998-1999.

[ 1 ]
(d)

Some scientists predict that, if humans continue to produce carbon dioxide at the current rate, the pH of the oceans will become more acidic. Suggest possible effects on the coral reefs.

[ 3 ]
[Maximum number: 2]

Rice (Oryza sativa) is usually intolerant to sustained submergence under water, although it grows rapidly in height for a few days before dying. This is true for one variety, Oryza sativa japonica. The variety Oryza sativa indica is much more tolerant to submergence.

Three genetically modified forms of O. sativa japonica, GMFA, GMFB and GMFC, were made using different fragments of DNA taken from O. sativa indica.

The plants were then submerged for a period of 11 days. The heights of all the plants were measured at the beginning and at the end of the submergence period.

Question image
Question image
(a)

Evaluate, using all the data, how modified varieties of rice could be used to overcome food shortages in some countries.

[ 2 ]
[Maximum number: 1]

Ebola virus disease (EVD) is the disease in humans and other primates that is caused by the Ebola virus. Fruit bats are the reservoir for the virus and are able to spread the disease without being affected. Humans can become infected by contact with fruit bats or with people infected by the virus, their body fluids or equipment used to treat them.

The table shows data for four African countries that were affected by the 2014-2015 Ebola outbreak.

Table
(a)

Analysis of the data suggests that the number of deaths from EVD is not related to the total population size. State one piece of evidence from the data that would support this analysis.

[ 1 ]
(a)

Describe the role of the EDGE of Existence programme.

Chimpanzees and bonobos are different species of primate. It is thought that neither species can swim. The map shows the relative locations of chimpanzees and bonobos in Africa.

Question image

Evidence suggests that the level of the Congo River was lower during one period in the past. At this time, chimpanzees could have migrated across.

[ 2 ]
[Maximum number: 2]

Beavers (Castor fiber) have been reintroduced into many European countries. They cut down trees and use them as a source of food as well as for building their homes and dams.

Question image
(a)

Studies show that species richness of large invertebrates increases in the presence of beavers. Suggest reasons why biodiversity is important in an ecosystem.

[ 2 ]
[Maximum number: 1]

The dark areas of the map show the distribution of some species included in the EDGE of Existence programme.

Question image

What is the reason these species have been included in the EDGE of Existence programme?

A

They occupy similar niches threatened by invasive species.

B

Their risk of extinction is higher as they live at the edge of ecosystems.

C

Their populations are decreasing and there are few or no closely related species.

D

They are keystone species in their ecosystems.

[Maximum number: 1]

What could minimize the loss of biodiversity?

A

Increase the rate of deforestation

B

Introduce species into new environments to control predation

C

Reduce the use of renewable energy

D

Rewilding of degraded ecosystems

[Maximum number: 1]

What are causes for a global reduction in biodiversity?
I. Increase in size of towns and cities
II. Reclamation of degraded ecosystems
III. Clearance of land for agriculture

A

I and II only

B

I and III only

C

II and III only

D

I, II and III

[Maximum number: 1]

The North Island giant moa (Dinornis novaezealandiae) went extinct some time between the arrival of humans in New Zealand and the 1800s.

Question image

What do scientists believe to be the cause of this extinction?

A

Deforestation

B

New diseases

C

Competition with other megafauna

D

Overhunting

0