EduNinja
[Maximum number: 1]

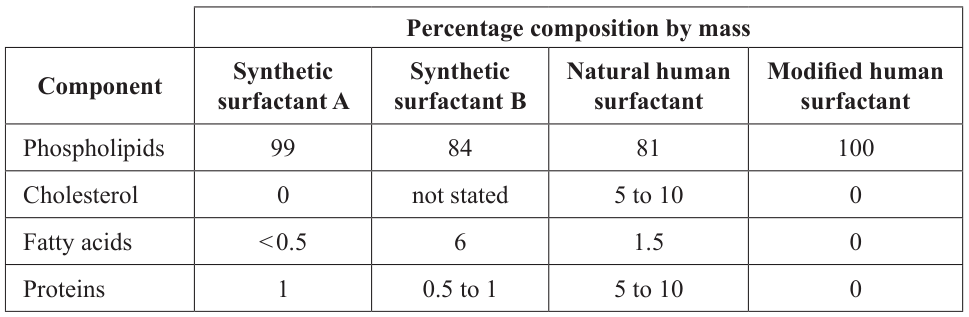
Cells in the alveolus wall produce a surfactant. Its function is to prevent alveoli collapse at the end of expiration. Surfactants are used in the treatment of respiratory system disease in premature babies.

The table shows some of the components of different surfactant preparations.

Table
(a)

State one feature of the alveoli, other than the presence of a film of moisture, that adapts them to gas exchange.

[ 1 ]
[Maximum number: 1]

To investigate the thermal properties of water, students placed hot water in two thin plastic cups and measured their rate of cooling. The sides of one cup were covered with tissue paper soaked in hot water; the other cup was left uncovered. The temperature was recorded with a thermometer every 4 minutes for 20 minutes. The temperature in the laboratory was 18C18^{\circ} \mathrm{C}.

Question image
(a)

Calculate the change in temperature in each cup after 20 minutes.

Uncovered:

Covered with wet tissue paper:

[ 1 ]
[Maximum number: 5]

Hypoxia is a condition in which tissues of the body are deprived of an adequate oxygen supply. A study was carried out in rats to examine the effects of continuing hypoxia on the structure of the diaphragm, and to determine whether nitric oxide is implicated in adaptation of the diaphragm to hypoxia. The diaphragm helps to supply oxygen to tissues and organs in the body by ventilating the lungs.

A group of 36 adult male rats were kept for 6 weeks in low oxygen while 36 adult male rats were kept in normal oxygen levels.

Question image
(a)

Using the data so far presented in this question, explain the effect of hypoxia on the body.

[ 2 ]
(b)

Using all relevant data in the question, evaluate the effectiveness of the rats' adaptation to hypoxia.

[ 3 ]
[Maximum number: 4]

A study was carried out to explore the impact of various sports on pulmonary functions in professional athletes.

The forced vital capacity (FVC) is the maximum volume of air a person can expel from the lungs after full inspiration. Forced expiratory volume in one second (FEV) is the volume of air that can forcibly be blown out in one second, after full inspiration.

The table below summarizes the mean results for the different sports including the standard deviation.

Removed for copyright reasons

(a)
(i)

State one type of apparatus that could be used to measure lung capacity.

[ 1 ]
(ii)

Outline how the FVC could be measured using the apparatus in (a)(i).

[ 2 ]
(b)

147 professional athletes and 30 non-athletes were included in the study. State one variable that had to be controlled in this experiment.

[ 1 ]
[Maximum number: 3]

The Chinese soft-shelled turtle, Pelodiscus sinensis, lives in salt water marshes. The turtle can live under water and out of water.

These turtles have fully developed lungs and kidneys, however, many microvilli have been discovered in the mouth of P. sinensis. A study was undertaken to test the hypothesis that oxygen uptake and urea excretion can simultaneously occur in the mouth.

Initial experiments involved collecting nitrogen excretion data from P. sinensis. The turtle urinates both in water and out of water. When in water it allows waste products to be washed out of its mouth. When out of water it regularly dips its head into shallow water to wash its mouth. The table shows the mean rates of ammonia and urea excretion from the mouth and kidney over six days.

Table
(a)

It was noted that during long periods out of water, turtles rhythmically moved their mouths to take in water from a shallow source and then discharge it. Changes in the dissolved oxygen and the quantity of accumulated urea in the rinse water discharged by the turtles were monitored over time as shown in this graph.

Question image
[ 3 ]
(i)

Describe the trends shown by the graph for dissolved oxygen in water discharged from the mouth.

[ 1 ]
(ii)

Suggest reasons for these trends in dissolved oxygen.

In order to test whether a urea transporter was present in the mouth tissues of the turtles, phloretin (a known inhibitor of membrane proteins that transport urea) was added to the water in which a further set of turtles submerged their heads. The results of that treatment are shown.

Question image
[ 2 ]
[Maximum number: 4]

Measurements of the lung capacity of a student were recorded using a spirometer and displayed with a data logger. Initially the student was at rest, then changed to carrying out strenuous exercise. The results are displayed in the graph.

Question image
(a)

Calculate the ventilation rate at rest, giving the units.

[ 1 ]
(b)

Explain the changes in ventilation after 35 seconds.

[ 2 ]
(c)

Suggest how the total lung volume at rest would differ for a patient with emphysema.

[ 1 ]
[Maximum number: 1]

The drawing shows part of a Thunbergia grandiflora plant. It has been widely cultivated as an ornamental garden plant.

Question image
(a)

The drawing shows a section through a T. grandiflora flower, which contains a honeybee (Apis mellifera).

Question image
[ 1 ]
(i)

Identify the structure labelled X .

[ 1 ]
[Maximum number: 3]

The stomatal density is the number of stomata per area of leaf epidermis. A study was done on the stomatal density of the lower epidermis of leaves from Protium decandrum, a tree found in the Amazon forest.

The image shows the epidermis stripped from the lower surface of a leaf.

Question image
(a)

Calculate the magnification of the image, showing your working.

[ 2 ]
(b)

The mean stomatal density for the lower epidermis of P. decandrum was around 600 per mm2\mathrm{mm}^{2}. Predict how the stomatal density for the upper epidermis would compare.

[ 1 ]
[Maximum number: 5]

Increases in the frequency and severity of drought are part of climate change in many areas of the world. Drought represents one of the major threats to food security as it can drastically decrease crop yield.

Water stress occurs when the demand for water exceeds its availability. A water stress index of 0.0 indicates non-water-stressed plants with normal transpiration and 1.0 is maximum water stress with much less transpiration.

(a)

Define transpiration.

A study was carried out on sorghum (Sorghum bicolor), an important cereal crop. The sorghum plants were grown for 15 weeks after the date of planting. Flowering occurred in week 9 . There were 3 treatment groups in the study:
- Control: plants were watered throughout the study
- Pre-flowering drought: no water until week 9, followed by normal watering
- Post-flowering drought: normal amounts of water until week 9, but none after.

Removed for copyright reasons

[ 1 ]
(b)
(i)

Compare the changes in water stress of the pre- and post-flowering drought plants over the period shown on the graph.

[ 2 ]
(ii)

Using the data, evaluate the hypothesis that sorghum plants are more vulnerable to drought after flowering.

It was known that plant growth under certain drought conditions is intimately linked to microbial communities in the root and in the soil around the root. The scientists took samples from both the root and soil, identified the bacterial phyla present and classified them into two groups: Gram-positive and Gram-negative bacteria.

The graph shows the abundance in the root of the three most common Gram-positive phyla, a, b and c , and the three most common Gram-negative phyla, d , e and f , found at week 8 (before flowering), under control conditions and pre-flowering drought conditions.

[ 2 ]
[Maximum number: 5]

Phytoremediation is the use of plants to extract and remove contaminants or lower their bioavailability (amount available to organisms) in soil. Tree species are used because they have deep root systems and fast growth rates that enable them to take up contaminants in larger amounts than plants such as grasses. The diagram shows the steps in phytoremediation in plants.

Question image

A study in North Carolina, USA, used different tree species for phytoremediation of groundwater contaminated by leaked petrochemicals. Four types of hybrid poplar clones (Populus sp.), loblolly pine (Pinus taeda) and willow (Salix sp.) were planted from 2006 to 2008, and measurements were made of trees in 2010 and 2012. The graph shows percent survival of hybrid poplar clones, loblolly pine and willow trees on the phytoremediation site.

Question image
(a)

State the relationship between fuel concentration and transpiration rate in the hybrid poplar clone OP-367.

[ 1 ]
(b)

Compare and contrast the effect of fuel concentration on the hybrid poplar clone OP-367 and willow cuttings.

[ 2 ]
(c)

Explain the difference in results for immersed cuttings and leafless control.

[ 2 ]
0