EduNinja
[Maximum number: 7]

Rice (Oryza sativa) is usually intolerant to sustained submergence under water, although it grows rapidly in height for a few days before dying. This is true for one variety, Oryza sativa japonica. The variety Oryza sativa indica is much more tolerant to submergence.

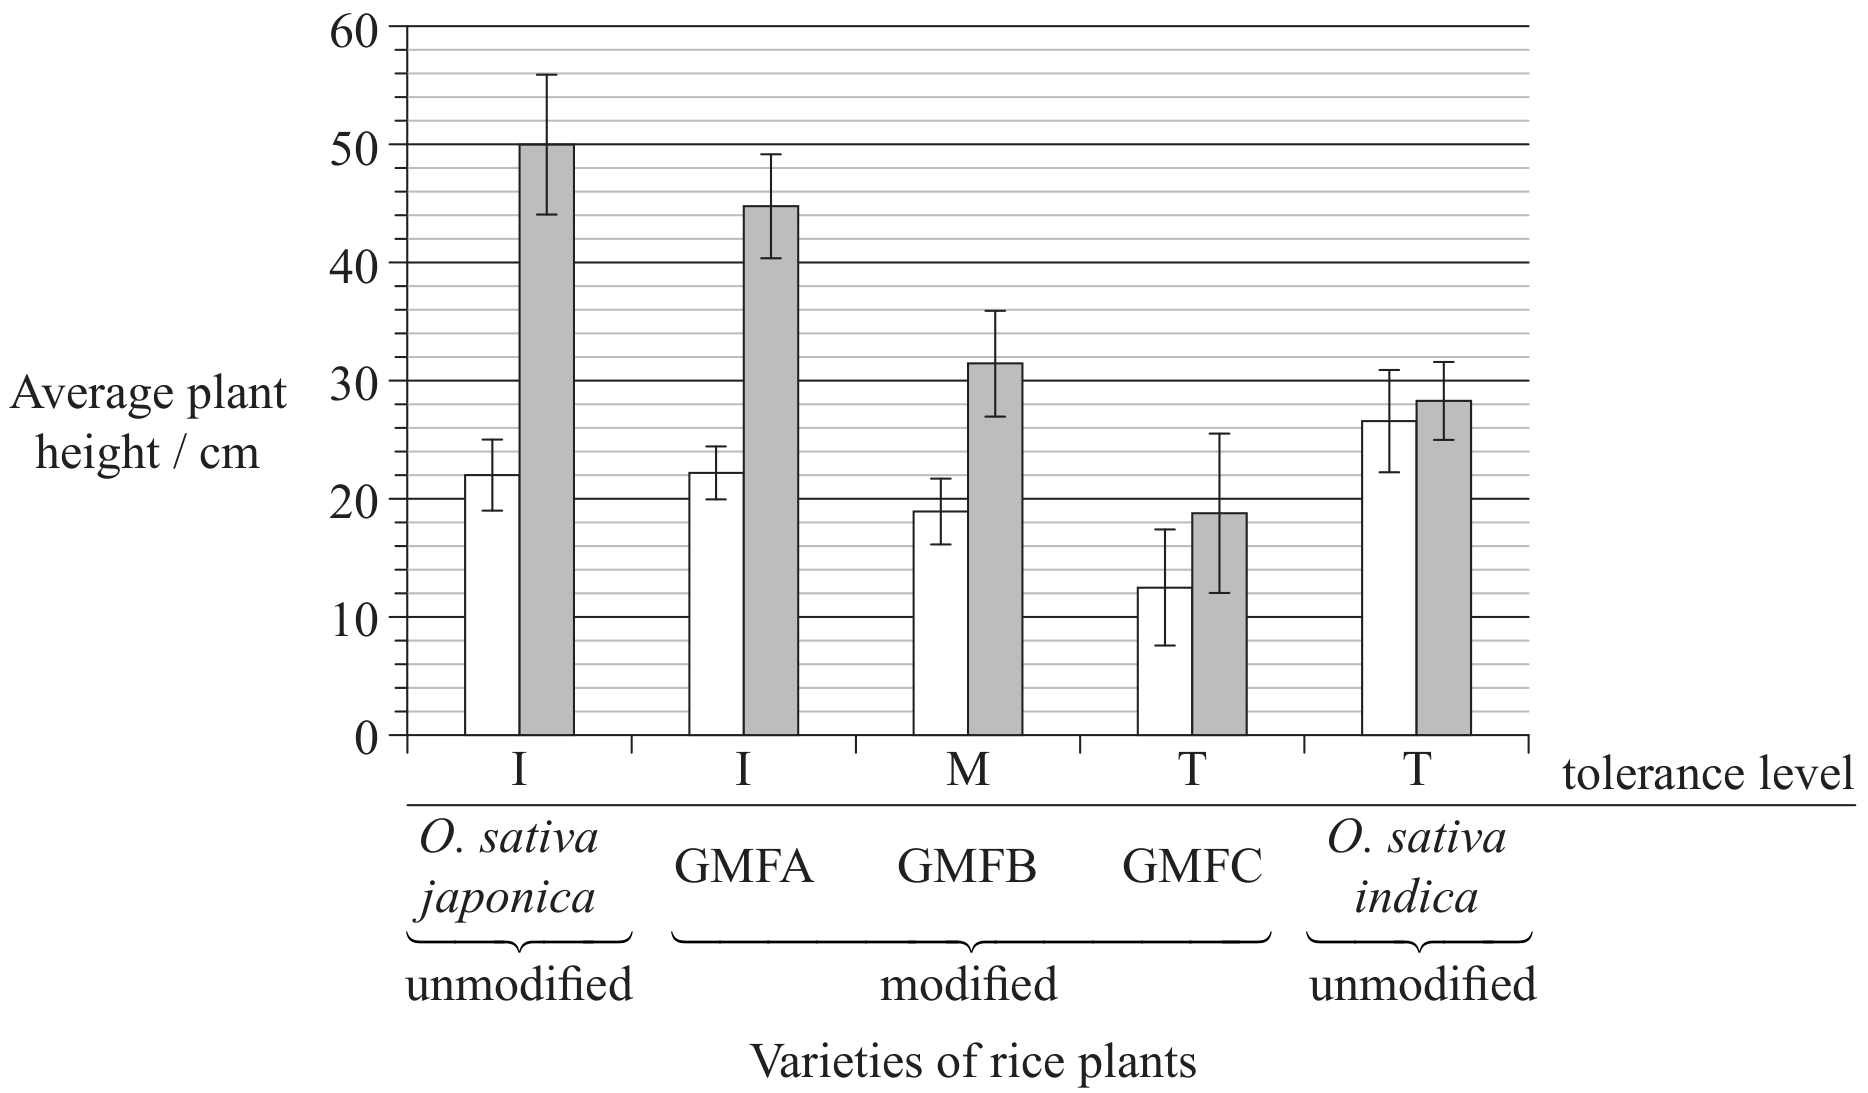
Three genetically modified forms of O. sativa japonica, GMFA, GMFB and GMFC, were made using different fragments of DNA taken from O. sativa indica.

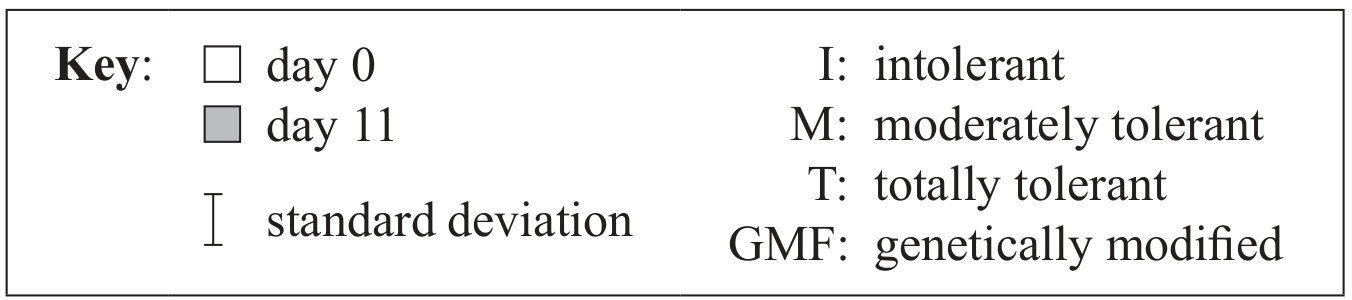
The plants were then submerged for a period of 11 days. The heights of all the plants were measured at the beginning and at the end of the submergence period.

Question image
Question image
(a)

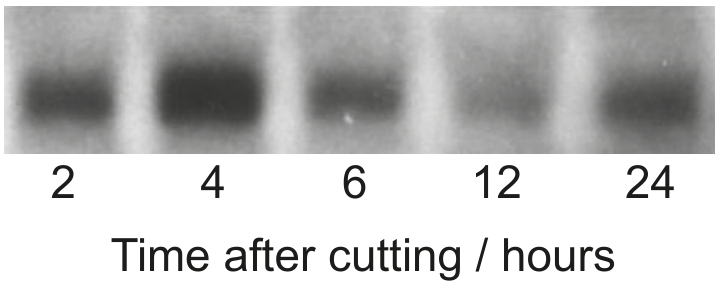
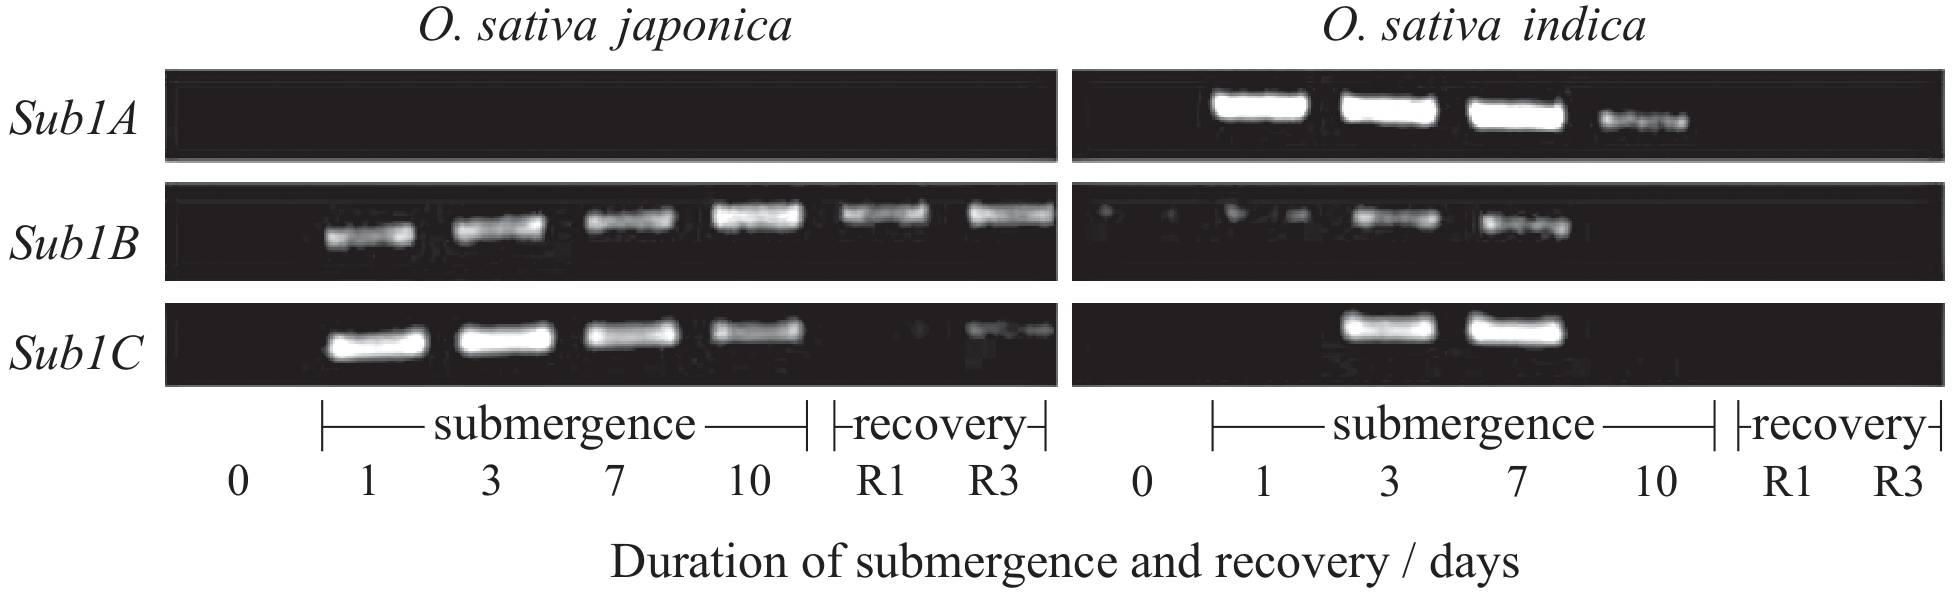
In the same experiment, the researchers hypothesized that the capacity to survive when submerged is related to the presence of three genes very close to each other on rice chromosome number 9; these genes were named Sub1A, Sub1B and Sub1C. The photograph below of part of a gel shows relative amounts of messenger RNA produced from these three genes by the submergence-intolerant variety, O. sativa japonica, and by the submergence-tolerant variety, O. sativa indica, at different times of a submergence period, followed by a recovery period out of water.

Question image
[ 5 ]
(i)

Determine which gene produced the most mRNA on the first day of the submergence period for variety O. sativa japonica.

[ 1 ]
(ii)

Outline the difference in mRNA production for the three genes during the submergence period for variety O. sativa indica.

[ 2 ]
(iii)

Compare the mRNA production for the three genes during the submergence period between the two varieties.

[ 2 ]
(b)

Deduce, using all the data, which gene was used to modify GMFC.

[ 2 ]
[Maximum number: 4]

Obesity (excessive weight) is recognized as a global health problem and has been correlated with a large number of health issues, diseases and deaths. The increased consumption of fructose, now widely used as a sweetener, has been associated with the increase in obesity.

In a study, mice were divided into four groups. Each group was given the same amount of food and either a soft drink with a different sweetener or water.

Question image
(a)

Studies investigated the role of glucose and fructose in the development of pancreatic cancer cells. Pancreatic cancer cells were grown in equal concentrations of each sugar and the uptake of each into ribose-producing pathways was measured. The graph shows the range of uptake of sugars and the mean value.

Question image

Discuss whether the results provide clear evidence of a difference in uptake.

[ 2 ]
(b)

Suggest how sugar uptake might be related to pancreatic cancer.

[ 2 ]
[Maximum number: 2]

Type I diabetes is a leading cause of death in advanced countries and is associated with various severe or fatal complications, including blindness, kidney failure, heart disease, stroke, neuropathy, and amputations. Embryonic stem cells are considered to be a powerful tool in the treatment of diabetes.

In a study, embryonic stem cells were grown in culture and tested for insulin mRNA. A drug was injected into two groups of healthy mice in order to simulate type I diabetes 15 days prior to the transplant of embryonic stem cells. The mice in the transplant group received embryonic stem cells that produce insulin mRNA. The control group did not receive the transplant. The graph shows the blood glucose concentration in both groups.

Question image
(a)

Insulin is produced by cutting C -peptide from the precursor molecule proinsulin. Suggest why group 1 has a greater level of C-peptide than group 2.

[ 2 ]
[Maximum number: 5]

Auxin can be used to promote the development of roots from stem and leafy cuttings in some plants. In a study into the distribution of auxin in the development of these roots, scientists measured the amount of auxin in different leaves of a shoot tip of Petunia hybrida.

The figure indicates the numbering of leaves on the shoot, from L1 as the youngest and smallest to L6 as the largest and oldest leaf. The developmental stage of L5 and L6 was very similar, so L5 was not analysed. The stem base is the lowest part of the cutting where roots may form.

Question image

The graph shows the auxin concentration in the different leaves.

Question image
(a)

The scientists wanted to know whether the accumulation of auxin over time in the stem base of the controls affected expression of the GH3 gene, known to have a role in growth regulation in different plants. The technique that was used to quantify the level of transcription of the GH3 gene was Northern blotting. In this procedure the darkness and thickness of the band is an indicator of the level of transcription of a particular gene. The image shows the result of the Northern blot from 2 hours to 24 hours after cutting.

Question image
[ 5 ]
(i)

State the name of the molecule which is produced by transcription.

[ 1 ]
(ii)

Compare the pattern of GH3 transcription with the pattern of auxin concentration in the stem base control cuttings. You may use the table provided to help you to record the patterns before you compare them. (Please note: a simple comparison in the table will not gain marks)

Table
[ 2 ]
(iii)

The scientists concluded that auxin activates the transcription of the GH 3 gene. Using the information on the auxin concentration in the stem base in the graph on page 4 and the Northern blot, evaluate whether this conclusion is supported.

[ 2 ]
[Maximum number: 2]

The Chinese soft-shelled turtle, Pelodiscus sinensis, lives in salt water marshes. The turtle can live under water and out of water.

These turtles have fully developed lungs and kidneys, however, many microvilli have been discovered in the mouth of P. sinensis. A study was undertaken to test the hypothesis that oxygen uptake and urea excretion can simultaneously occur in the mouth.

Initial experiments involved collecting nitrogen excretion data from P. sinensis. The turtle urinates both in water and out of water. When in water it allows waste products to be washed out of its mouth. When out of water it regularly dips its head into shallow water to wash its mouth. The table shows the mean rates of ammonia and urea excretion from the mouth and kidney over six days.

Table
(a)

Further research was conducted to determine where mRNA expression of a urea transporter gene might be occurring in P. sinensis. Gel electrophoresis was used to analyse different tissue samples for mRNA activity.

Question image

Outline the additional evidence provided by the gel electrophoresis results shown above.

[ 2 ]
[Maximum number: 1]

Organisms often release chemicals when attacked as part of their defence system. Scientists studied lima bean plants (Phaseolus lunatus) infested with either an armyworm, Spodoptera exigua, or a herbivorous mite, Tetranychus urticae. Both organisms feed on lima bean leaves, causing the leaves to release chemicals.

Question image

The study was conducted to see which defence chemicals were produced by lima bean leaves when infested by armyworms or herbivorous mites. The scientists identified a mixture of compounds ( C ) released by the plant when attacked. Two of the chemicals in this mixture were identified (C1 and C2).

The scientists hypothesized that the defence chemicals in C act as signals to produce other chemicals ( X, Y and Z ) that are also involved in the defence of the plant.

The graphs show the amounts of chemicals X, Y and Z produced when the plants were infested by either one of the two herbivores or treated with the different chemicals C1 or C2.

Question image
(a)

The scientists then used the transcribed DNA of each treatment to study the activation of three genes of the plants' defence system. The DNA was separated by gel electrophoresis. The activation was tested one hour after treatment and again after 24 hours.

Gene 3

Gene 3

Deduce, with a reason, which gene is first transcribed when exposed to C2.

[ 1 ]
[Maximum number: 1]

Where in the cell do condensation reactions involving amino acids occur?

A

Nucleus

B

Golgi apparatus

C

Ribosomes

D

Lysosome

[Maximum number: 1]

This is a sequence of nucleotides from a section of mRNA.
AUGAAACGCACGCAG
From which DNA sequence has it been transcribed?

A

ATGAAACGCACGCAG

B

UACUUUGCGUGCGAC

C

TACUUUGCGTGCGTC

D

TACTTTGCGTGCGTC

[Maximum number: 1]

The table shows information on the genetic code of four different mRNA sequences. Which sequence demonstrates degeneracy in the genetic code?

mRNA sequence

Amino acids

UUU UUA UCU

Phe Leu Ser

CUU CCU CUU

Leu Pro Leu

AUG ACG AAG

Met Thr Lys

GUU GGU GUG

Val Gly Val

[Maximum number: 1]

What occurs during translation?
I. Polypeptides synthesised on ribosomes
II. RNA polymerase catalyses polypeptide synthesis
III. Complementary base pairing between codons and anticodons

A

I and II only

B

I and III only

C

II and III only

D

I, II and III

0