EduNinja
[Maximum number: 3]

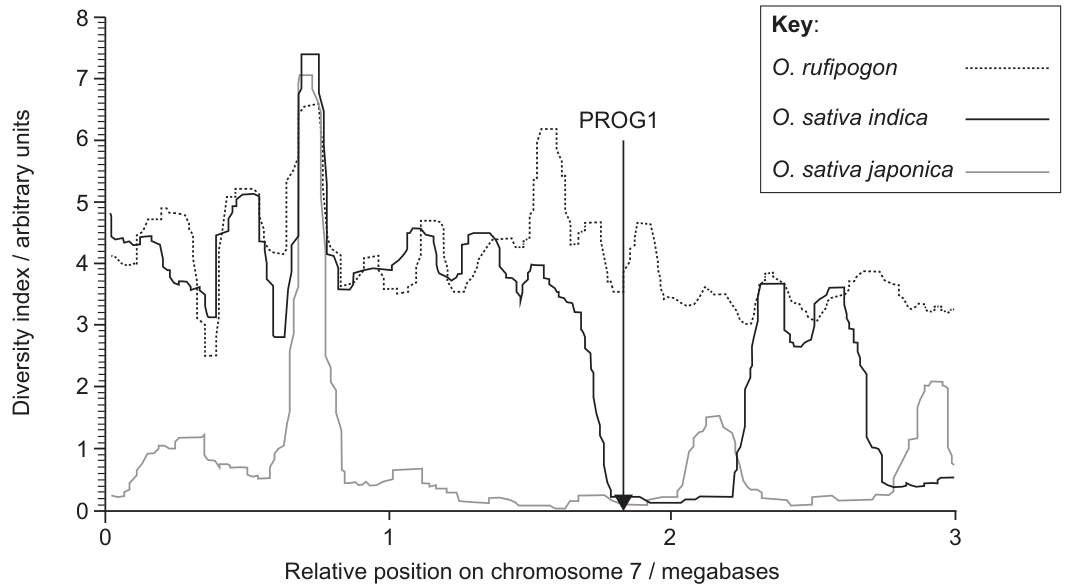
Rice (Oryza sativa) is usually intolerant to sustained submergence under water, although it grows rapidly in height for a few days before dying. This is true for one variety, Oryza sativa japonica. The variety Oryza sativa indica is much more tolerant to submergence.

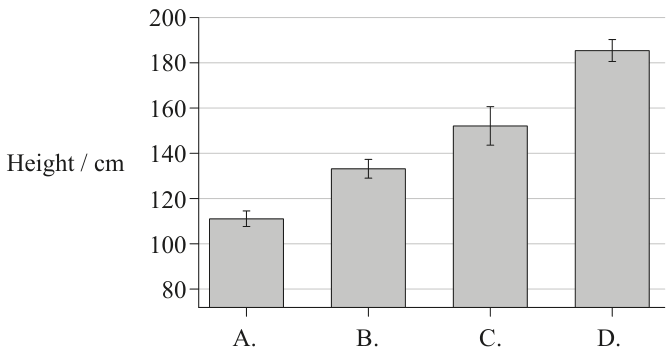
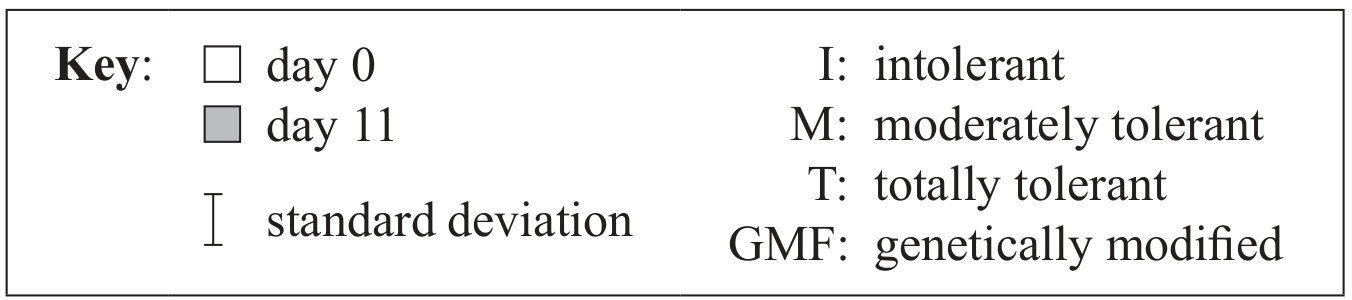
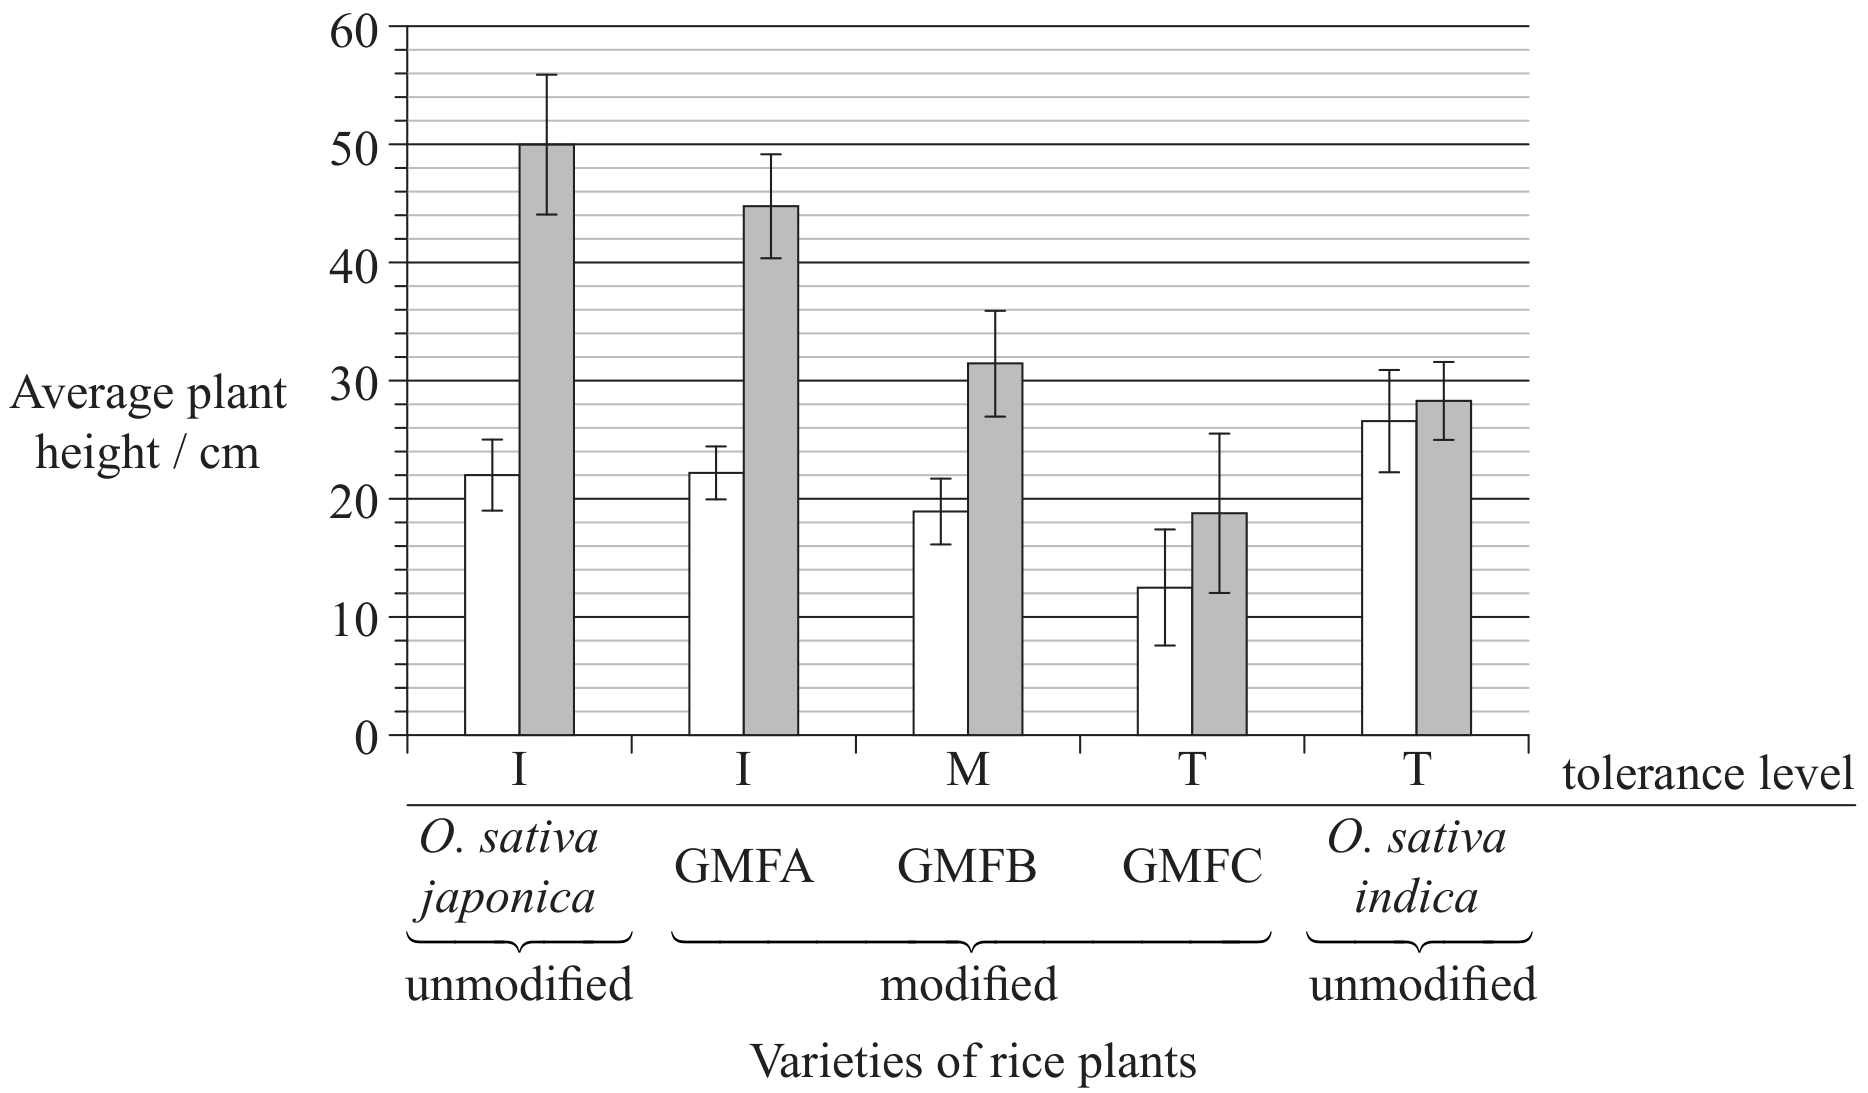
Three genetically modified forms of O. sativa japonica, GMFA, GMFB and GMFC, were made using different fragments of DNA taken from O. sativa indica.

The plants were then submerged for a period of 11 days. The heights of all the plants were measured at the beginning and at the end of the submergence period.

Question image
Question image
(a)
(i)

State which group of rice plants were the shortest at the beginning of the experiment.

[ 1 ]
(b)

Outline the use of the binomial system of nomenclature in Oryza sativa.

[ 2 ]
[Maximum number: 2]

Analysis of the genome of primates reveals many DNA segments that have been duplicated. It is possible to deduce the stage in evolution at which segmental duplications (SDs) occurred by comparing human and other primate genomes. Human-specific SDs occurred after humans and chimpanzees diverged. Human-chimpanzee shared SDs occurred after the common human-chimpanzee ancestor diverged from gorillas and so on. It is possible to estimate the rates at which SDs occurred during evolution using knowledge of when the primates changed. In the chart the bars indicate numbers of shared SDs and the line shows estimates of the rate of SDs per millions of years (Myr).

Question image
(a)
(i)

State the number of SDs that can be found in humans but not in other primates.

[ 1 ]
(ii)

State the rate of SDs after the divergence of macaques from the other primates, giving the units.

[ 1 ]
[Maximum number: 2]

Around 30000 species of vertebrate animals with four limbs (tetrapods) are found today. They are thought to have evolved from a single amphibian species that crawled on to land around 400 million years ago during the Devonian geological period. The graph shows how the number of families of tetrapod species varied in each geological period since their first appearance.

Question image
(a)

Calculate how many families of mammal were present five million years ago.

[ 1 ]
(b)

Suggest how scientists collected the data about the numbers of families.

[ 1 ]

Which population group has the greatest variation in height?

Age group

Age group

[Maximum number: 1]

Researchers investigating human evolution recorded energy use for the brain, gastrointestinal tract (gut), liver, kidneys and heart as a percentage of total energy used in the human body. They found that these organs use around 70 % of the body's energy although they account for only about 7 % of body mass. They also compared the mass of each of these organs in humans with other modern primates, each with a body mass of 65 kg as shown in the bar chart.

Table
Question image
(a)

Calculate the percentage of the total body mass made up by the human brain.

[ 1 ]
[Maximum number: 4]

The evolution of increased body size in mammals has been accompanied by an increase in life span. Another variable that could affect life span is brain size. Data was analysed from 47 mammalian species.

Question image
(a)

Identify the group with the widest range of brain mass.

[ 1 ]
(b)

Compare the brain mass and life span of primates and marsupials.

[ 3 ]
[Maximum number: 7]

There are many closely related Canis species in North America including the grey wolf (C. lupus), eastern wolf (C. lycaon) and western coyote (C. latrans). Hybridization can occur between members of these species.
For example, during the last 100 years, hybridization has occurred between western coyotes (C. latrans) and eastern wolves (C. lycaon) in the area of Ontario shown by a star in the map shown below.
Genetic evidence for hybridization is based on identification of haplotypes (combinations of linked alleles in clusters of similar genes) that exist in mitochondrial DNA (mtDNA) of Canis populations. The populations in this study were the Minnesota-northwestern wolf, southern Ontario coyote and northeastern coyote. Assume that all animals in each Canis population have the same mtDNA haplotypes.
Key:
Pie charts show the general locations and proportions of mtDNA haplotypes found in the populations.

Question image
(a)

Outline the genetic evidence that Canis populations have hybridized.

[ 2 ]
(b)

Compare the genetic data for southern Ontario coyotes and northeastern coyotes.

[ 2 ]
(c)

State with a reason whether the genetic evidence shows that the western coyote and the grey wolf have overlapping ranges.

[ 1 ]
(d)

Discuss briefly whether there is genetic evidence to show a common ancestor for the Minnesota-northwestern wolf, the southern Ontario coyote and the northeastern coyote.

[ 2 ]
[Maximum number: 2]

Ebola virus disease (EVD) is the disease in humans and other primates that is caused by the Ebola virus. Fruit bats are the reservoir for the virus and are able to spread the disease without being affected. Humans can become infected by contact with fruit bats or with people infected by the virus, their body fluids or equipment used to treat them.

The table shows data for four African countries that were affected by the 2014-2015 Ebola outbreak.

Table
(a)

Identify the country with

[ 2 ]
(i)

the largest number of Ebola cases.

[ 1 ]
(ii)

the largest number of deaths.

[ 1 ]
[Maximum number: 8]

Cultivated rice, Oryza sativa, is one of the most important human foods. The two main sub-species of cultivated rice are O. sativa indica and O. sativa japonica. O. rufipogon is a wild species from which they probably evolved.

(a)

State the reason that O. sativa and O. rufipogon are classified as different species.

[ 1 ]
(b)

To investigate whether the sub-species of cultivated rice evolved independently from the wild species, scientists analysed their chromosomes to find areas with similar DNA base sequences. Wild species tend to have many different alleles of genes present on each chromosome, but during the development of a crop plant by artificial selection from a wild species, this diversity drops considerably, increasing the base sequence similarity.
The number of different alleles of the genes on a chromosome can be represented by a diversity index. The following graph of part of chromosome 7 shows the diversity index of O. rufipogon and two varieties of cultivated rice, O. sativa indica and O. sativa japonica. The gene PROG1 allows the plant to stand upright, which is typical of cultivated rice. Its position is indicated by the vertical arrow on the graph.

Question image

Determine which type of rice has the lowest overall diversity index.

[ 1 ]
(c)

Compare and contrast the trends for O. rufipogon and O. sativa indica.

[ 2 ]
(d)

In another experiment, scientists retrieved genome sequences of the wild rice O. rufipogon taken from a wide range of geographical sites (I, II and III) and those of the two sub-species of O. sativa from gene banks.

The pie charts, presented along with a cladogram, show the proportion of alleles for three genes which confer specific characteristics to O . sativa. Mutations can produce derived alleles that are different from the original ancestral alleles. The control group represents wild rice species other than O. rufipogon.

Question image

State the proportion of the ancestral allele for the gene GS3 in the O. rufipogon-III population.

[ 1 ]
(e)

Distinguish between the proportion of ancestral and derived alleles for all three genes in O. sativa indica and O. sativa japonica.

[ 2 ]
(f)

State one reason for having a control group.

[ 1 ]
[Maximum number: 5]

The diagram shows the range of heights and brain sizes found in four groups of hominids.

Question image
(a)

State the range in brain size of H. erectus.

[ 1 ]
(b)

Distinguish between the characteristics of the Australopithecus and H. erectus using the data.

[ 2 ]
(c)

State two ways, apart from brain volume, by which the skulls of the Australopithecus and H. erectus would differ in appearance.
1.
2.

[ 2 ]
0