C4.2.15—Primary production
Primary production explains how energy flow, matter cycling, trophic transfer or carbon movement is represented, measured or limited within ecosystems.
- Syllabus
- First assessment 2025
- Objective
- C4.2.15
- Level
- HL
Primary production explains how energy flow, matter cycling, trophic transfer or carbon movement is represented, measured or limited within ecosystems.
Coverage 2012–2023 · Updated 16 Jul 2026
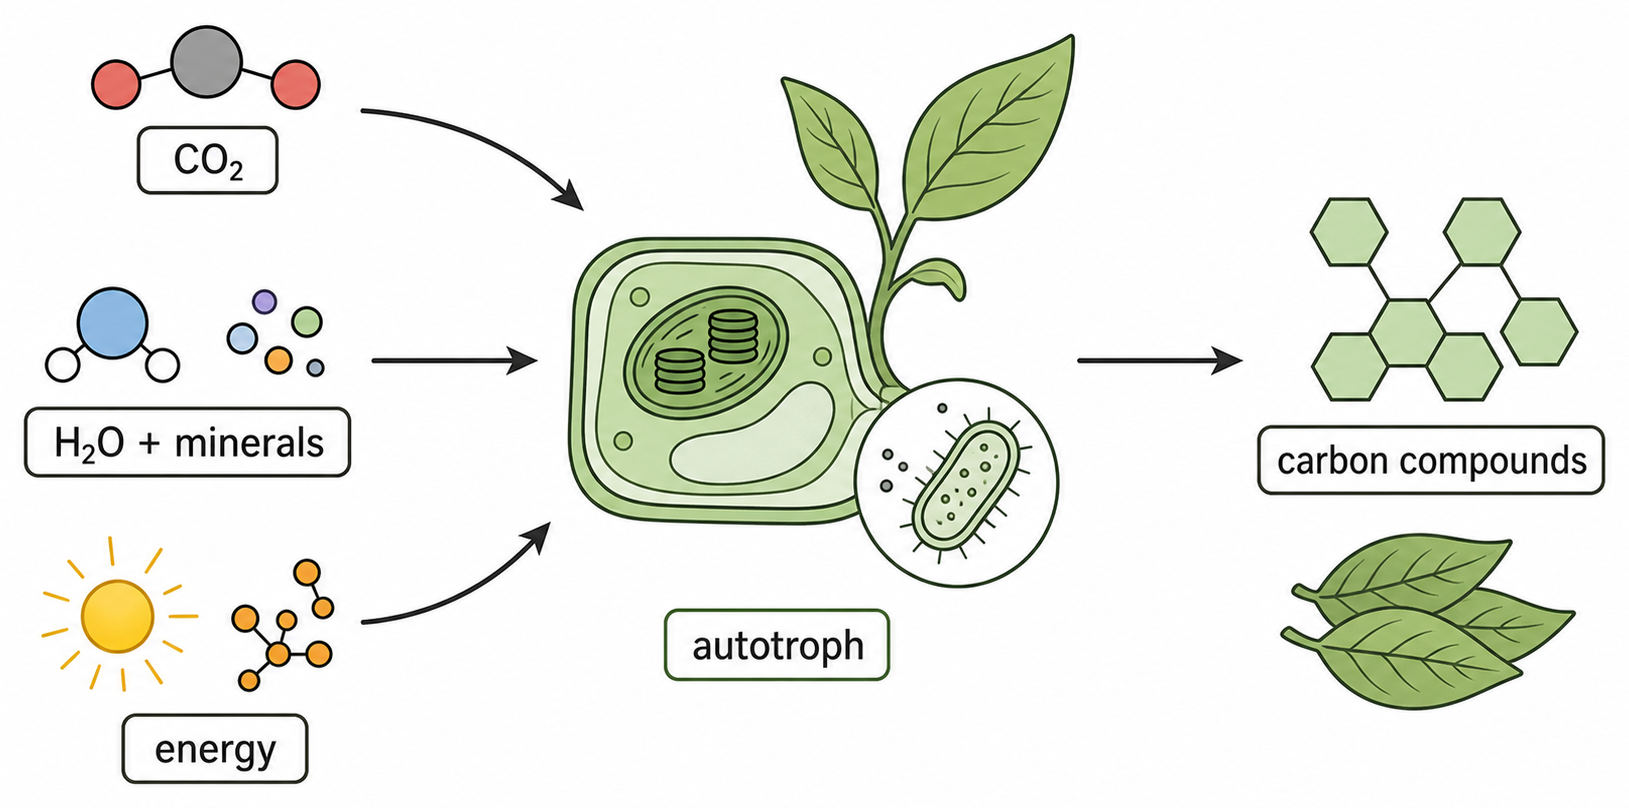
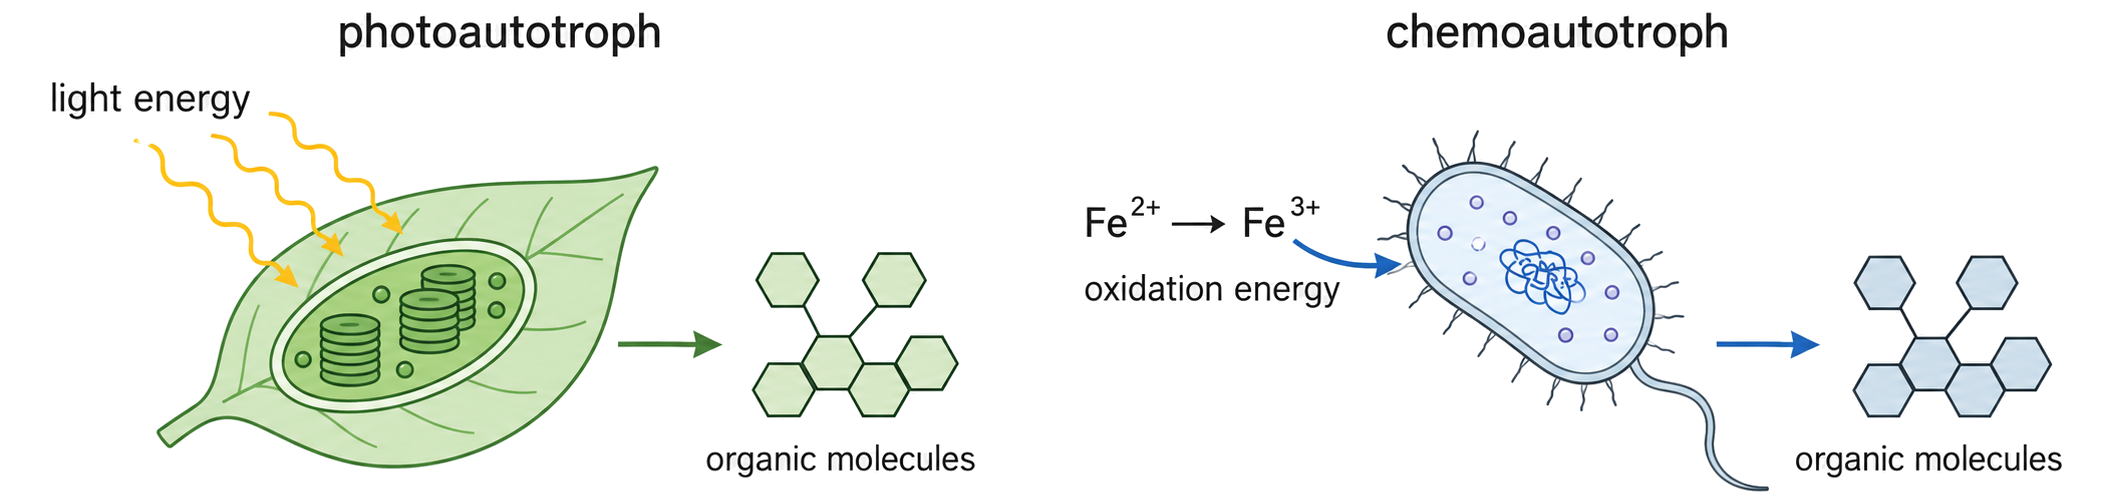
Primary production is the accumulation of carbon compounds in autotroph biomass through growth and reproduction.
Report it as mass of carbon per unit area per unit time, commonly g C m⁻² yr⁻¹. A rate requires a defined area and interval rather than only a standing biomass measurement.
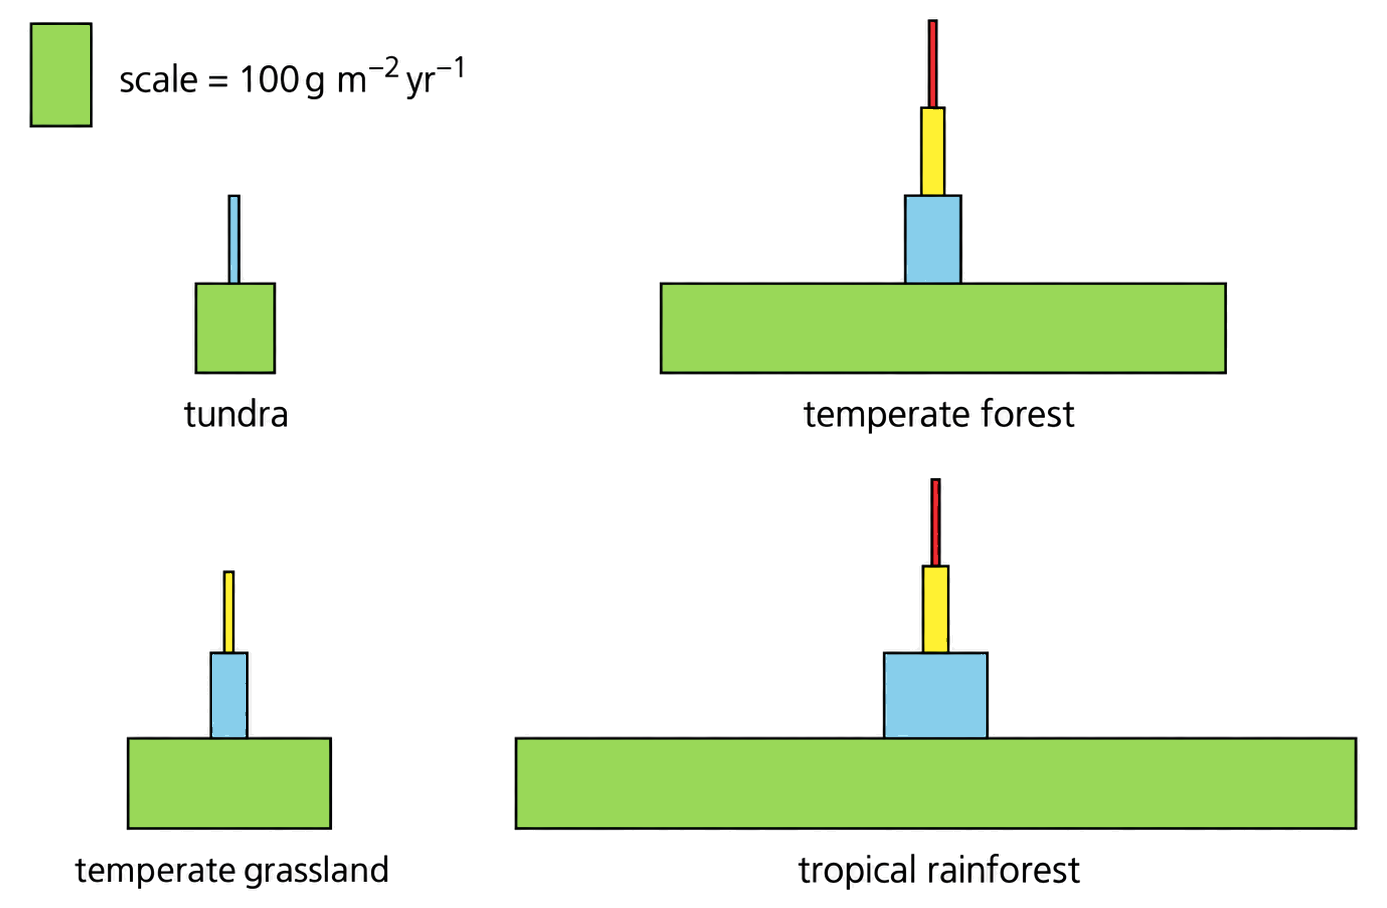
Biomes differ in capacity to accumulate biomass because light, temperature, water, nutrients and growing-season length constrain autotroph growth.
Compare ecosystem primary-production values only after checking that carbon mass, area and time units match; the larger rate represents faster producer carbon accumulation.
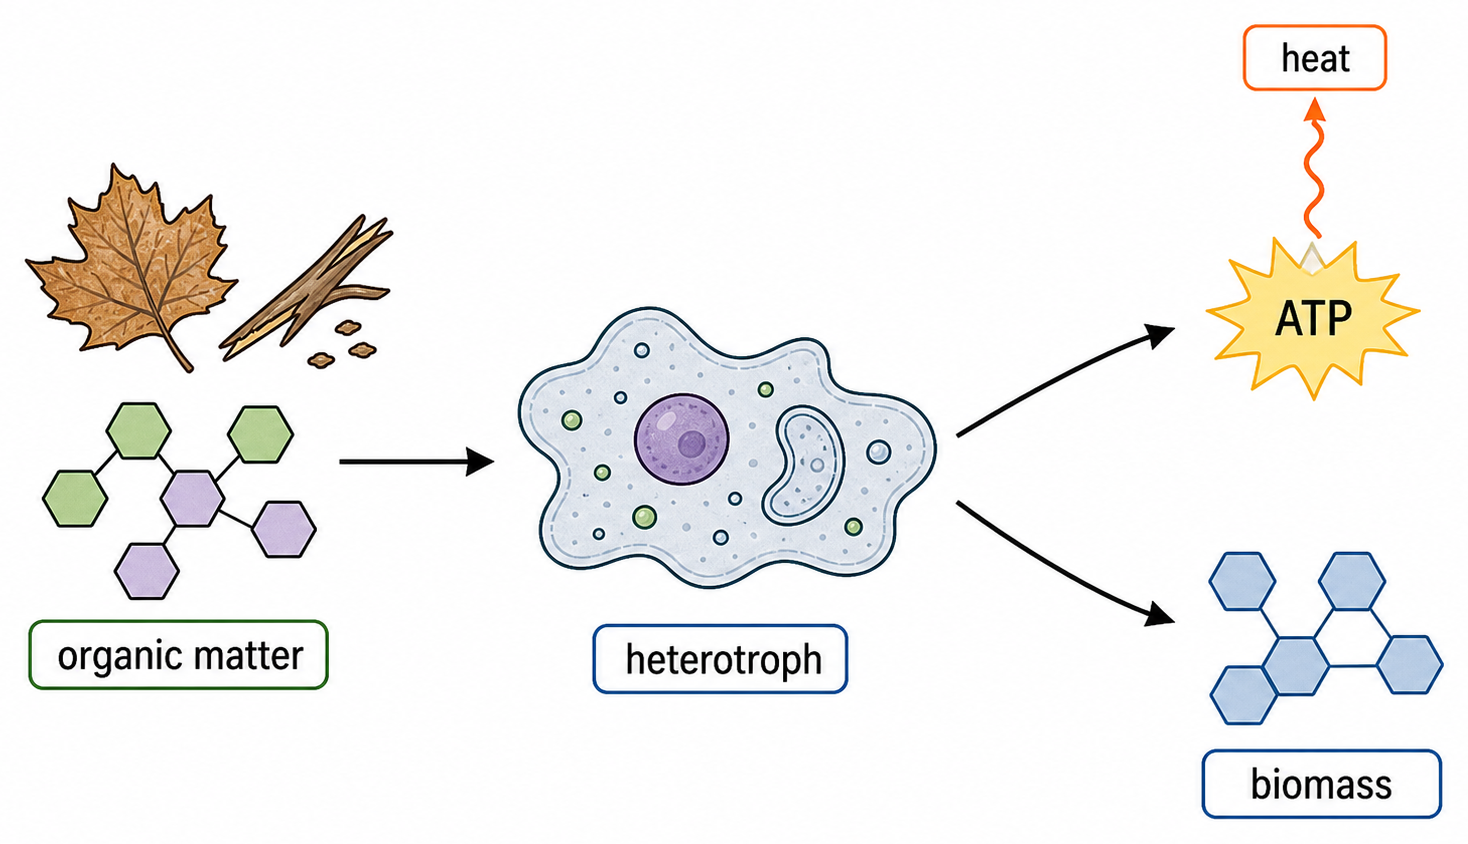
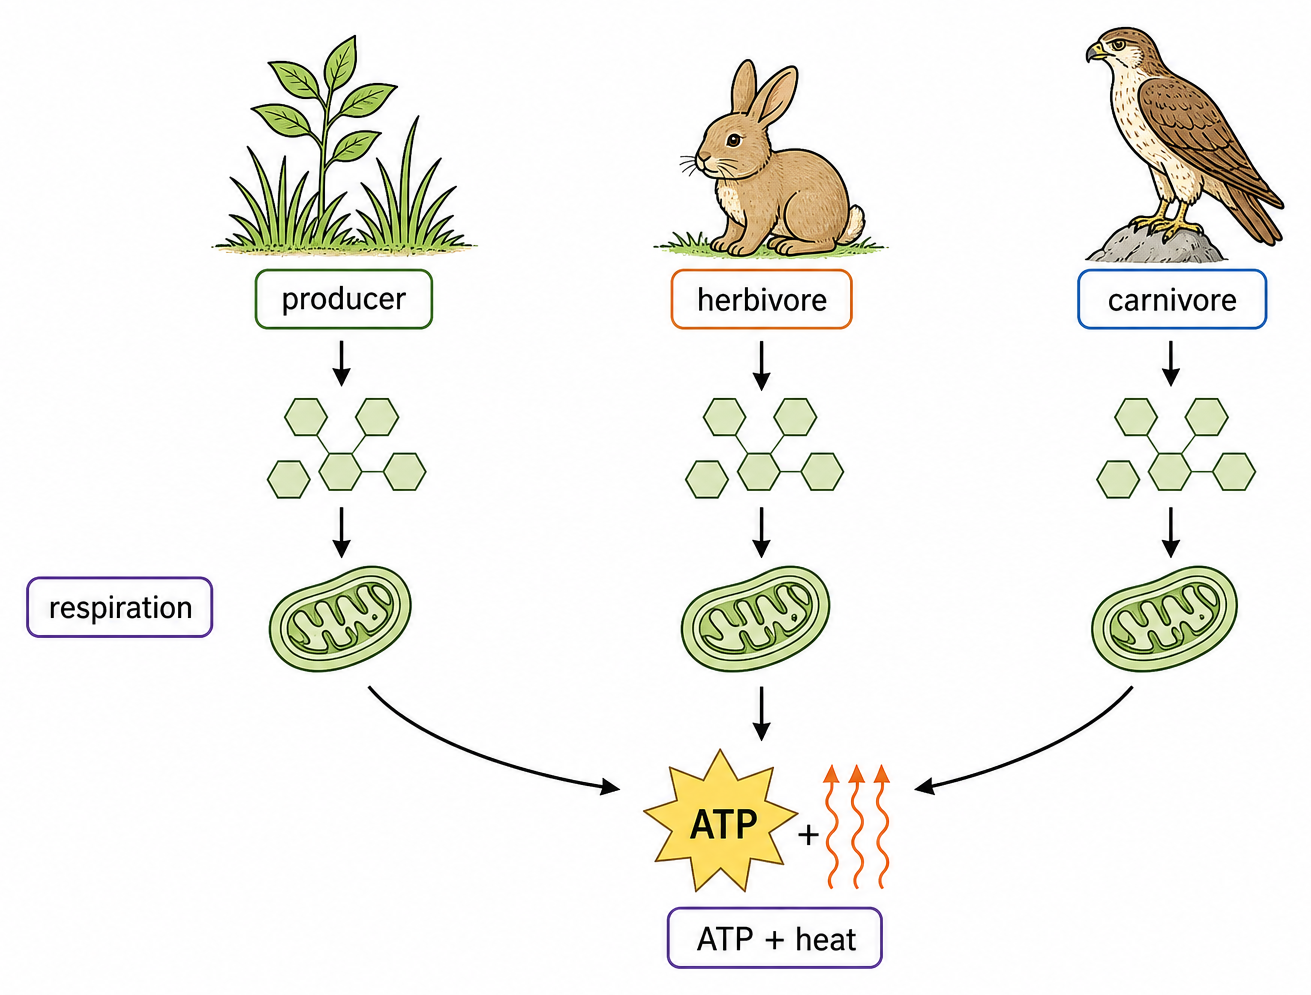
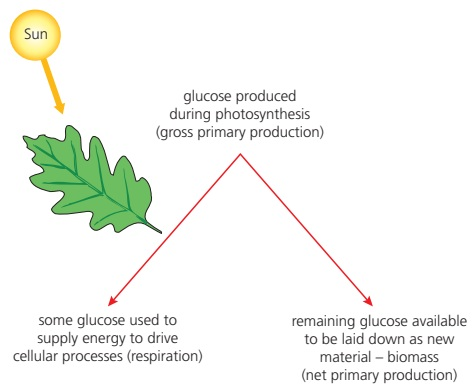
Primary production is producer biomass accumulation, not total biomass already present. Biomass also accumulates when heterotrophs grow or reproduce, but that is secondary production.
This objective is assessed through structured response, commonly using State / Identify / Compare.
State / Identify / Compare / Calculate / Distinguish / Annotate / Describe / Explain / Evaluate
Build the answer around this relationship: Primary production must be linked to the correct source, store, transfer or loss process.
Confusing gross production with net production after respiration losses.
Representative question
In each forest, there are two or three trial plots per CO2 treatment. The bar chart shows the allocation of carbon from net primary production to different parts of the trees in these trial plots.
Evaluate the evidence from the bar chart that increases in carbon dioxide cause increases in carbon storage in young, developing forests.
more carbon stored/allocated (by the tree as a whole) with elevated carbon dioxide;
evidence (from the bar chart) is strong (for the trend/hypothesis);
all elevated plots have more carbon stored than all ambient plots in all sites/no overlap;
more/most carbon allocated to wood (in stems and roots) with elevated carbon dioxide;
more carbon allocated to narrow roots/leaves with elevated carbon dioxide;
narrow roots increase most in Oak Ridge;
most increase in wood (in stems and roots) in Rhinelander and Duke;
much/more variation between plots at Oak Ridge (than at Rhinelander and Duke);
no error bars so significance of differences is uncertain;