Q BankQuestion BankDocsDocuments

C4.1 Populations and communities

Populations and communities describe abundance, sampling, growth limits, species interactions and trophic controls that shape ecological patterns across habitats and ecosystems.

Syllabus
First assessment 2025
Topic
C4.1
Level
HL

A population is one species in one area

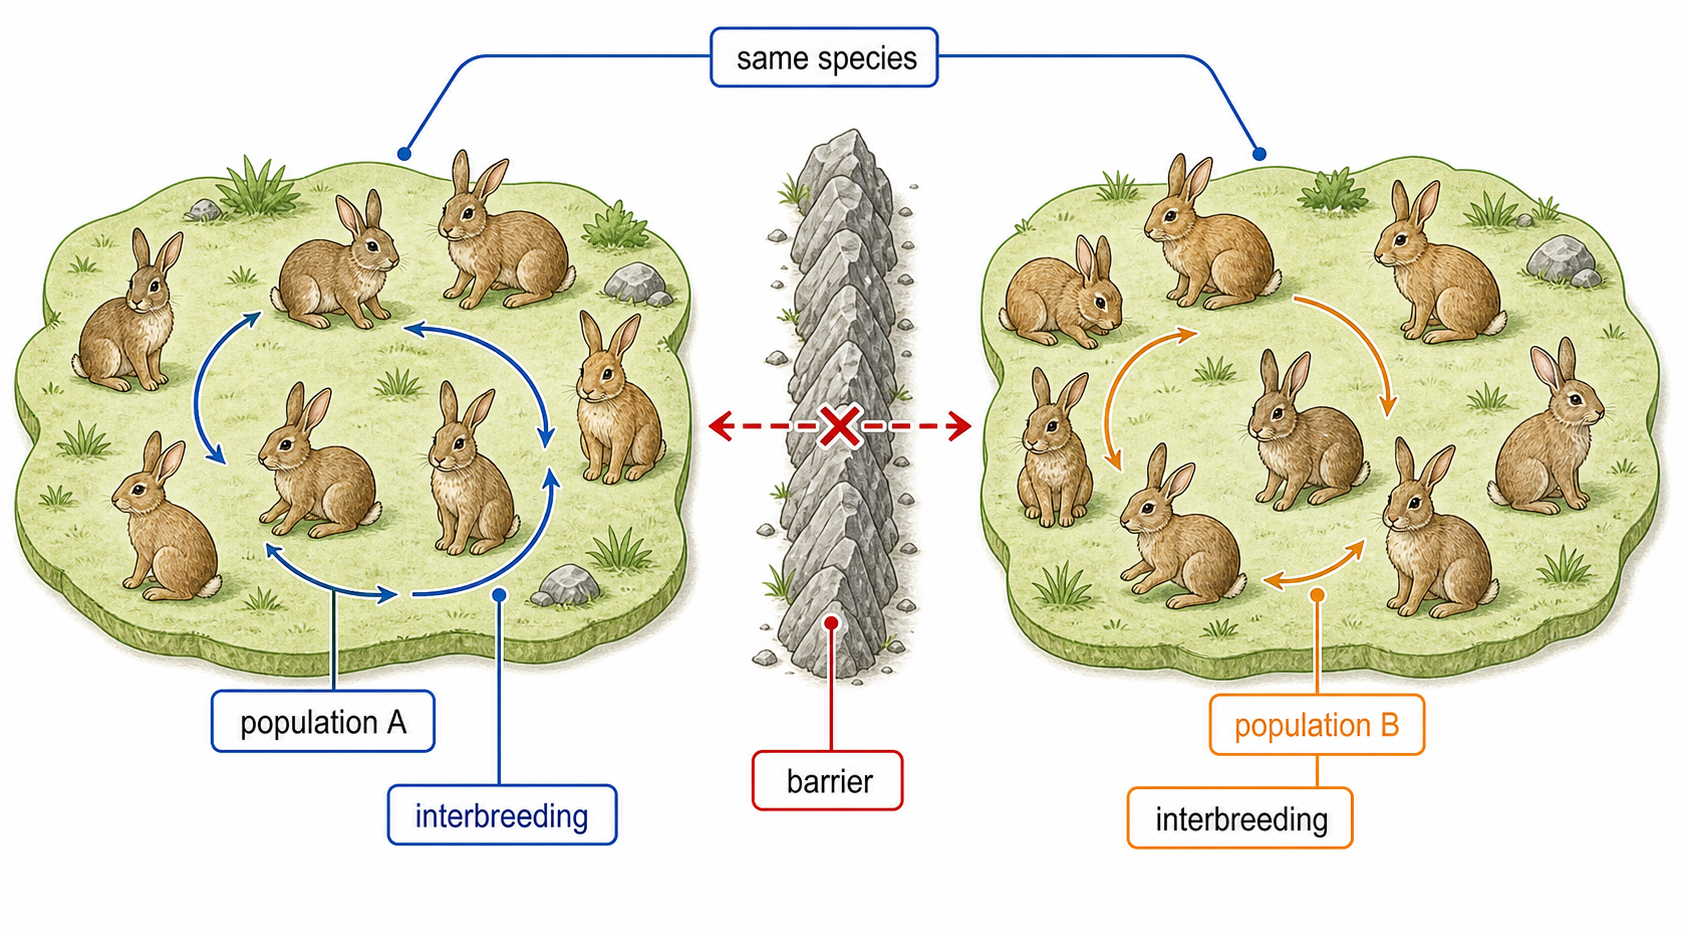
A population is one species in one area.

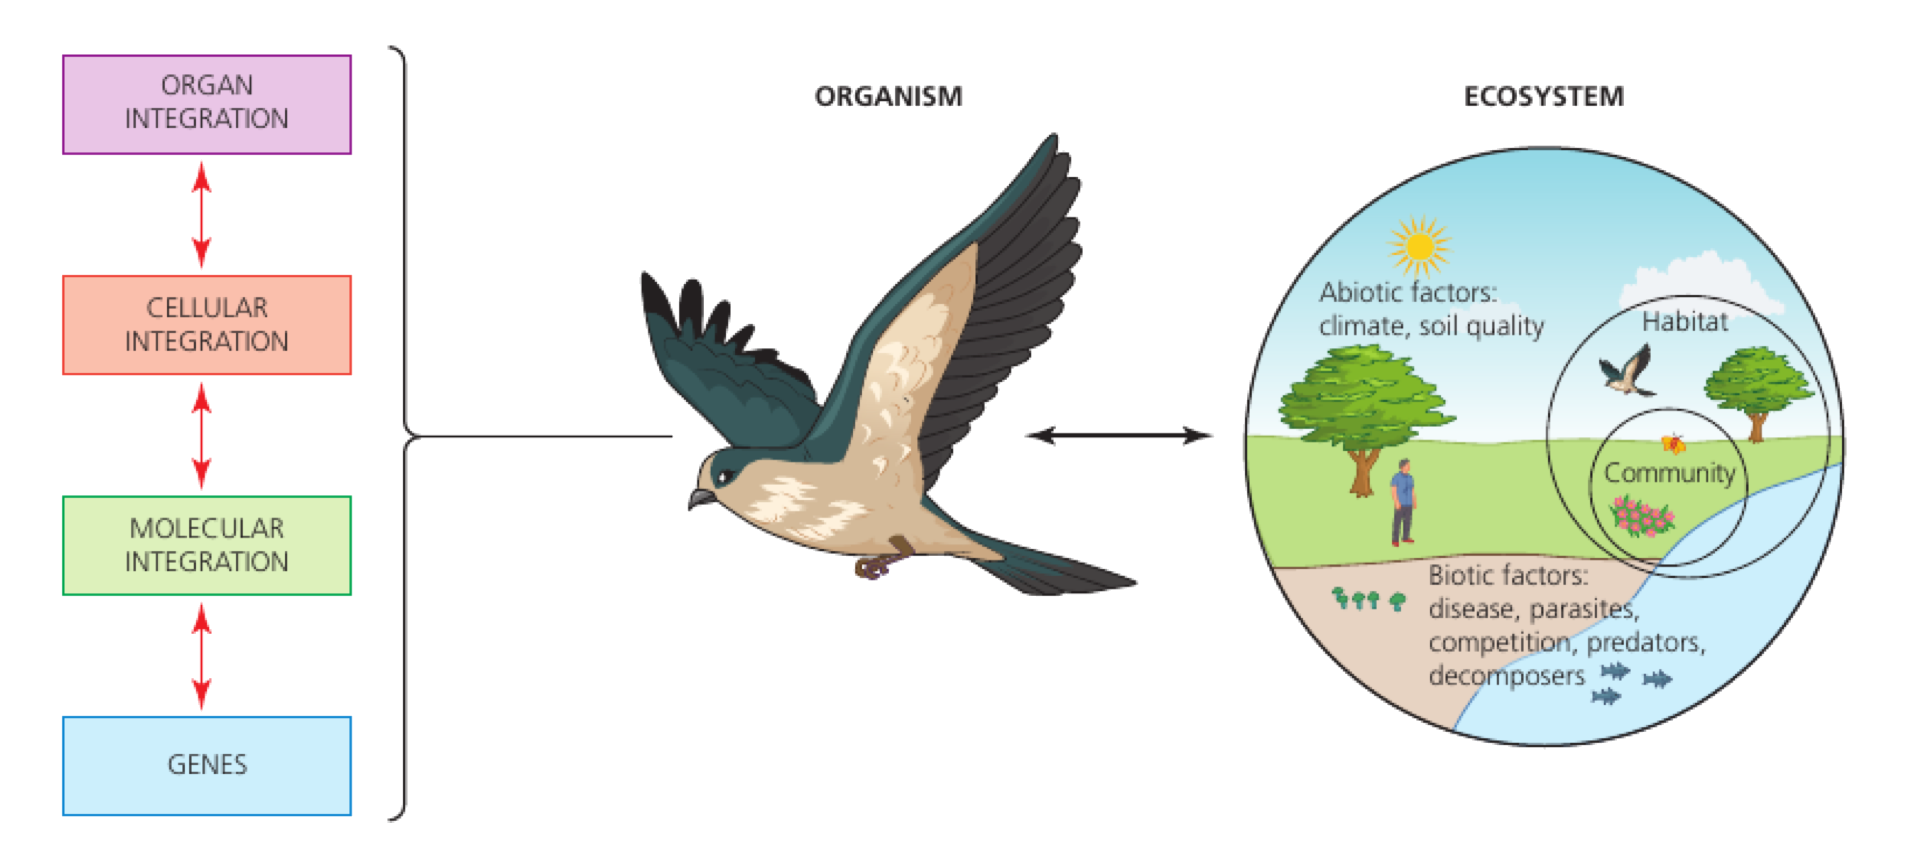
A population is all individuals of the same species living in a defined area at a defined time. Its size and structure change through births, deaths, immigration and emigration.

state species, boundary and time; identify demographic process; distinguish population from community.

A pond frog population can grow after breeding, shrink during drought and receive newcomers from a connected pond.

A population is not every organism in a habitat; it has a species boundary.

Populations exam focus

Assessment in practice

1 marks
How it is assessed

This objective is assessed through structured response, commonly using Identify / Explain / State.

Command terms

Identify / Explain / State

What earns marks

Build the answer around this relationship: Populations must be linked to the correct ecological unit, method or species interaction.

Watch for

Confusing a population with a community or with all organisms in an ecosystem.

Representative question

Question 1

[Maximum number: 1]

State the biological term for a group of organisms of the same species living in an area.

Estimate population size with a defined method

Estimate population size with a defined method.

Population estimates use a sample and assumptions to infer how many organisms occupy a larger area. Method choice must match whether organisms are stationary, mobile, visible or clumped.

define target; choose sample; standardise effort; extrapolate; state uncertainty and assumptions.

Quadrat counts from several random plots can estimate plant abundance across a meadow if the plots represent the meadow.

An estimate is not a census; sampling error and spatial pattern limit precision.

Population size estimation

Assessment in practice

1–3 marks
How it is assessed

This objective is assessed through structured response, commonly using Describe / Outline / Evaluate.

Command terms

Describe / Outline / Evaluate / Explain / State / Discuss / Suggest

What earns marks

Population size estimation is assessed through capture-mark-release-recapture population estimates, chi-squared testing of species association, transect and quadrat field sampling, quadrat sampling for population estimates.

Watch for

Confusing a population with a community or with all organisms in an ecosystem.

Representative question

Question 1

[Maximum number: 6]

Discuss how wild fish populations are assessed to ensure sustainable fishing practices.

Random quadrats reduce placement bias

Random quadrats reduce placement bias.

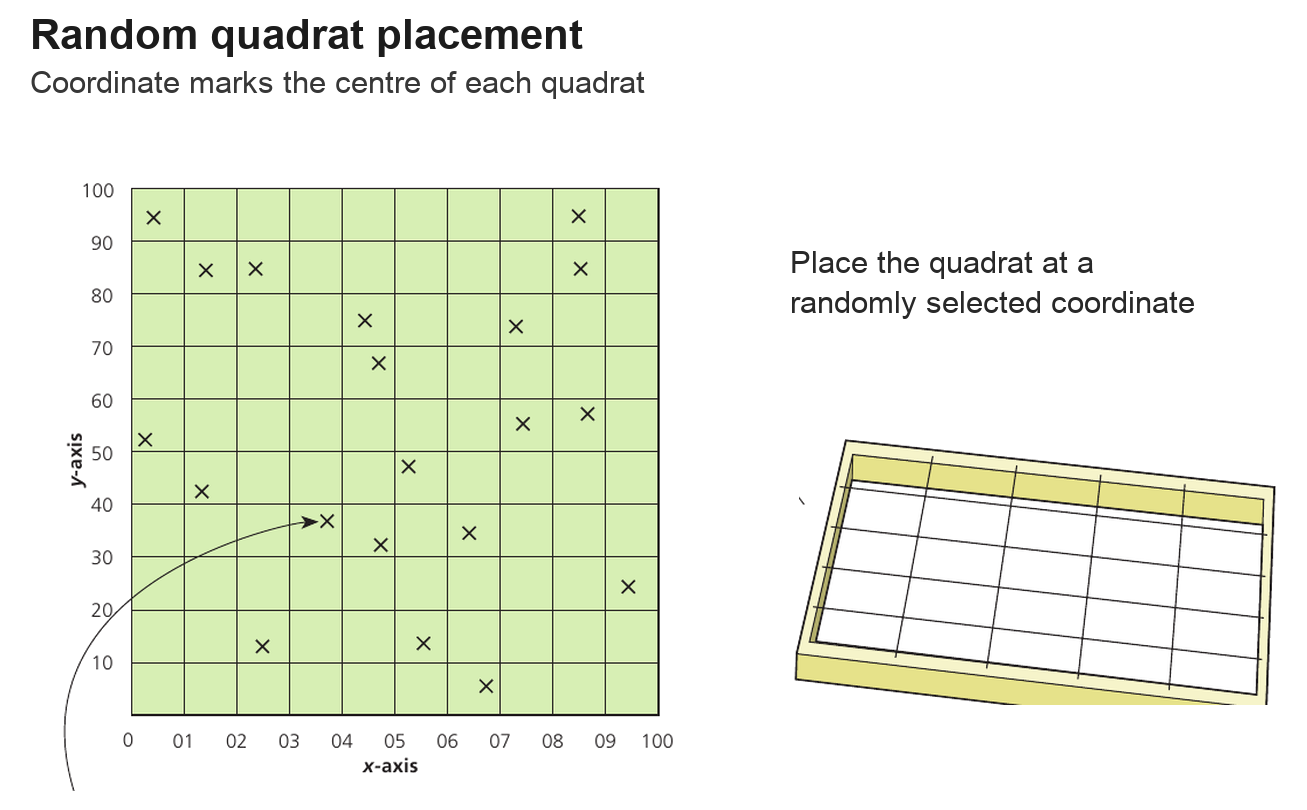
Randomly placed quadrats give each part of a study area a known chance of selection. Repeated equal-sized quadrats allow abundance or frequency to be compared fairly.

define area/quadrat size; randomise positions; record count or cover; repeat; summarise variation.

A random-number grid selects ten meadow plots, avoiding a convenient path that might overrepresent one microhabitat.

Random placement does not guarantee a perfect sample if the number or size of quadrats is too small.

Random quadrat sampling

Assessment in practice

2 marks
How it is assessed

This objective is assessed through structured response, commonly using Outline / Distinguish / Determine.

Command terms

Outline / Distinguish / Determine / Describe

What earns marks

Build the answer around this relationship: Random quadrat sampling must be linked to the correct ecological unit, method or species interaction.

Watch for

Confusing a population with a community or with all organisms in an ecosystem.

Representative question

Question 1

[Maximum number: 3]

Describe a method that can be used to measure the diversity of herbaceous plants in one of the green areas at different distances from the main road.

Capture–mark–recapture estimates mobile populations

Capture–mark–recapture estimates mobile populations.

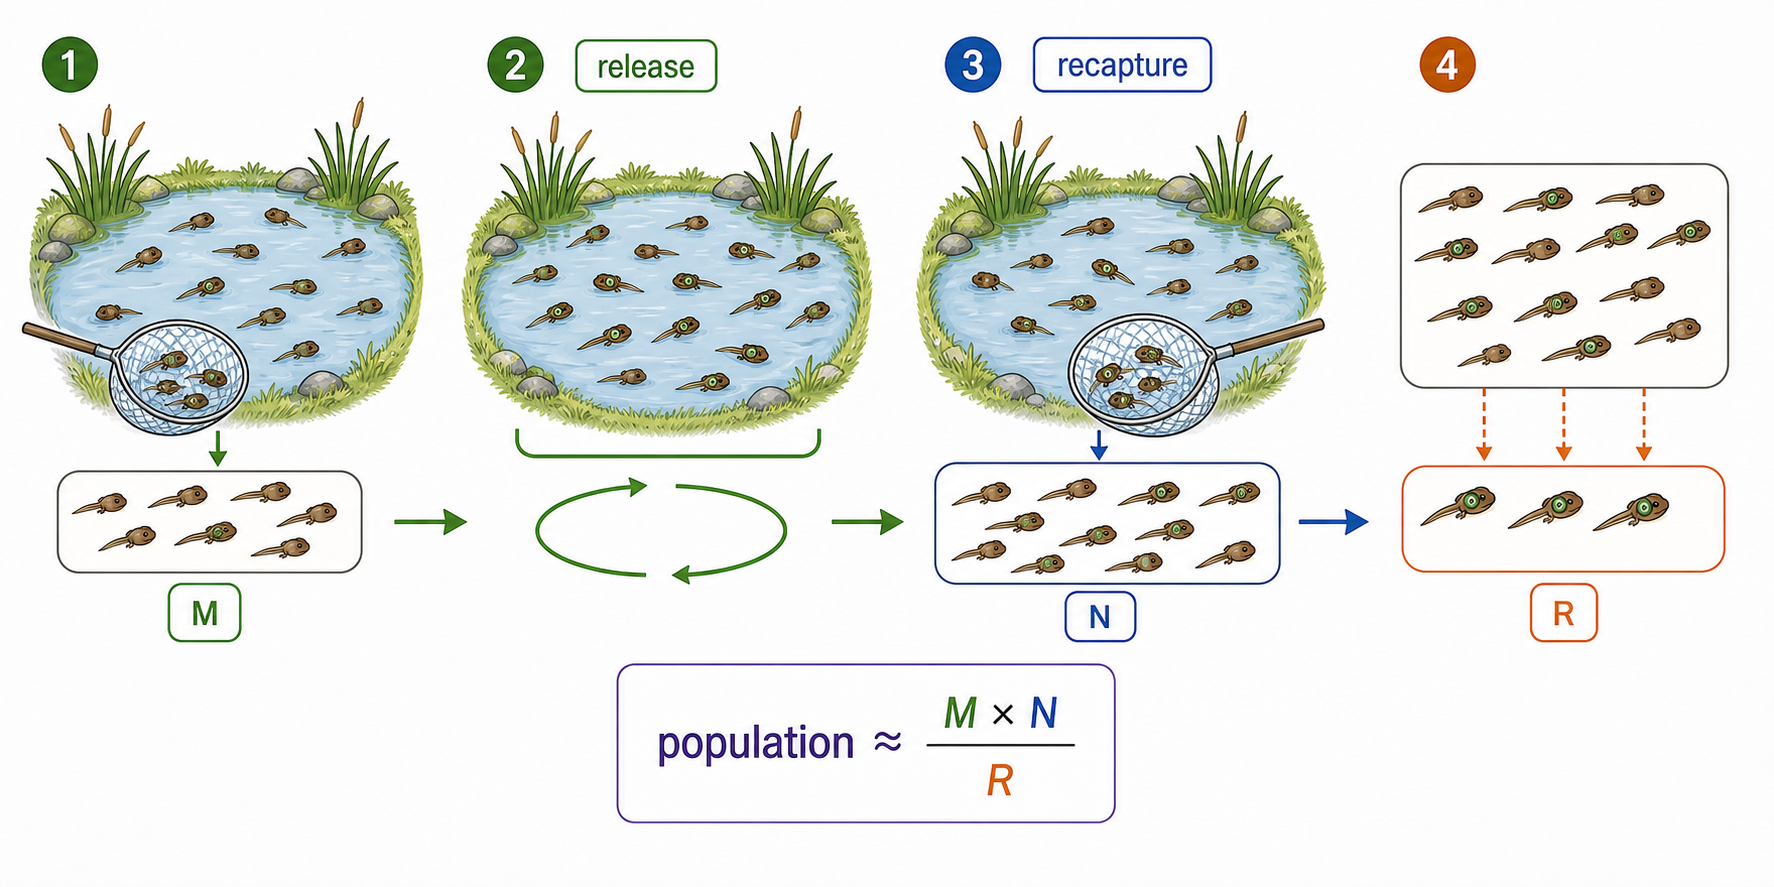
A first sample is captured, marked harmlessly and released. After mixing, a second sample is taken; the marked fraction helps estimate the total population.

N≈(first caught × second caught)/marked recaptured; check mixing, mark retention and equal catchability.

If 40 fish are marked, 50 are caught later and 10 are marked, the estimate is about 200 fish.

The calculation fails if marks are lost, animals learn the trap or the population changes between samples.

Capture-mark-release-recapture exam focus

Assessment in practice

2–6 marks
How it is assessed

This objective is assessed through structured response, commonly using Describe / Outline / Explain.

Command terms

Describe / Outline / Explain / Identify

What earns marks

Key ideas include Capture Mark Release Recapture, Estimates, Motile, Animal, each tied to evidence about abundance, distribution, survival or species effects.

Watch for

Confusing a population with a community or with all organisms in an ecosystem.

Representative question

Question 1

[Maximum number: 6]

Explain the technique used to estimate the population size of a named species of organism that is able to move.

Carrying capacity is a resource-limited population size

Carrying capacity is a resource-limited population size.

Carrying capacity is the population size an environment can support over time under specified conditions. Resource limits and feedback make growth slow as the population approaches it.

identify limiting resource; link density to birth/death rate; state that capacity can change.

A drought lowers available food, so the carrying capacity for grazing animals falls even if the species is unchanged.

Carrying capacity is not a fixed species constant; it depends on environment and timescale.

Carrying capacity

Assessment in practice

1–6 marks
How it is assessed

This objective is assessed through structured response, commonly using Identify / Describe / Explain.

Command terms

Identify / Describe / Explain / Outline / State

What earns marks

Build the answer around this relationship: Carrying capacity must be linked to the correct ecological unit, method or species interaction.

Watch for

Confusing a population with a community or with all organisms in an ecosystem.

Representative question

Question 1

[Maximum number: 7]

Explain why populations that have grown exponentially reach a maximum size, rather than continue to grow.

Negative feedback restrains population growth

Negative feedback restrains population growth.

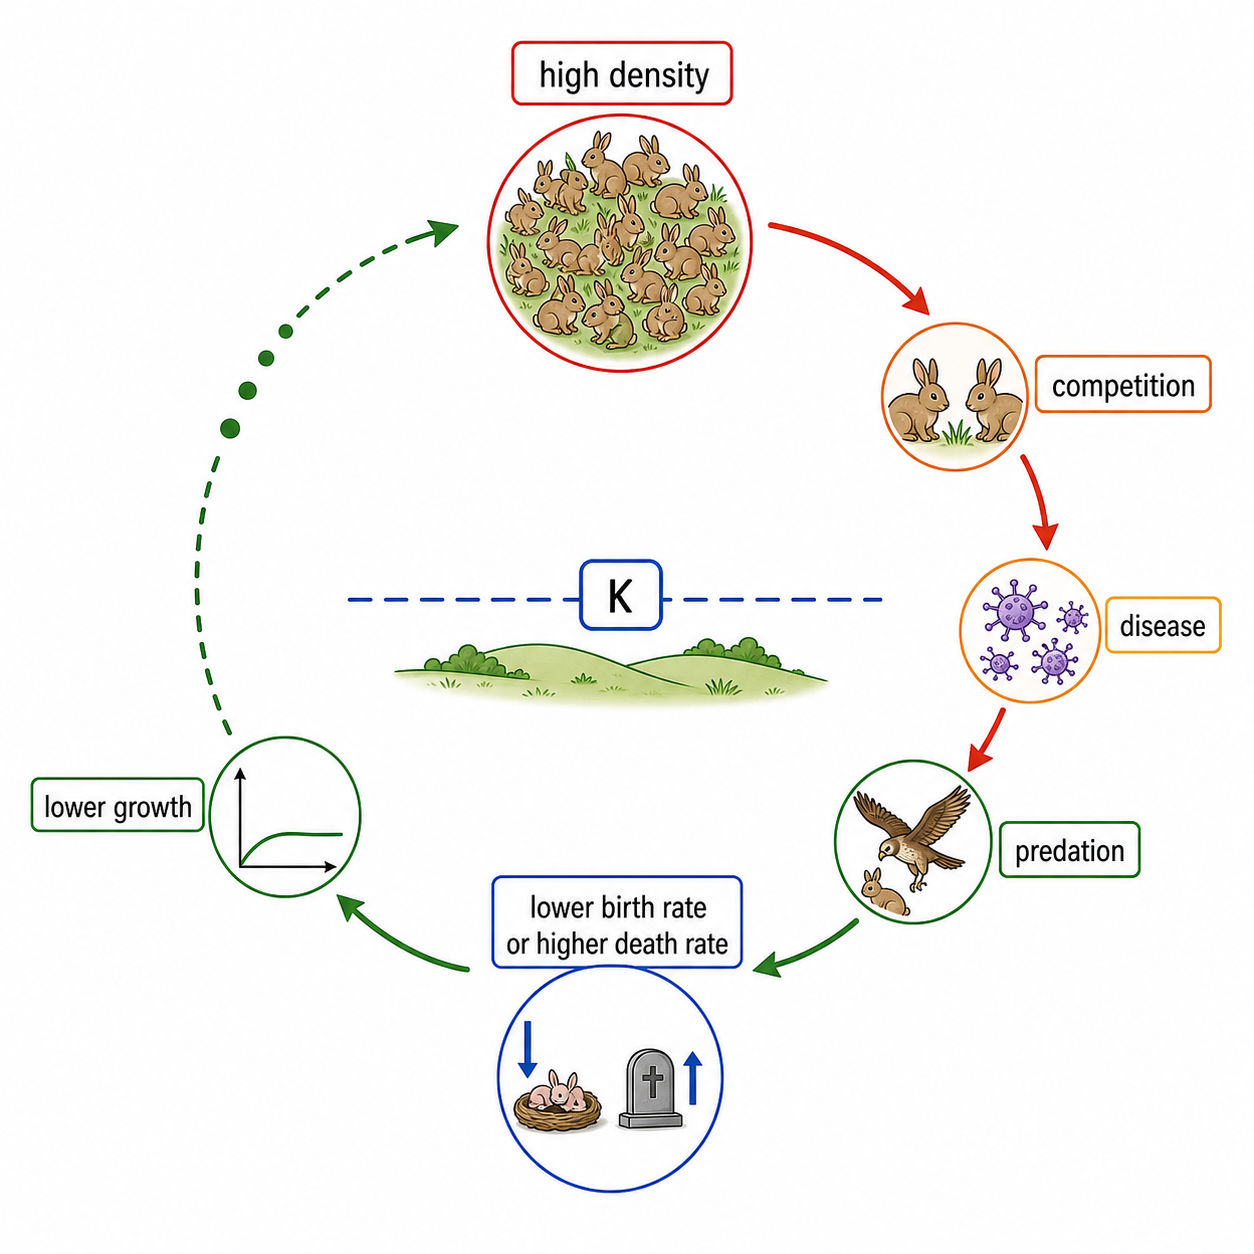
As density rises, competition, disease or predation can reduce births or increase deaths. The response opposes the change and tends to return population size toward a range.

disturbance → density-dependent response → birth/death change → correction.

Crowding increases disease transmission, lowering survival and slowing further population growth.

Not every population change is negative feedback; density-independent storms can reduce numbers without crowding.

Negative feedback control

Assessment in practice

1–2 marks
How it is assessed

This objective is assessed through structured response, commonly using Identify / Explain.

Command terms

Identify / Explain

What earns marks

Build the answer around this relationship: Negative feedback control must be linked to the correct ecological unit, method or species interaction.

Watch for

Confusing a population with a community or with all organisms in an ecosystem.

Representative question

Question 1

[Maximum number: 2]

Explain the change in numbers of the cactus moth throughout the study period.

Growth curves show changing net population rate

Growth curves show changing net population rate.

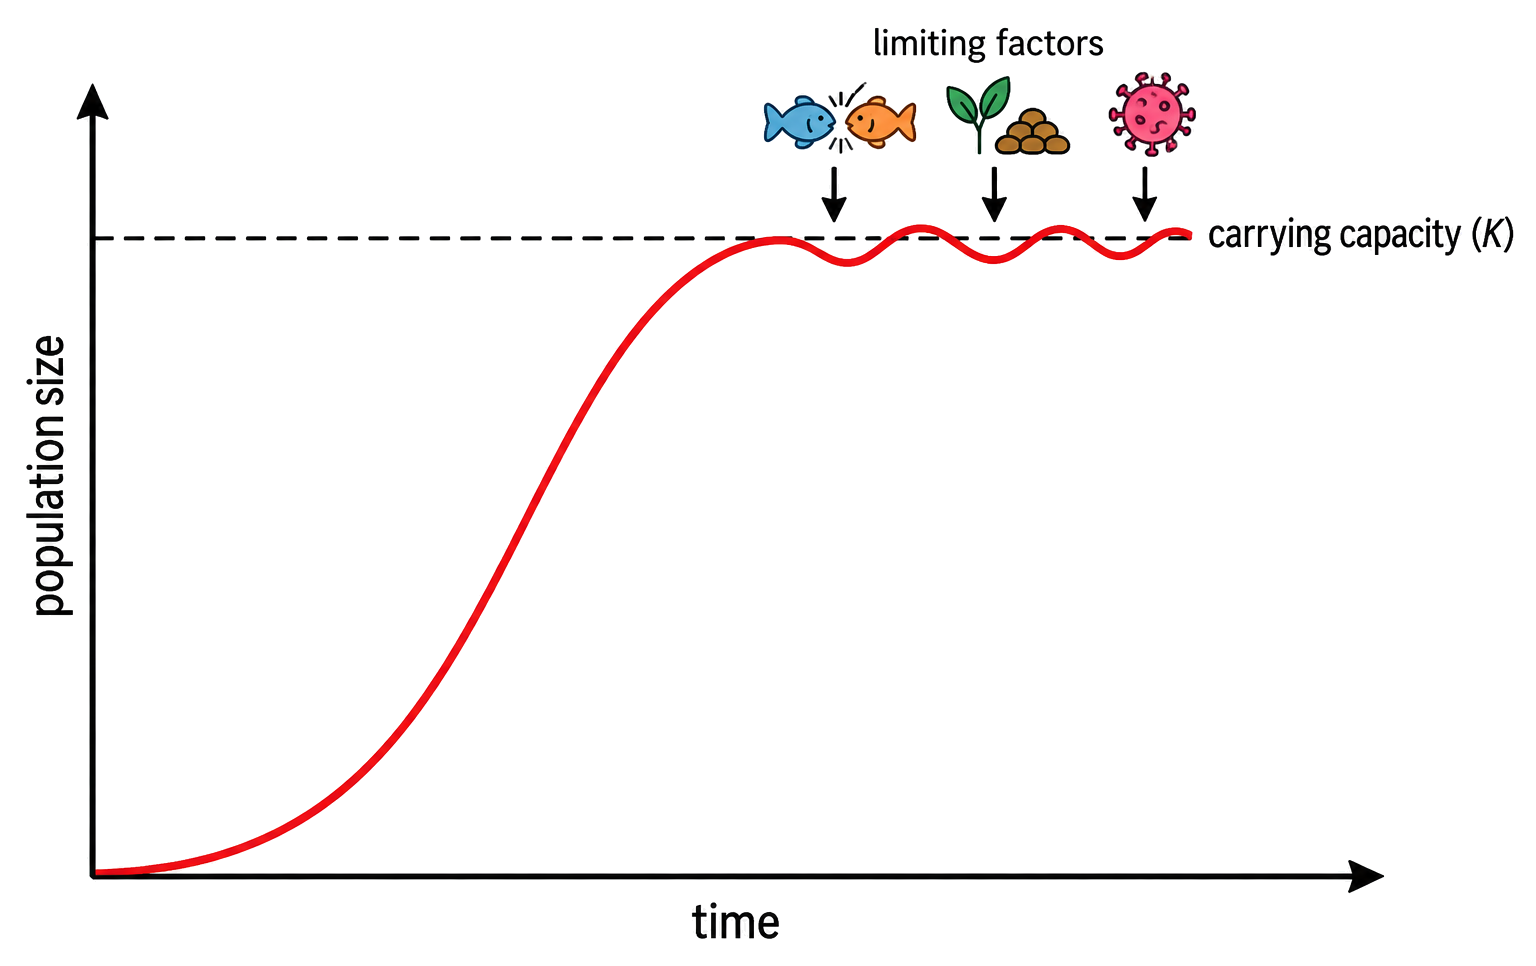
A population may show lag, rapid growth and then slowing as limiting factors intensify. The slope represents net change, not simply the number of organisms present.

read slope; identify phase; connect phase to resources and density; note scale.

A newly introduced species may grow slowly at first, rise steeply when resources are abundant and flatten near capacity.

A steep curve does not mean the population is largest; it means it is changing fastest.

Population growth curves

Assessment in practice

1–3 marks
How it is assessed

This objective is assessed through essay response, commonly using Draw / Identify / Label.

Command terms

Draw / Identify / Label / Outline / State / Explain / Discuss / Suggest / Compare

What earns marks

Build the answer around this relationship: Population growth curves must be linked to the correct ecological unit, method or species interaction.

Watch for

Confusing a population with a community or with all organisms in an ecosystem.

Representative question

Question 1

[Maximum number: 6]

Discuss the factors affecting population growth that can result in an exponential growth curve.

The sigmoid model links growth to carrying capacity

The sigmoid model links growth to carrying capacity.

The logistic model predicts fast growth at intermediate size and slowing growth near carrying capacity because the fraction of limiting resources falls.

identify N, r and K; explain why rate changes; compare model with data.

When N is close to K, each additional animal faces more competition, so dN/dt decreases.

A sigmoid is a model, not a guarantee: migration, seasonal resources and disturbances can break its assumptions.

Competition occurs when organisms share a limited resource

Competition occurs when organisms share a limited resource.

Competition lowers access to food, space, light or mates when demands overlap. Cooperation can instead improve group performance when individuals gain from working together.

name shared resource; show effect on each participant; include cost and context.

Two plant species competing for light may each grow less tall when planted together than when grown alone.

Competition is not defined by aggression; it is a reduction in resource access caused by overlap.

Competition vs. cooperation

Assessment in practice

1–2 marks
How it is assessed

This objective is assessed through structured response, commonly using Discuss / State / Describe.

Command terms

Discuss / State / Describe / Outline / Suggest / Compare / Contrast

What earns marks

Build the answer around this relationship: Competition versus cooperation must be linked to the correct ecological unit, method or species interaction.

Watch for

Describing overlapping niches without explaining that one competitor is displaced or restricted.

Representative question

Question 1

[Maximum number: 2]

Compare and contrast the frequency of monopoly and fighting when there is a change from two trays to one tray of food.

A community contains interacting populations

A community contains interacting populations.

A community is the populations of different species living and interacting in one area. Its composition and structure depend on abiotic conditions and biotic relationships.

list populations; define boundary; identify interaction and environmental filter.

A pond community includes algae, plants, fish, bacteria and invertebrates interacting under the pond’s chemistry and light.

A community is not the same as an ecosystem: an ecosystem also includes abiotic stores and flows.

Community exam focus

Assessment in practice

1 marks
How it is assessed

This objective is assessed through structured response, commonly using Identify / State / Suggest.

Command terms

Identify / State / Suggest / Evaluate / Compare / Contrast / Describe / Explain

What earns marks

Build the answer around this relationship: Community must be linked to the correct ecological unit, method or species interaction.

Watch for

Including abiotic factors in the definition of community instead of reserving them for ecosystem.

Representative question

Question 1

[Maximum number: 3]

Compare and contrast the community structure within and outside the marine protected area.

Interspecific relationships change population outcomes

Interspecific relationships change population outcomes.

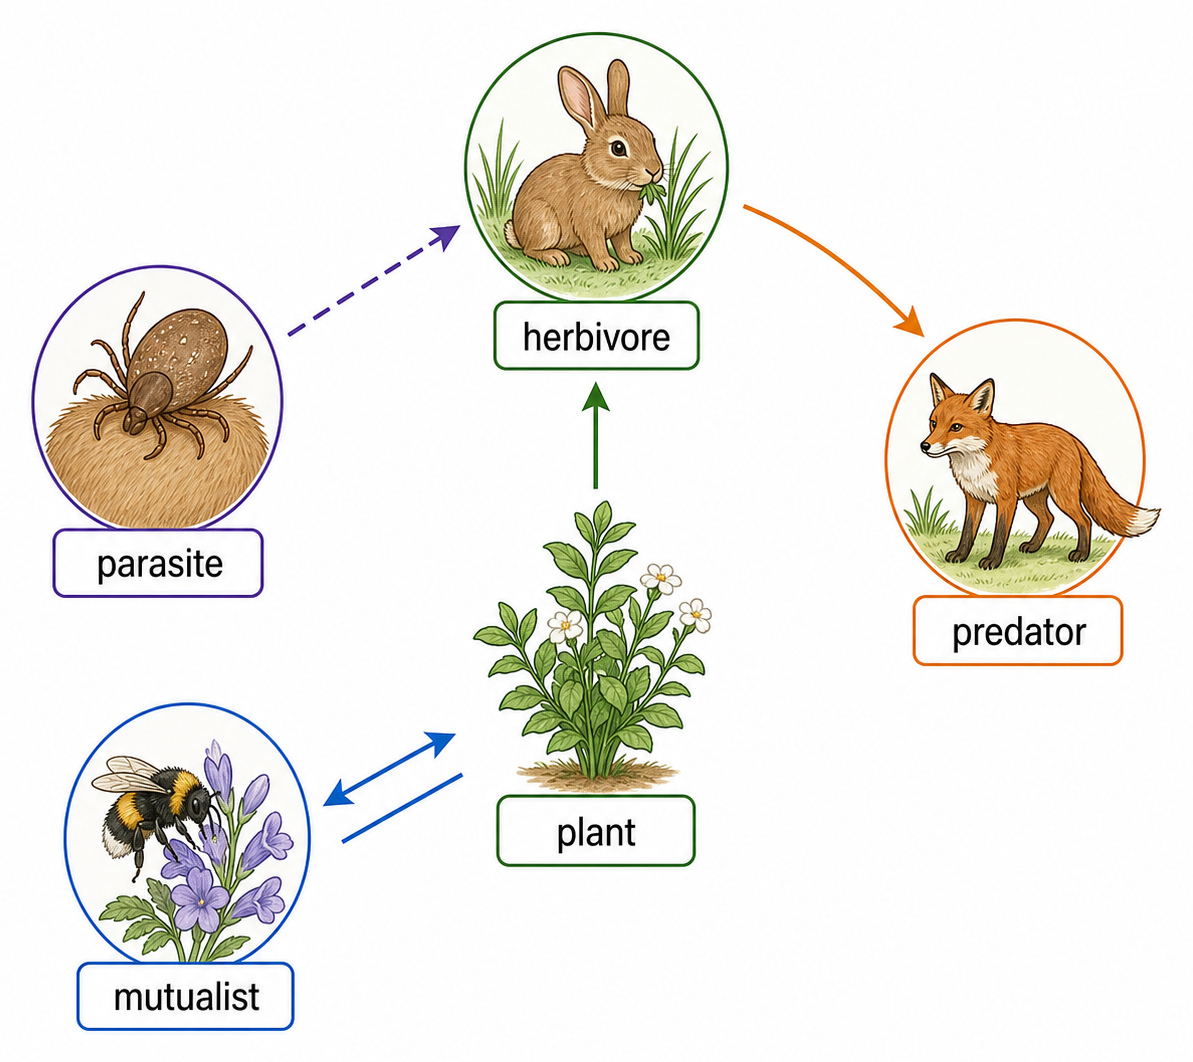
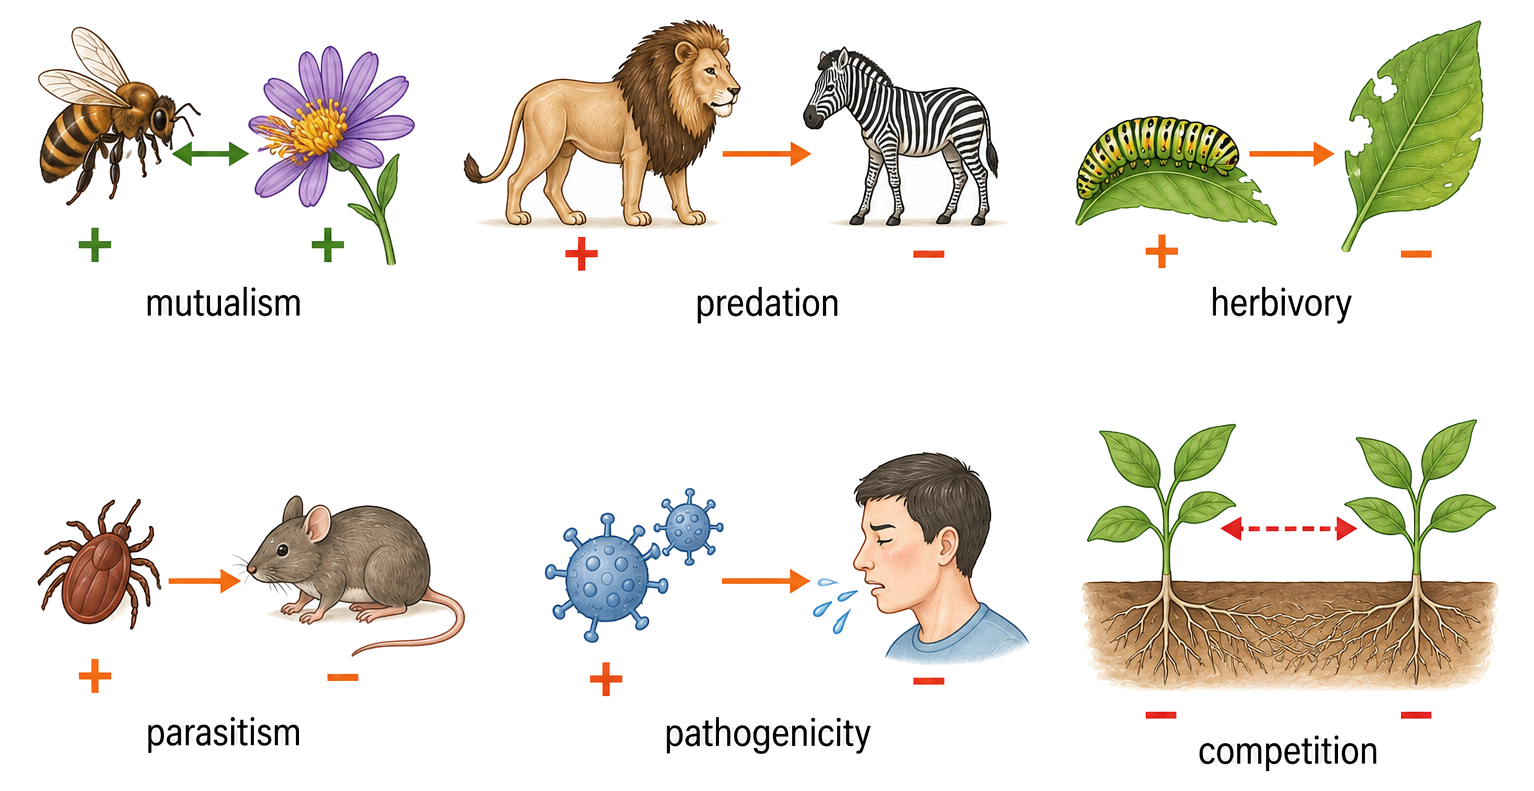
Predation, competition, mutualism, parasitism and commensalism describe how one species’ interaction affects another. The sign of an interaction can depend on conditions.

use +/−/0 effects; identify mechanism; state whether relationship is stable across contexts.

A predator reduces prey abundance but may also prevent one competitor from excluding another species.

Do not label a relationship from one observation without identifying the process and time scale.

Interspecific relationships

Assessment in practice

1–2 marks
How it is assessed

This objective is assessed through essay response, commonly using Identify / Discuss / Describe.

Command terms

Identify / Discuss / Describe / State / Suggest / Predict / Deduce / Evaluate

What earns marks

Interspecific relationships is assessed through predator-prey effects and population regulation, interspecific relationships in communities, capture-mark-release-recapture population estimates, chi-squared testing of species association.

Watch for

Confusing a population with a community or with all organisms in an ecosystem.

Representative question

Question 1

[Maximum number: 3]

Evaluate whether crop yield may be improved through enhancement of pollinator richness.

Mutualism gives both partners a context-dependent benefit

Mutualism gives both partners a context-dependent benefit.

In mutualism, each species gains a net benefit from the interaction, often through exchange of resources or services. Benefits have costs and may change with conditions.

benefit to partner A; benefit to B; exchanged service/resource; cost or boundary.

Mycorrhizal fungi receive plant sugars while improving the plant’s access to phosphorus and water.

Mutualism is not automatically essential or permanently equal; both partners can survive without it in some settings.

Mutualism as interspecific relationship

Assessment in practice

1–2 marks
How it is assessed

This objective is assessed through structured response, commonly using Outline / Suggest / Deduce.

Command terms

Outline / Suggest / Deduce / Distinguish / State / Describe / Identify / Analyse

What earns marks

Build the answer around this relationship: Mutualism as interspecific relationship must be linked to the correct ecological unit, method or species interaction.

Watch for

Confusing a population with a community or with all organisms in an ecosystem.

Representative question

Question 1

[Maximum number: 3]

Analyse the relationship between plants and their pollinators.

Endemic and invasive describe distribution histories

Endemic and invasive describe distribution histories.

An endemic species is native and restricted to a particular region. An invasive species is introduced and spreads in a way that causes ecological or economic harm.

state native range; introduction status; spread; documented impact.

A species endemic to one island may be vulnerable to habitat loss, while an introduced predator can spread through a community lacking defences.

Non-native does not automatically mean invasive; harm and spread must be demonstrated.

Endemic vs. invasive species

Assessment in practice

2–3 marks
How it is assessed

This objective is assessed through essay response, commonly using State / Discuss / Suggest.

Command terms

State / Discuss / Suggest / Identify / Outline / Describe / Explain / Evaluate / Define / Analyse

What earns marks

Build the answer around this relationship: Endemic versus invasive species must be linked to the correct ecological unit, method or species interaction.

Watch for

Naming an alien species without explaining competition, predation, disease or biodiversity impact.

Representative question

Question 1

[Maximum number: 6]

Discuss, giving an example, the possible effects of the introduction of an alien species into an ecosystem.

Competition tests need a manipulated comparison

Competition tests need a manipulated comparison.

To test interspecific competition, compare growth, survival or resource use with and without the competitor while controlling other variables. Replication and randomisation strengthen inference.

control competitor presence; measure response; hold conditions; replicate; interpret effect size.

Seedlings grown alone and with a neighbour under identical light can reveal whether the neighbour reduces biomass.

A difference in abundance alone does not prove competition if another environmental variable differs too.

Tests for interspecific competition

Assessment in practice

1–3 marks
How it is assessed

This objective is assessed through structured response, commonly using Outline / Suggest / Explain.

Command terms

Outline / Suggest / Explain / State / Predict

What earns marks

Build the answer around this relationship: Tests for interspecific competition must be linked to the correct ecological unit, method or species interaction.

Watch for

Describing overlapping niches without explaining that one competitor is displaced or restricted.

Representative question

Question 1

[Maximum number: 3]

Explain the results shown in this experiment.

Chi-squared tests compare observed and expected counts

Chi-squared tests compare observed and expected counts.

A chi-squared statistic measures how far categorical observations deviate from an expected distribution. Expected counts come from the null hypothesis, not from the observed pattern.

state null; calculate expected; compare observed–expected differences; use degrees of freedom and p-value.

If flower-colour counts differ from a proposed ratio, chi-squared can test whether the deviation is larger than sampling variation.

A significant result rejects the null pattern; it does not prove a particular cause.

Chi-squared test

Assessment in practice

1 marks
How it is assessed

This objective is assessed through structured response, commonly using Identify / Outline / Determine.

Command terms

Identify / Outline / Determine / Explain / Calculate / State

What earns marks

Build the answer around this relationship: Chi-squared test must be linked to the correct ecological unit, method or species interaction.

Watch for

Using non-random sampling when the estimate requires representative quadrat positions.

Representative question

Question 1

[Maximum number: 3]

Outline how chi-squared can be used to test for an association between the distributions of the two species.

Predator and prey numbers can oscillate

Predator and prey numbers can oscillate.

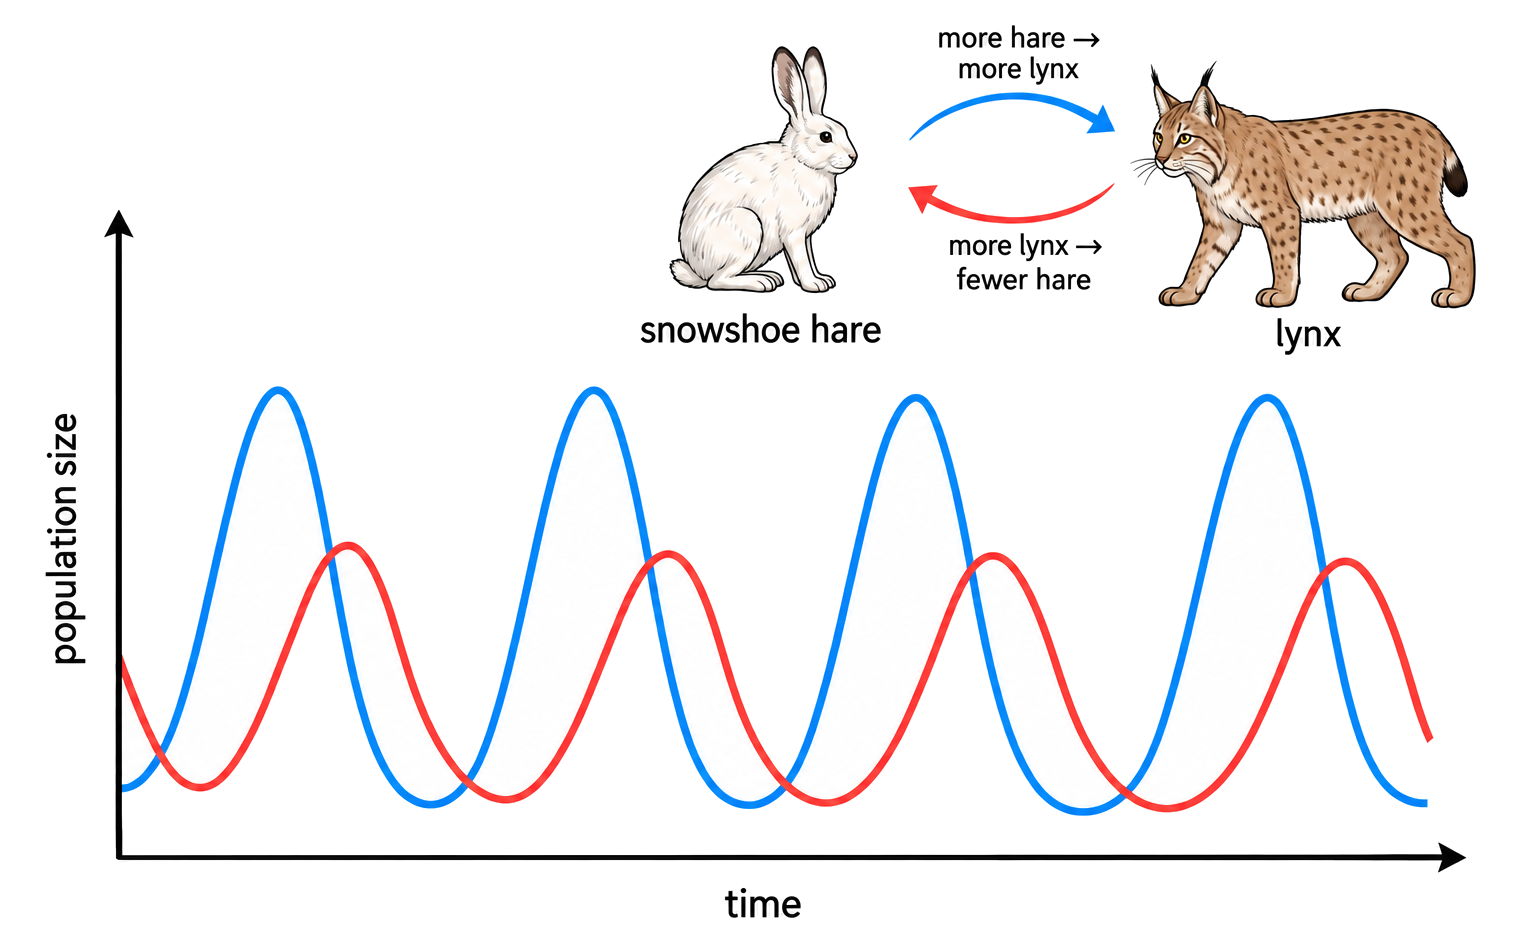
Predator abundance often responds after prey abundance changes because reproduction and mortality take time. Predation can then reduce prey, producing a lagged cycle.

read peaks and troughs; identify lag; link prey to food and predator to prey availability.

Rabbits increase first, fox numbers rise later, and rabbit numbers fall before fox numbers decline from food shortage.

A correlation is not automatically a predator–prey cycle; disease, weather and migration can also drive it.

Predator-prey relationships

Assessment in practice

2 marks
How it is assessed

This objective is assessed through structured response, commonly using Identify / Compare / Describe.

Command terms

Identify / Compare / Describe / Predict / Explain / Contrast / Suggest / Determine

What earns marks

Build the answer around this relationship: Predator-prey relationships must be linked to the correct ecological unit, method or species interaction.

Watch for

Confusing a population with a community or with all organisms in an ecosystem.

Representative question

Question 1

[Maximum number: 3]

Describe the effect of removing trout on frog density in Upper and Lower LeConte Lakes.

Top-down and bottom-up control start at different levels

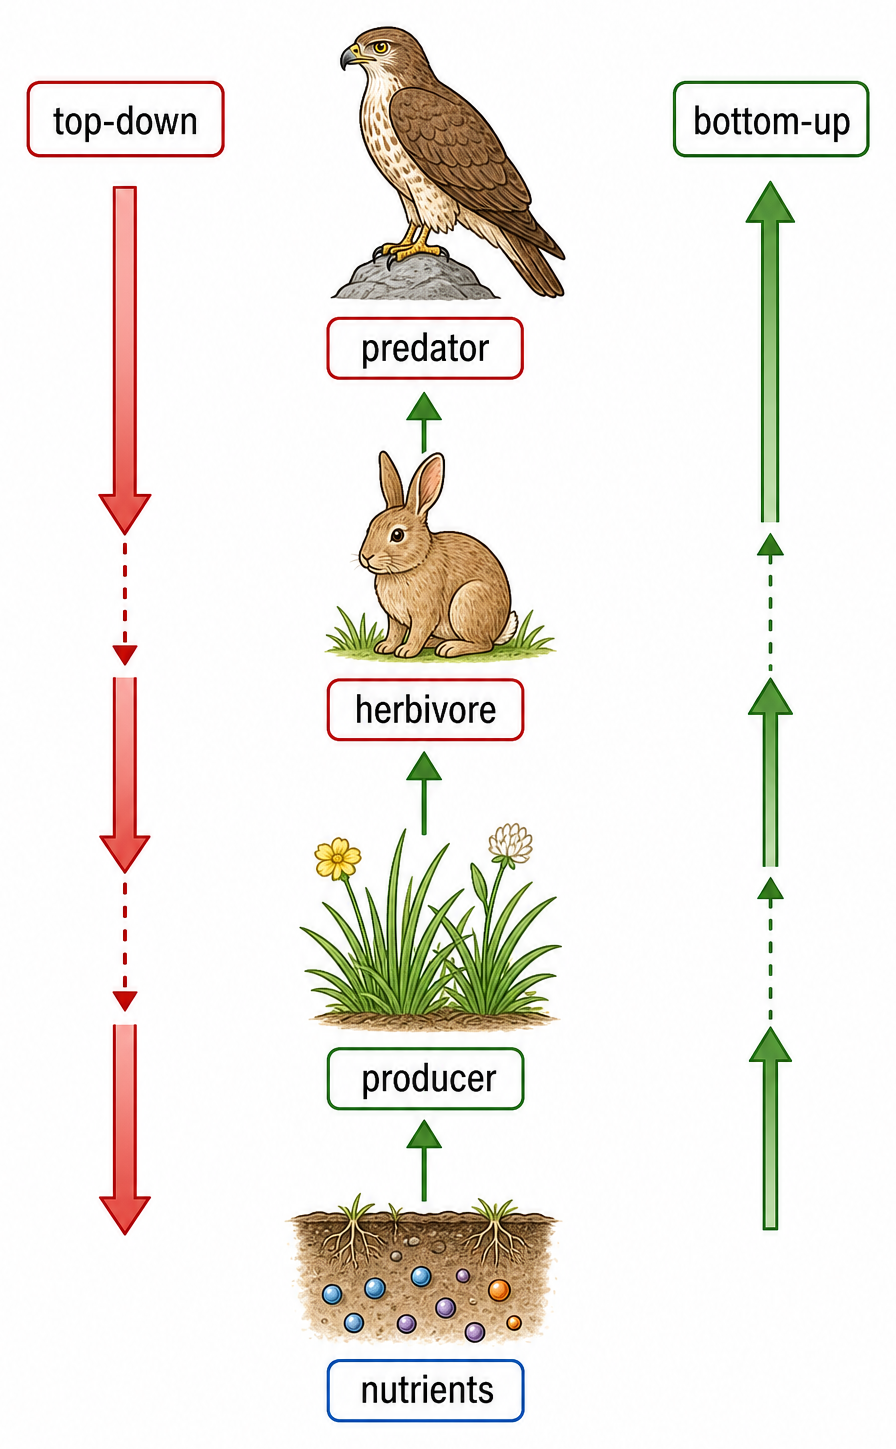
Top-down and bottom-up control start at different levels.
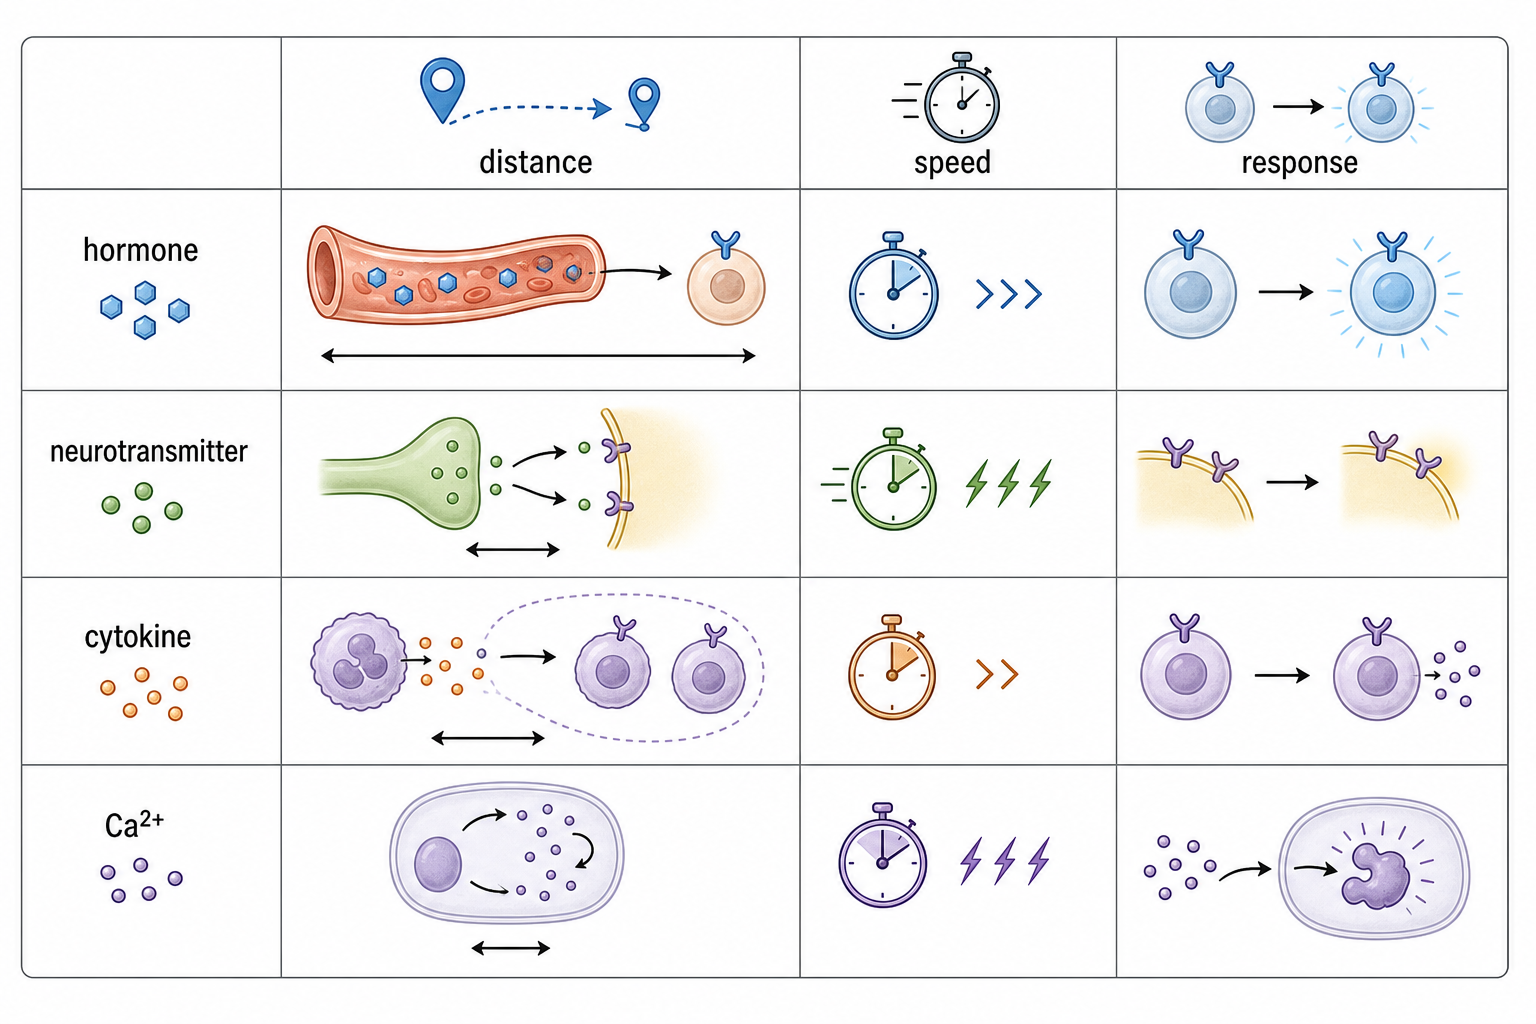
Top-down control begins with consumers altering lower trophic levels; bottom-up control begins with nutrients or primary production limiting higher levels. Real systems can show both.
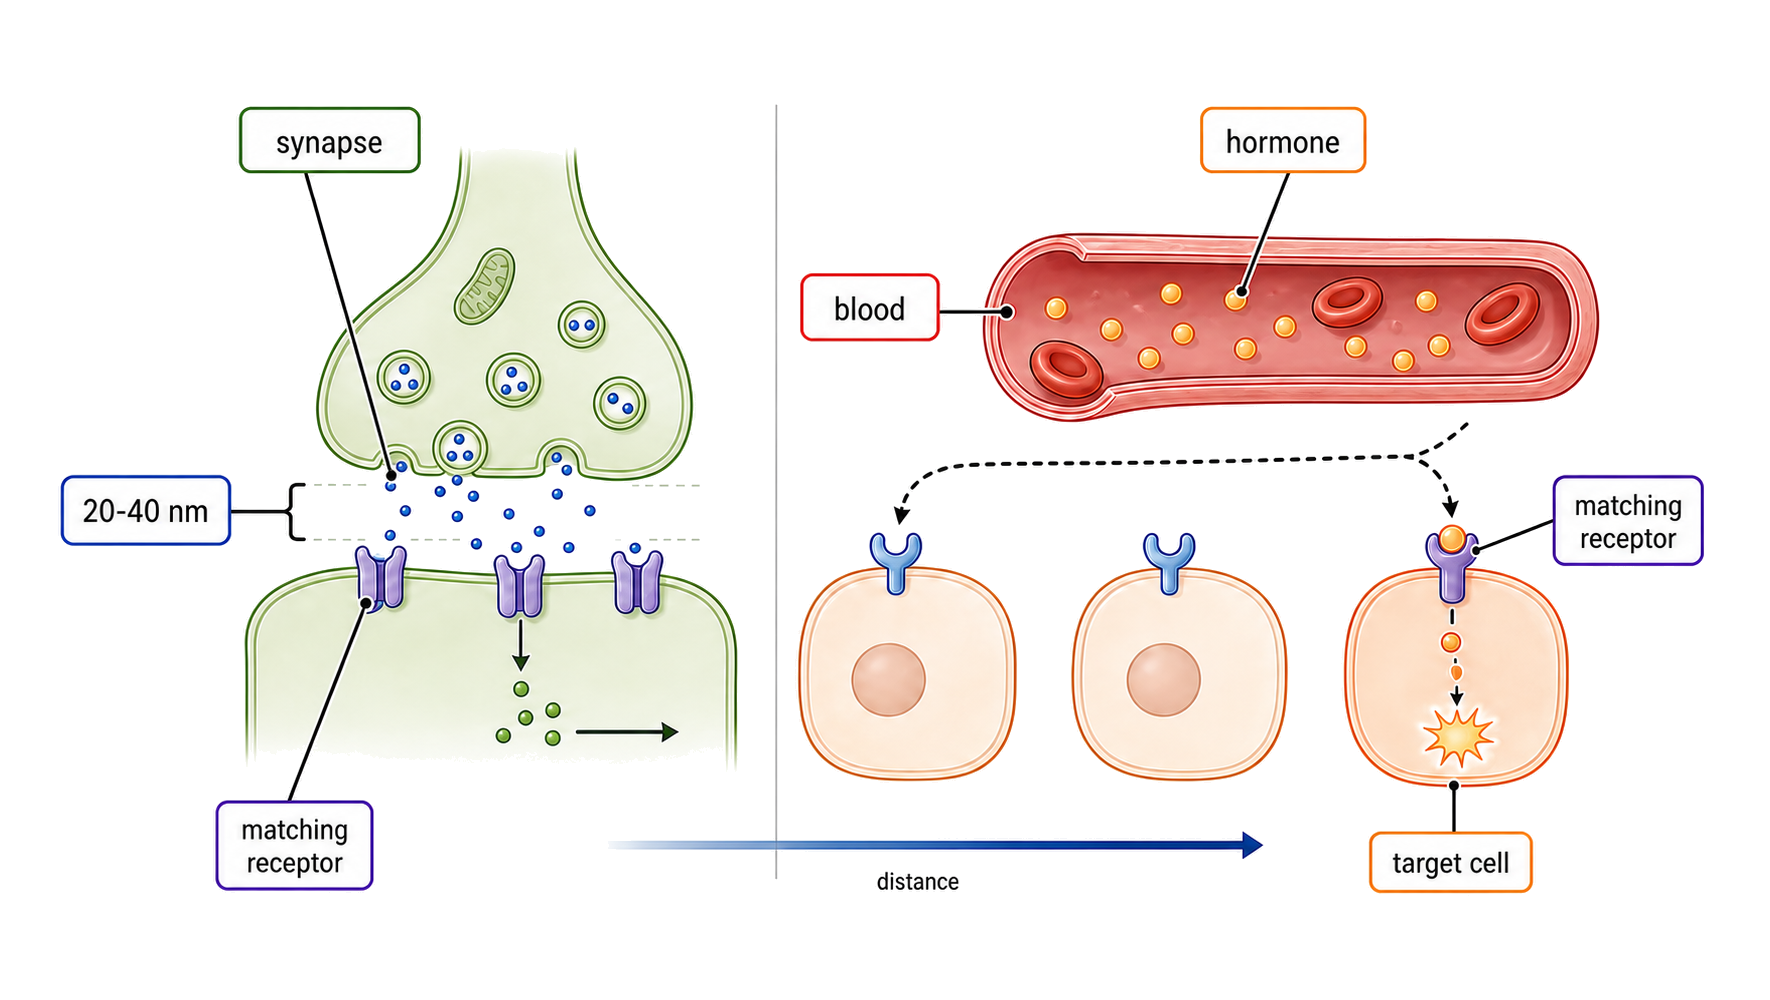
identify direction of effect; name trophic level; trace indirect consequences through the food web.

Removing a top predator can release herbivores and reduce plant biomass, while low nitrogen can limit the same web from below.

The labels describe control pathways, not a claim that one direction always dominates.
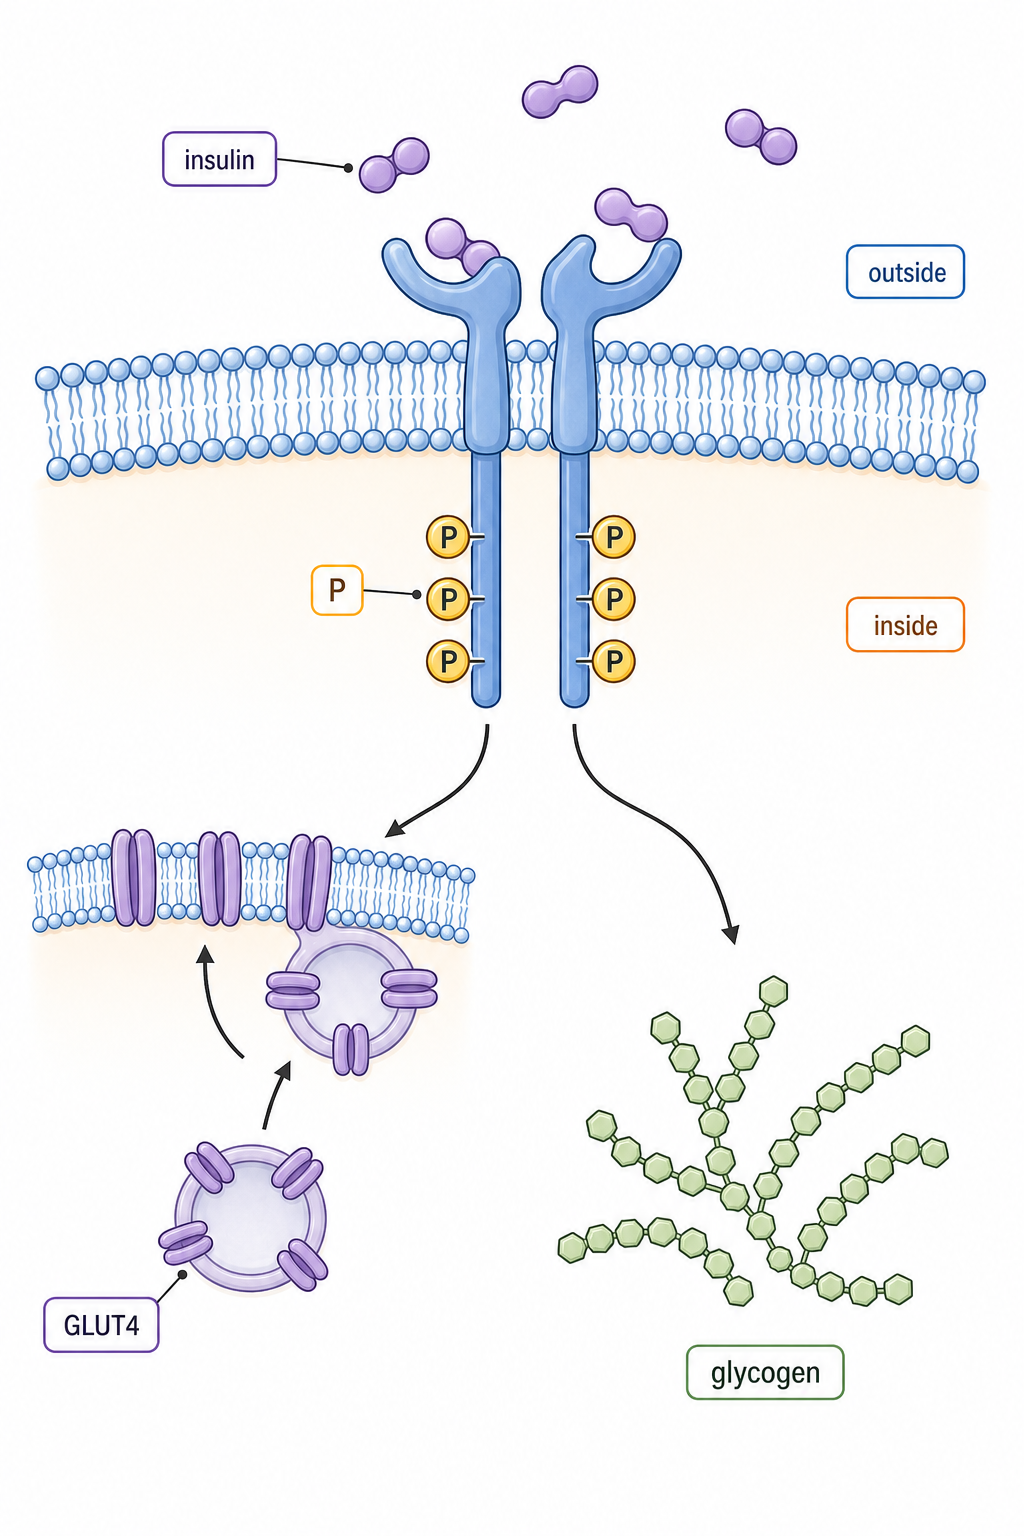
Top-down vs. bottom-up control
Assessment in practice

1–3 marks
How it is assessed

This objective is assessed through structured response, commonly using Explain / Describe / Identify.

Command terms

Explain / Describe / Identify / Outline

What earns marks

Build the answer around this relationship: Top-down versus bottom-up control must be linked to the correct ecological unit, method or species interaction.

Watch for

Confusing a population with a community or with all organisms in an ecosystem.

Representative question

Question 1

[Maximum number: 3]

Explain how nutrients can have a positive or negative bottom-up effect on seagrass.

Allelopathy and antibiotics are chemical interference

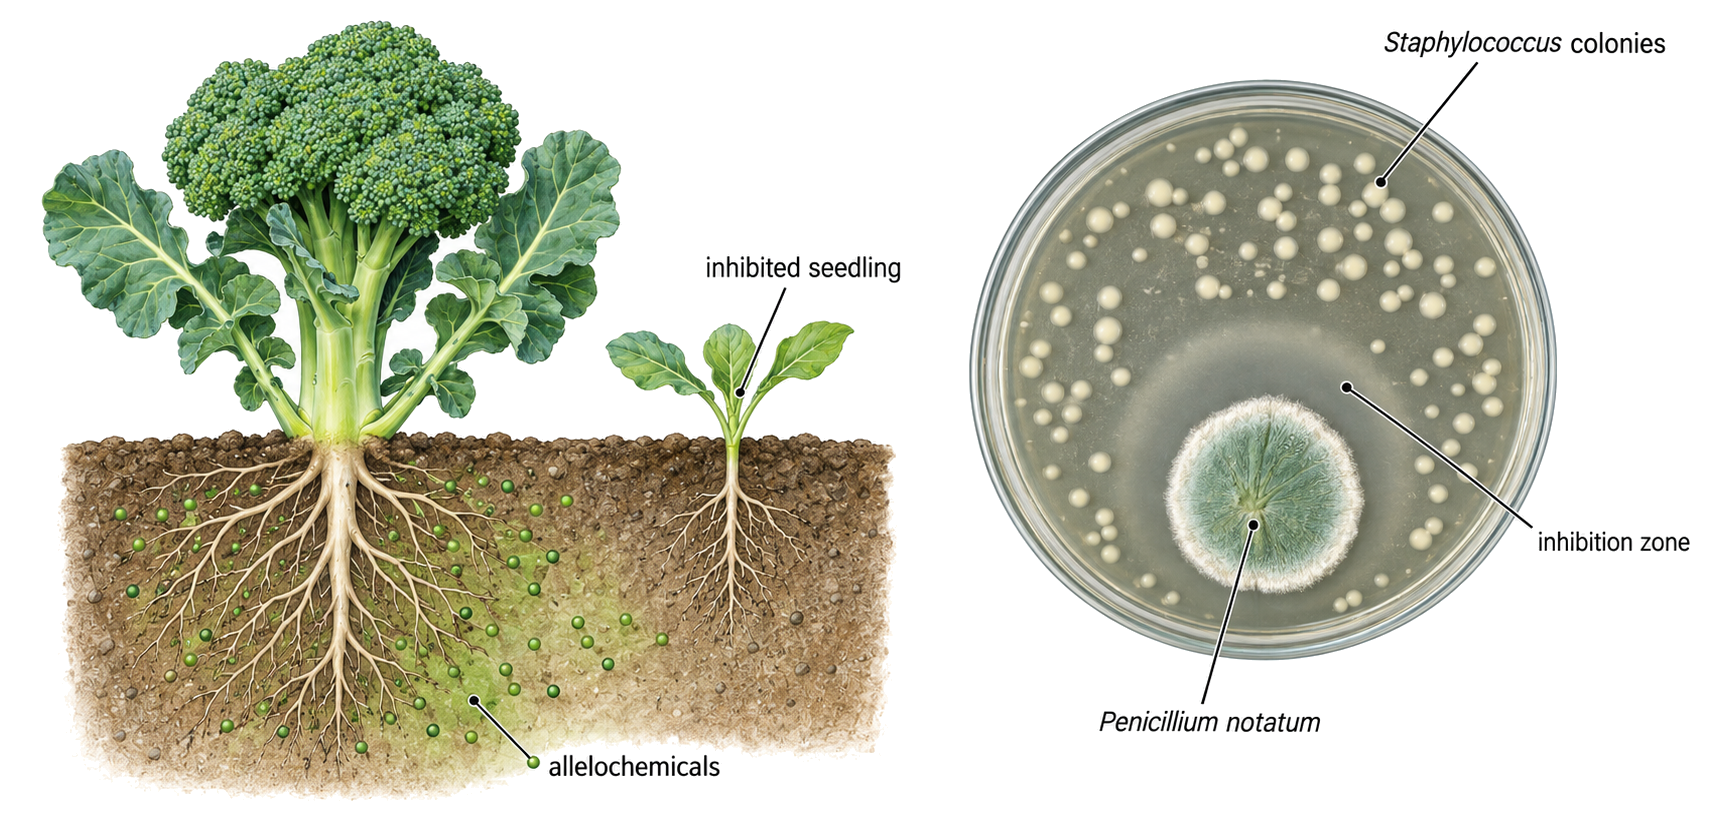
Allelopathy and antibiotics are chemical interference.

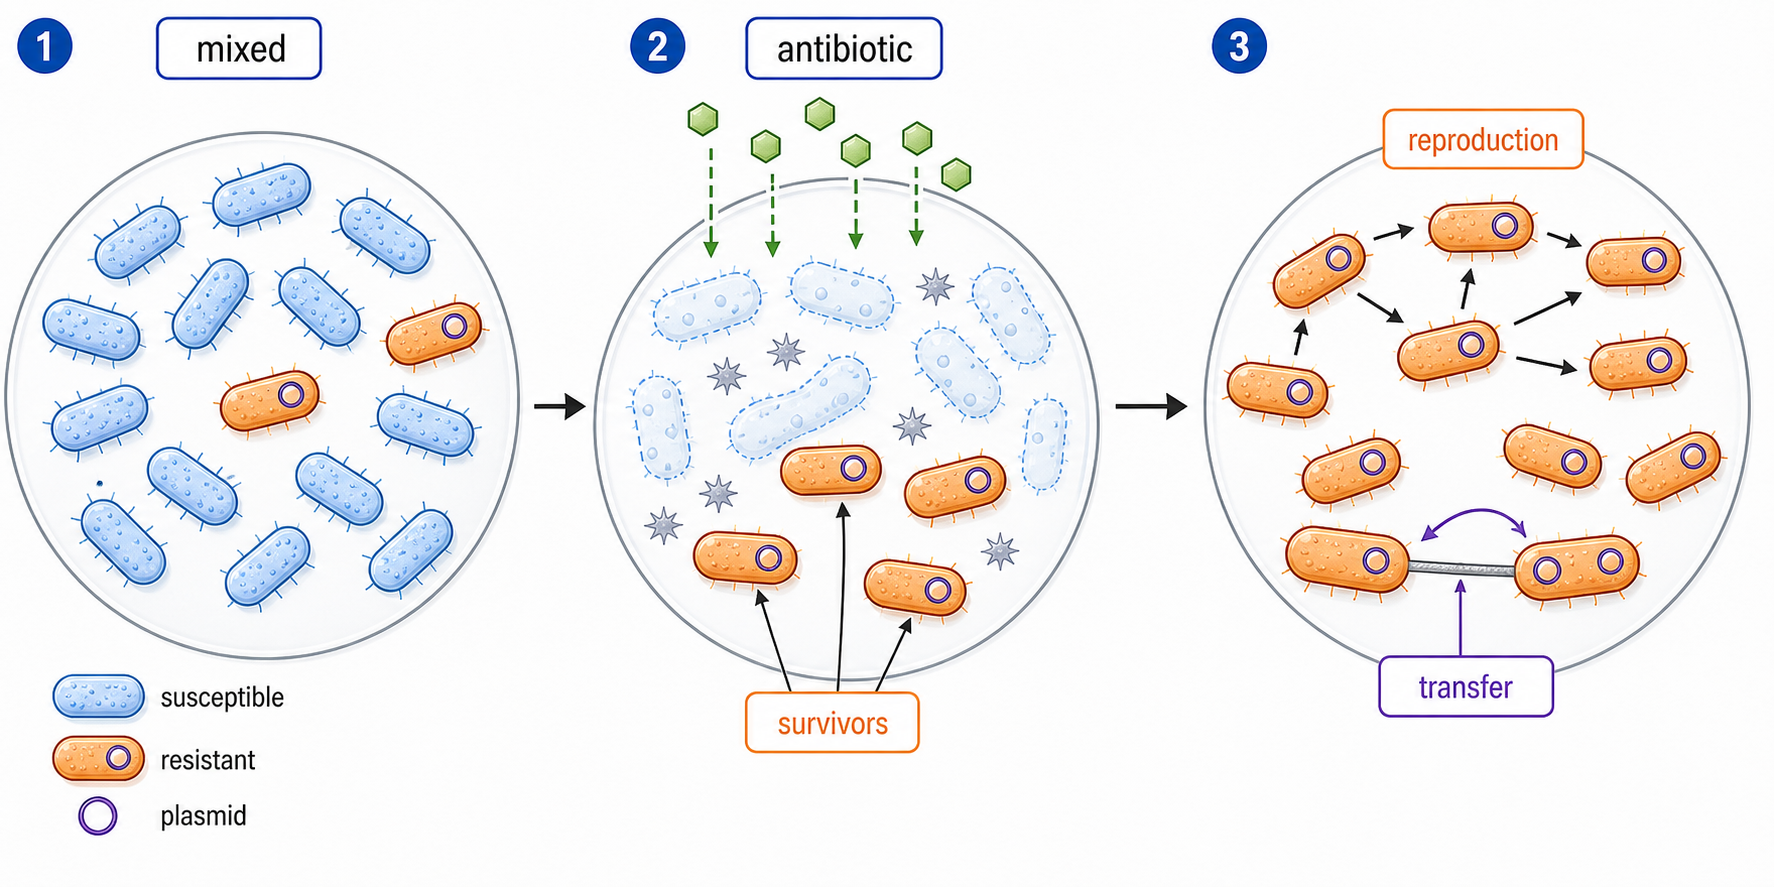
Some organisms release chemicals that inhibit competitors or microbes. The effect depends on dose, susceptibility, transport and environmental breakdown.

producer; chemical; target; inhibitory effect; environmental condition.

A plant root exudate can suppress germination of a neighbouring species, giving the producer an advantage where the compound persists.

A laboratory inhibition zone does not prove the same ecological effect at field concentration.

Allelopathy and antibiotics

Assessment in practice

1–3 marks
How it is assessed

This objective is assessed through structured response, commonly using Explain / Identify.

Command terms

Explain / Identify

What earns marks

Build the answer around this relationship: Allelopathy and antibiotics must be linked to the correct ecological unit, method or species interaction.

Watch for

Including abiotic factors in the definition of community instead of reserving them for ecosystem.

Representative question

Question 1

[Maximum number: 3]

Explain how a named plant can reduce competition by allelopathy.

Populations and Communities

  • A population is one species in an area; a community is all interacting populations there.
  • Estimate abundance with unbiased sampling: quadrats for sessile organisms and capture–mark–release–recapture for mobile animals, checking each method’s assumptions.
  • Density-dependent competition, predation, disease and waste create negative feedback around carrying capacity; exponential growth slows into a sigmoid curve as limits strengthen.
  • Classify interspecific relationships by costs and benefits: predation, herbivory, competition, mutualism, parasitism and pathogenicity.
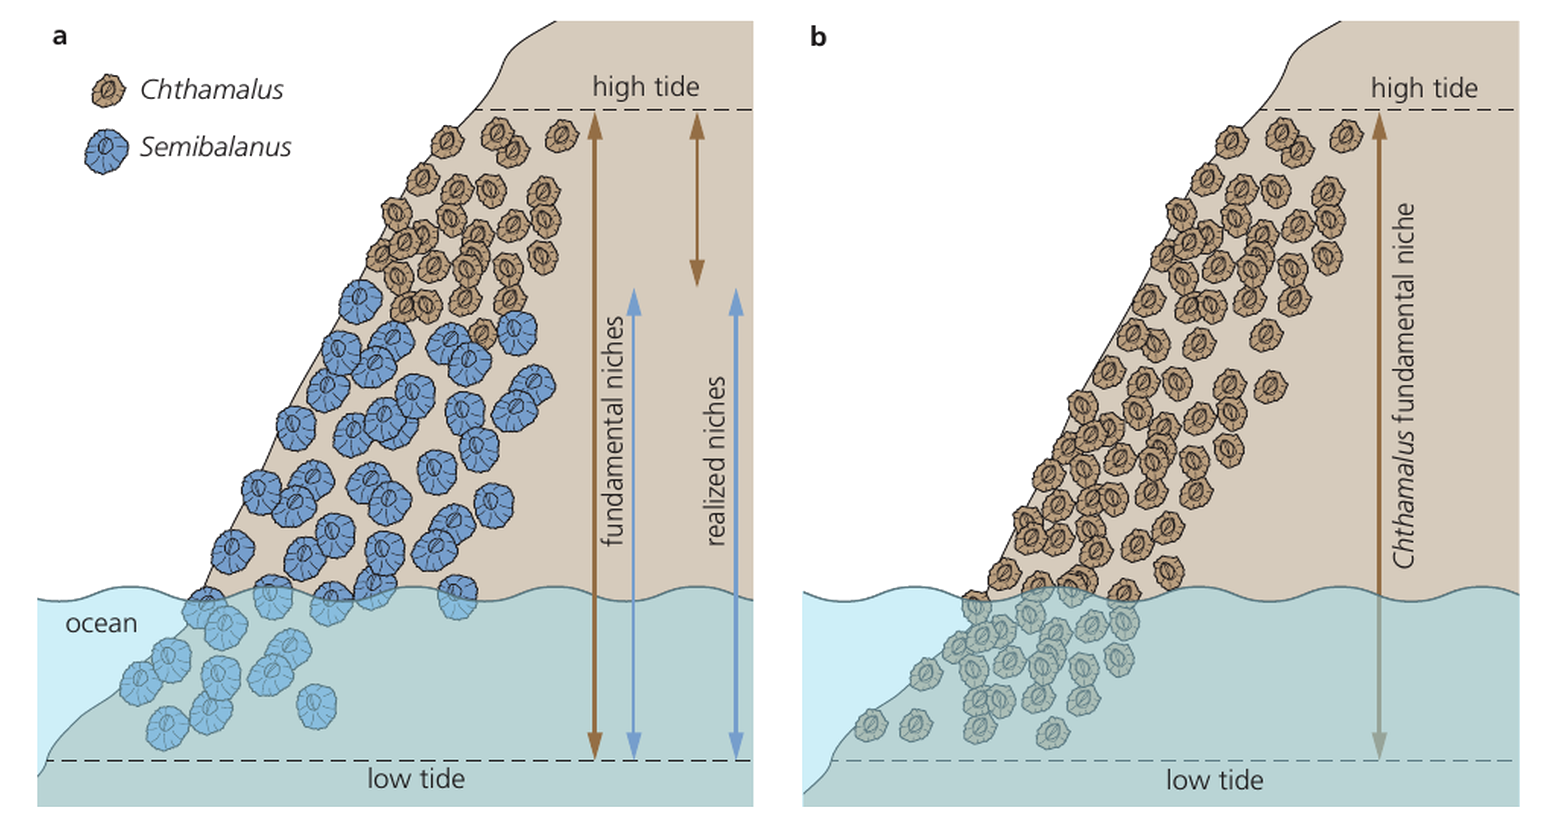
  • Invasive species may escape controls and displace endemic species. Removal experiments can reveal competition and fundamental versus realized niches.
  • Chi-squared tests assess species association from observed and expected quadrat counts.
  • Predator peaks usually lag prey peaks; top-down control begins with consumers, while bottom-up control begins with resources or producers.
ConceptIB Biology HL