IB Physics SL C.4.2 Nodes & antinodes
Practise locating nodes and antinodes, comparing phase, and sketching linked displacement-time graphs from standing-wave diagrams.
- Syllabus
- First assessment 2025
- Objective
- —
- Level
- SL
Practise locating nodes and antinodes, comparing phase, and sketching linked displacement-time graphs from standing-wave diagrams.
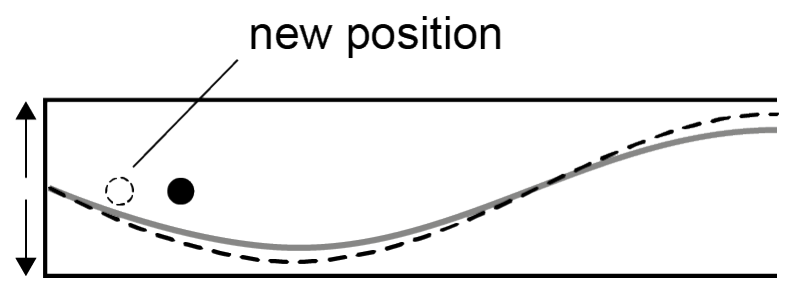
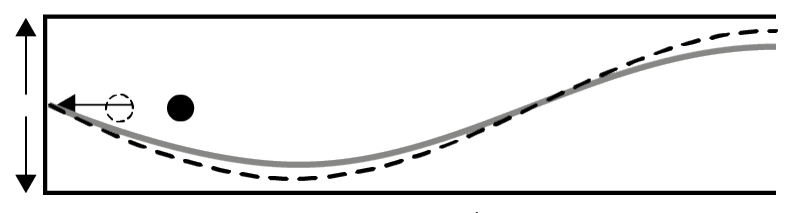
The solid line represents the standing wave at time t and the dotted line represents the standing wave at an instant later. The dot is the equilibrium position of a particle P in the pipe. The up arrow indicates displacements to the right and the down arrow displacements to the left.
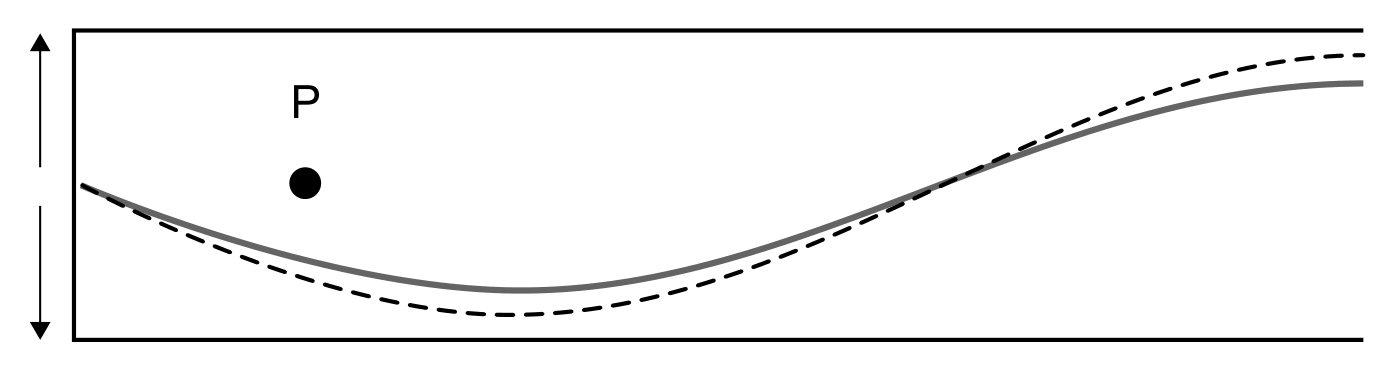
On the diagram, draw
a dot to indicate the approximate position of P at time t,
an arrow to indicate the velocity of P at time t.