C1.1 Enzymes and metabolism

Enzymes and metabolism explain how catalysts, active sites, reaction conditions and pathway regulation control cellular chemical reactions in living systems.
Syllabus
First assessment 2025
Topic
C1.1
Level
SL

Learning objectives

C1.1.1Enzymes as catalysts• Enzymes are mostly protein biological catalysts, with some RNA examples• They work in small amounts and remain unchanged after catalysisC1.1.2Role in metabolism• Metabolism is all enzyme-controlled chemical reactions in cells• Specific enzymes control which metabolic reactions occur and whenC1.1.3Anabolic and catabolic reactions• Anabolism builds complex molecules by condensation and requires energy• Catabolism breaks molecules by hydrolysis or oxidation and releases energyC1.1.4Enzymes as globular proteins• Enzymes are usually globular proteins with a small active-site pocket• The active site binds substrate, forms an ES complex, and catalyses reactionC1.1.5Induced-fit binding• Substrate binding induces shape changes in both enzyme and substrate• Induced fit aligns catalytic groups and raises substrate toward transition stateC1.1.6Molecular motion• Molecular motion brings substrates and active sites into collision• Higher kinetic energy increases successful active-site collisionsC1.1.7Relationships between structure and function• Active-site amino acid arrangement determines substrate specificity• Denaturation changes tertiary structure and active-site shape, not peptide bondsC1.1.8Effects on enzyme activity• Temperature increases rate to an optimum, then denaturation lowers activity• pH changes active-site bonding; substrate concentration rises to saturation plateauC1.1.9Measuring enzyme reactions• Measure substrate loss or product formation per unit time• Use initial rate, replicates, controls, and graphs from amylase or catalase assaysC1.1.10Effect of enzymes on activation energy• Enzymes lower activation energy by providing an alternative pathway• They stabilize transition states but do not remove the energy barrier

Enzymes Lower a Barrier; They Do Not Rewrite the Reaction

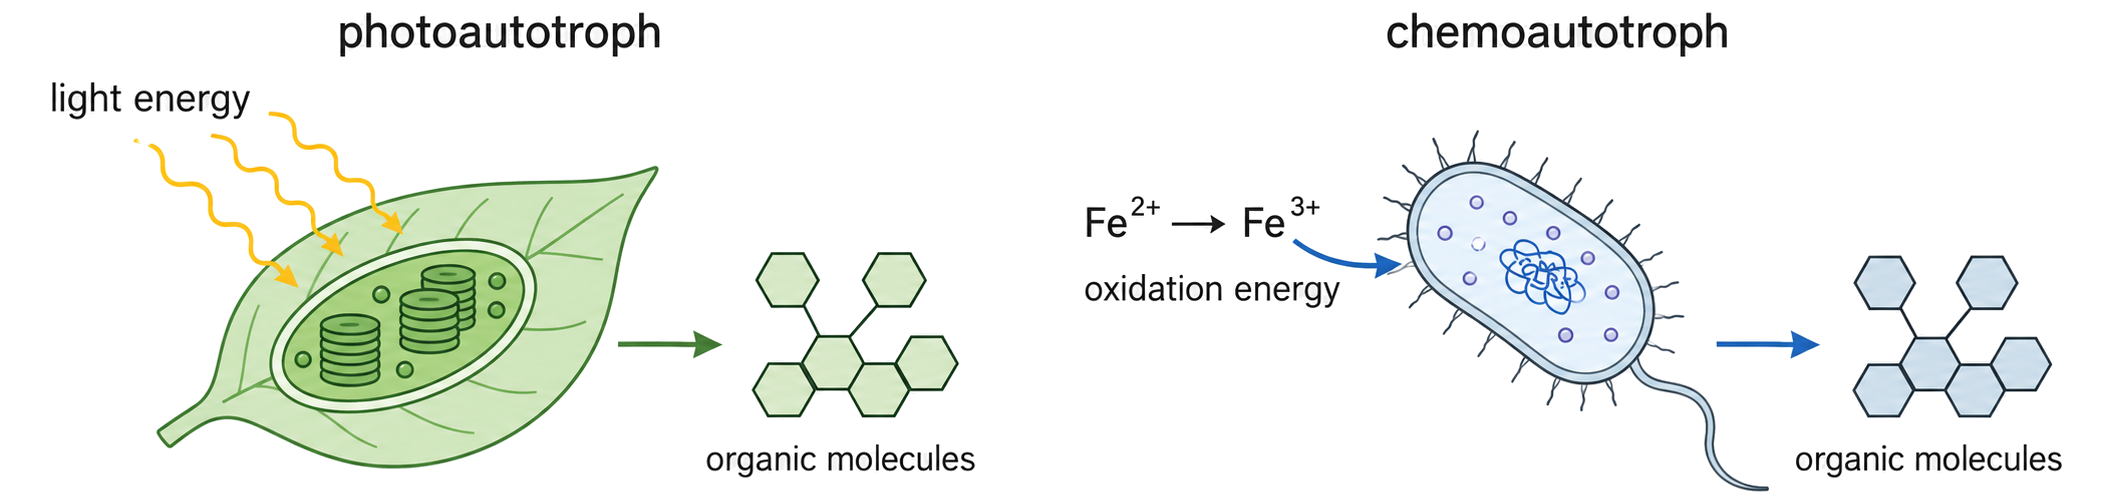
An enzyme is a biological catalyst. Most are proteins, although some RNA molecules also catalyse reactions. A small amount can act repeatedly because the enzyme emerges unchanged after products are released.
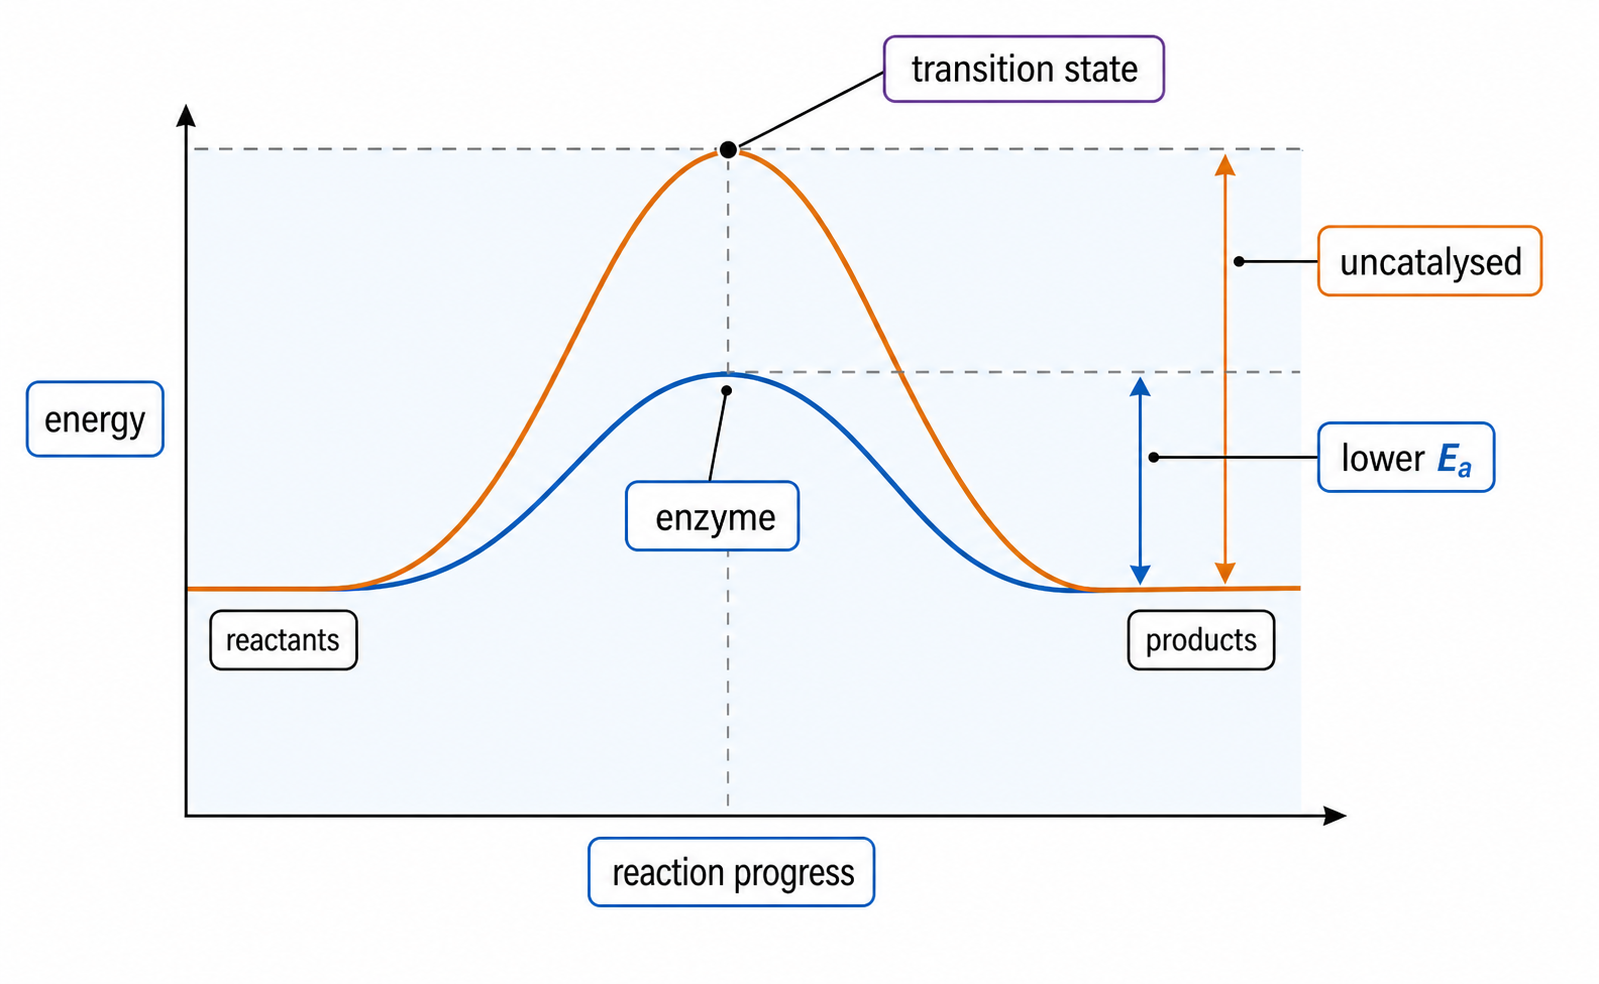
Energy profile comparing uncatalysed and enzyme-catalysed routes, with the enzyme route having a lower activation-energy peak.

The enzyme provides an alternative pathway with lower activation energy, so more collisions can reach the transition state at the same temperature. It does not change the reactants, products or overall free-energy difference, and it does not remove the barrier completely.

Metabolism Builds, Breaks and Transfers Energy

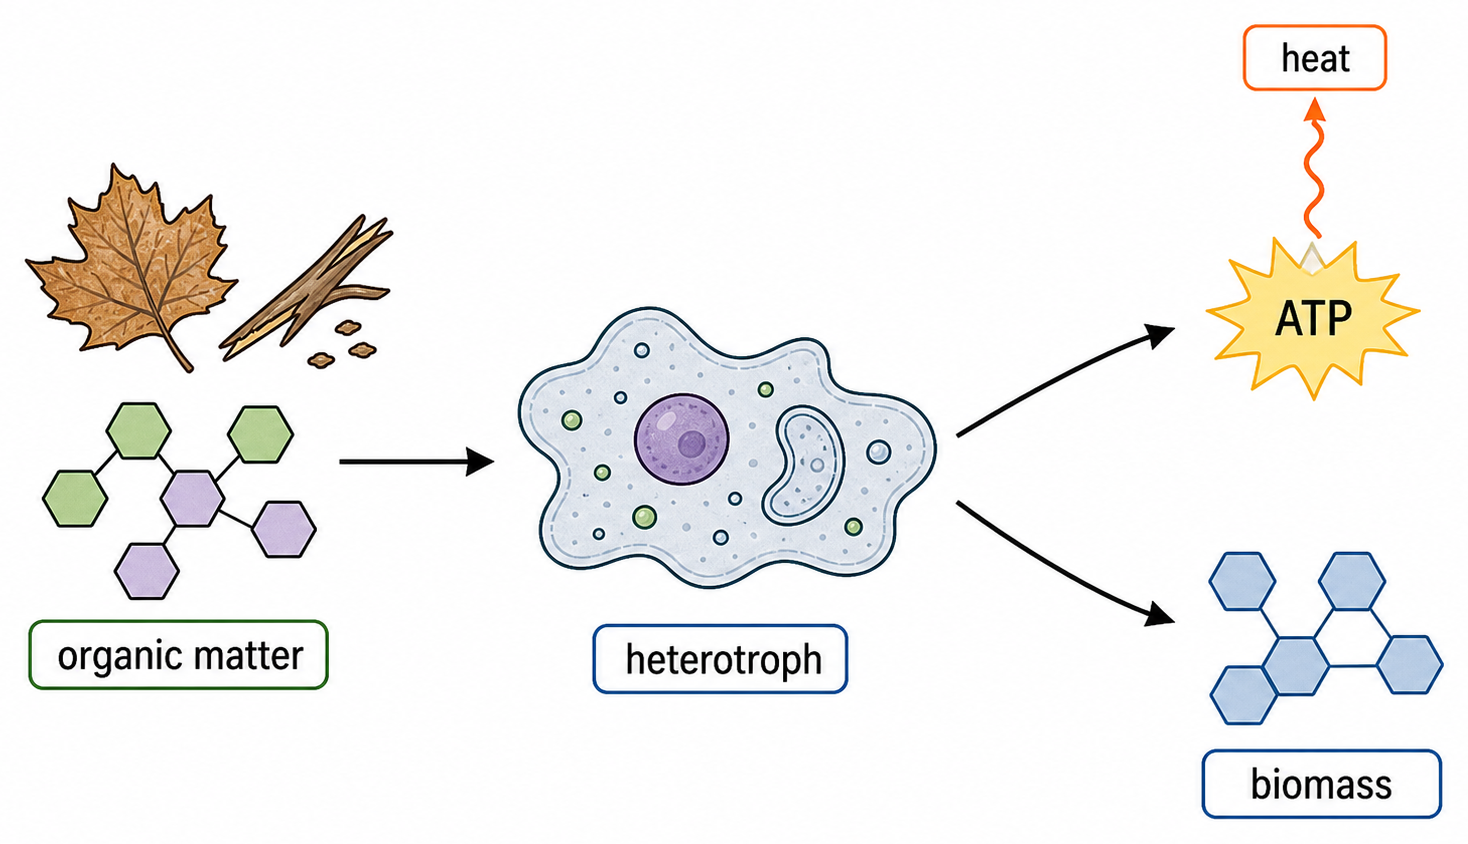
Metabolism is the complete set of enzyme-controlled reactions in a cell or organism. Because each step needs a particular enzyme, cells regulate which routes operate by controlling enzyme amount, activity and location.

Route Change in matter Typical chemistry Energy relationship
anabolism smaller units → larger, more complex molecules condensation and reduction requires an energy input
catabolism complex molecules → smaller products hydrolysis and oxidation releases usable energy

The two routes are coupled: catabolic reactions release energy and provide small molecules; anabolic reactions use both to build cell components. Respiration is mainly catabolic, while protein synthesis is anabolic.

A Small Active Site Runs a Reusable Catalytic Cycle

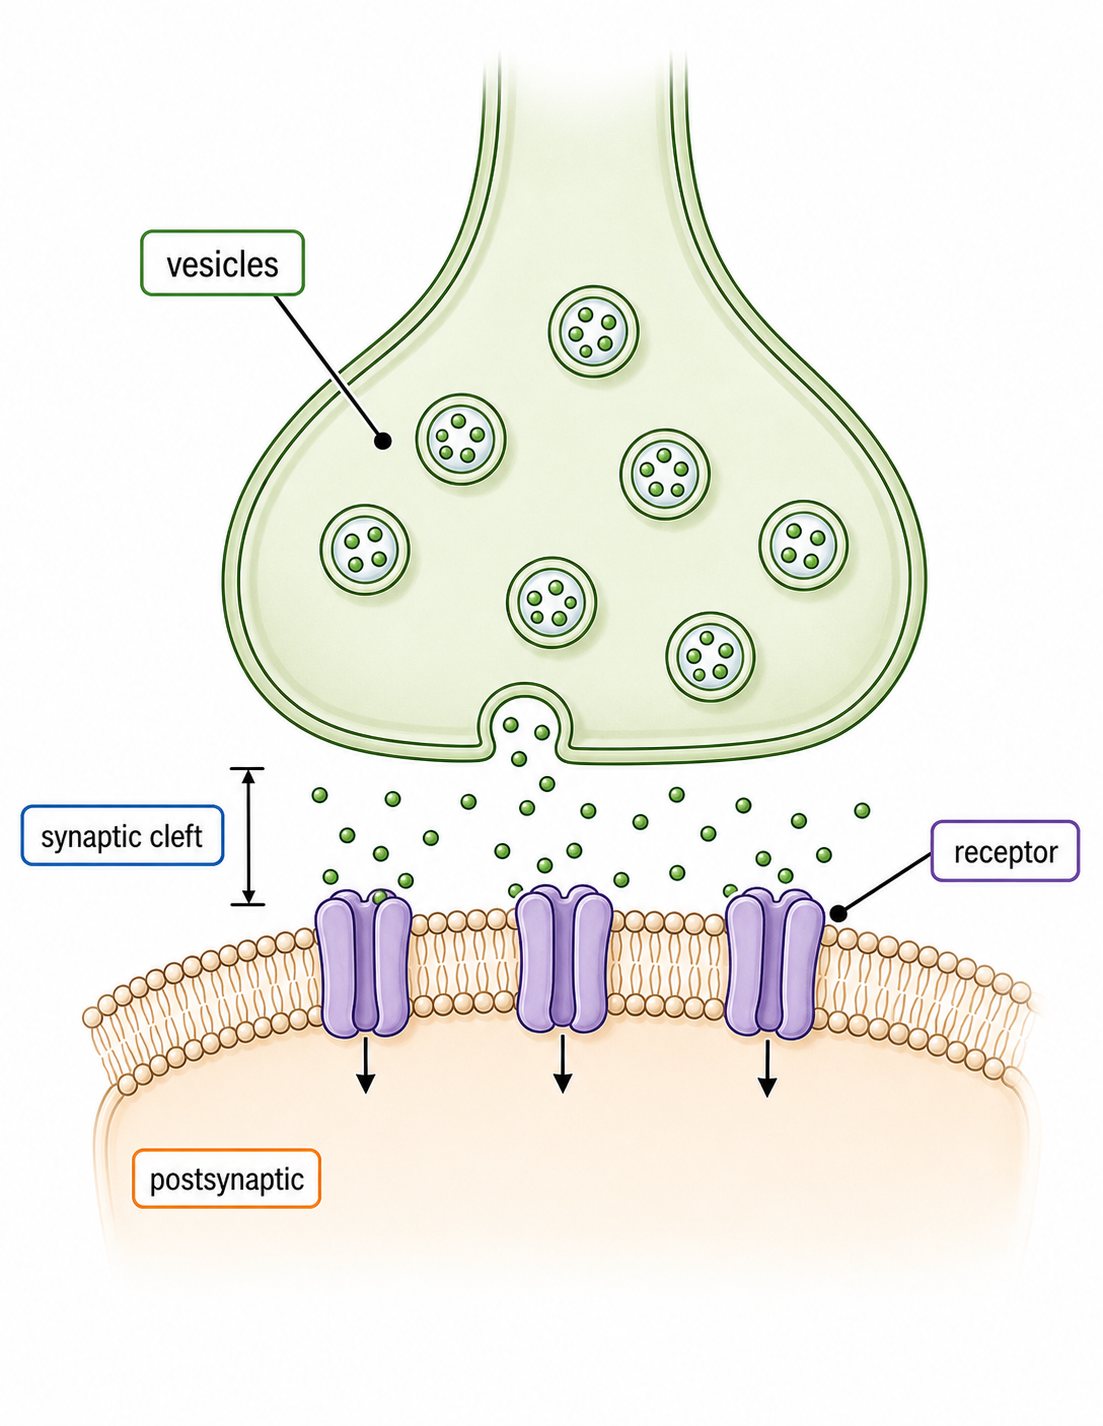
A typical enzyme is a globular protein. Folding brings particular amino-acid side chains together to form a small active-site pocket; most of the protein maintains the three-dimensional environment that makes this pocket work.

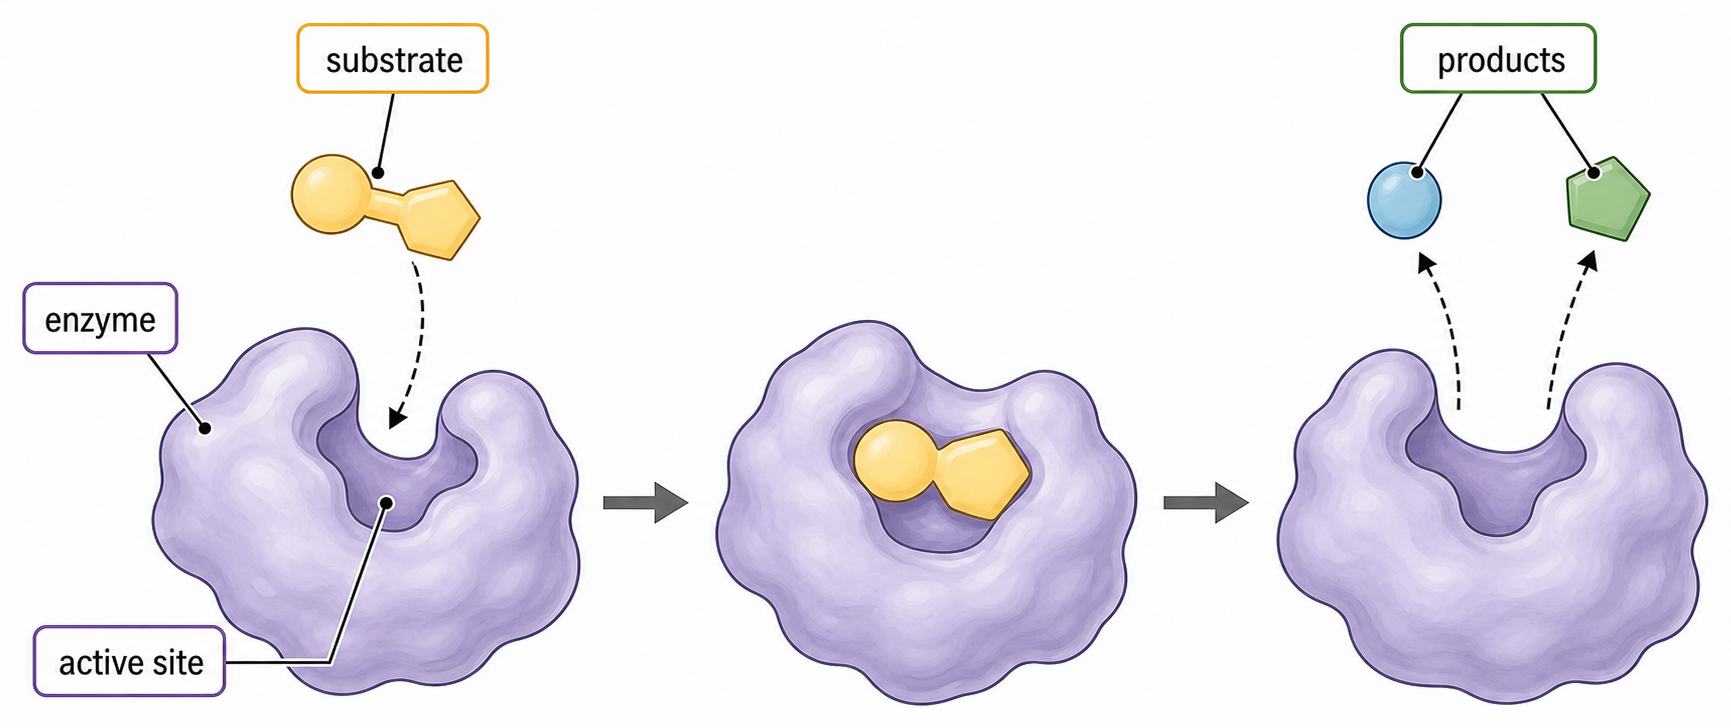
Three-stage diagram showing substrate entering an enzyme active site, an enzyme-substrate complex, and products leaving the unchanged enzyme.
1

Substrate collides with and binds to the active site.

2

A short-lived enzyme–substrate complex forms and catalysis occurs.

3

Products no longer fit in the same way, so they leave; the enzyme can bind another substrate.

Induced Fit Makes Binding Catalytic

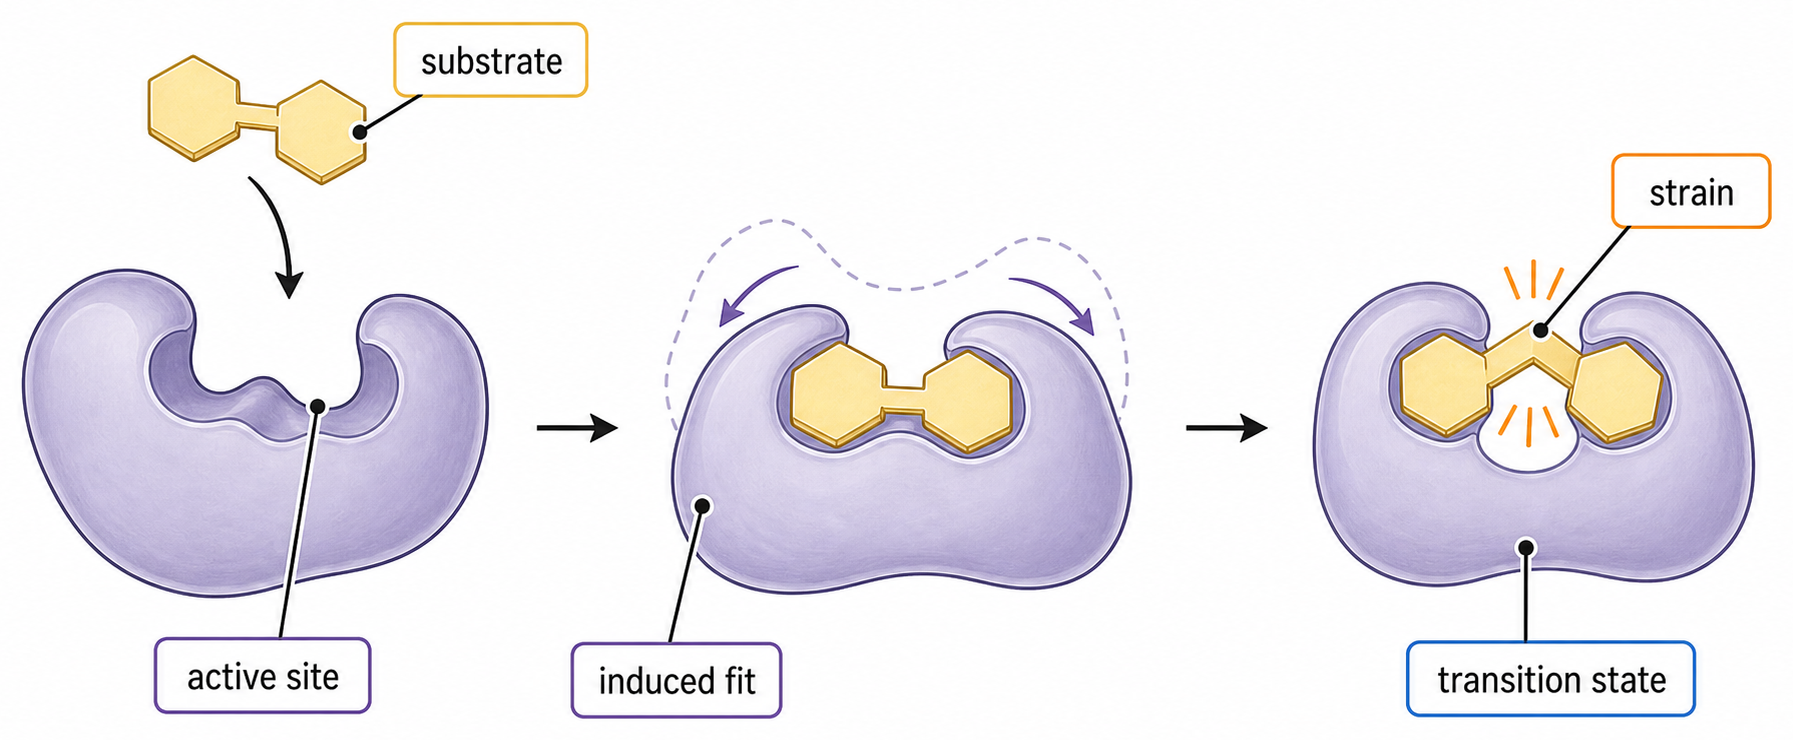
The active site is flexible, not a rigid lock. Initial contact with the correct substrate changes the conformation of both enzyme and substrate: this is induced fit.

Sequence showing substrate approach, induced-fit closure and substrate strain toward the transition state.

Induced fit can:

  • align catalytic groups with the bonds that must change
  • strain or polarize bonds in the substrate
  • stabilize the transition state

These effects lower the activation energy; complementary shape alone does not explain catalysis.

Read Enzyme-Rate Curves as Molecular Stories

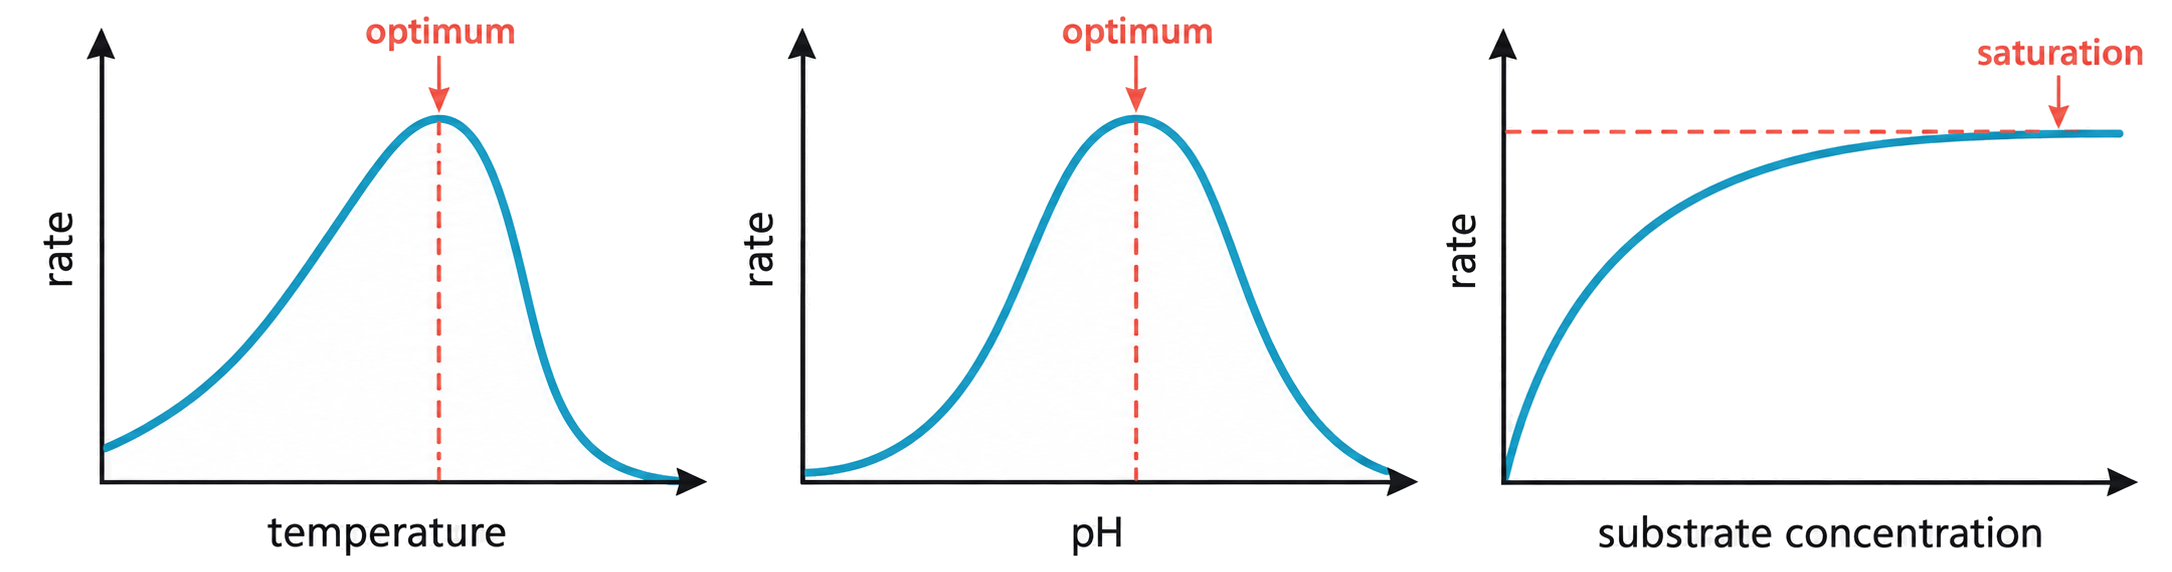
Three graphs showing enzyme rate against temperature, pH and substrate concentration, with optima and a saturation plateau labelled.
Curve feature Molecular explanation
temperature rises toward an optimum faster molecular motion gives more frequent energetic substrate–active-site collisions
temperature falls beyond the optimum heat increasingly disrupts the enzyme's tertiary structure and active sites are lost
pH has an optimum range changing H⁺ concentration alters charges and bonding that maintain active-site shape
substrate curve reaches a plateau nearly all active sites are occupied; enzyme concentration now limits turnover

An optimum is the condition giving the highest measured rate for that enzyme under that experiment. It is not a universal temperature or pH shared by all enzymes.

Specificity Depends on a Fold That Can Be Lost

An enzyme is specific because the active site's three-dimensional arrangement of shape, charge and chemical groups permits productive binding of only particular substrate molecules.

High temperature or extreme pH can disrupt hydrogen bonds, ionic interactions and other weak forces that maintain tertiary structure. The active site changes shape or charge, so the substrate no longer binds productively: the enzyme is denatured.

Denaturation does not normally hydrolyse the peptide bonds of the primary structure. Moderate pH effects may be reversible when the original bonding pattern reforms; severe heating commonly causes irreversible aggregation or misfolding.

Substrate Raises Rate Only Until Enzyme Capacity Is Full

Substrate concentration Active-site occupancy Effect of adding substrate
low many active sites are free collision frequency and rate rise almost proportionally
intermediate active sites are occupied more often rate still rises, but by smaller increments
high nearly every active site is continually occupied rate approaches a maximum and extra substrate has little effect

The plateau is not caused by substrate molecules stopping. It appears because a fixed number of enzyme molecules can process only a limited number of substrates per unit time.

At saturating substrate concentration, increasing enzyme concentration adds active sites and can raise the maximum rate, provided substrate remains in excess.

Initial Rate Captures the Reaction Before Conditions Drift

Reaction rate is measured as substrate disappearance or product formation per unit time. In a catalase assay, oxygen production is convenient; in an amylase assay, disappearance of starch can be timed with iodine.

Catalase assay apparatus in a water bath, with yeast added to hydrogen peroxide and oxygen bubbles carried through a delivery tube for measurement.

initial rate=ΔproductΔt=−ΔsubstrateΔt\text{initial rate}=\frac{\Delta \text{product}}{\Delta t}=-\frac{\Delta \text{substrate}}{\Delta t}

Use the gradient of a tangent at the start of a product–time curve. Later rates are lower because substrate is depleted, products accumulate or conditions change, so comparing arbitrary final amounts can be misleading.

A Rate Difference Is Useful Only If the Test Is Fair

Design decision Example for testing temperature on amylase Why it matters
independent variable water-bath temperature defines the factor being tested
dependent variable time for starch to disappear; convert to relative rate, 1/t produces a comparable rate measure
controlled variables pH, enzyme and starch concentrations and volumes prevents alternative causes of a rate change
negative control starch plus water without enzyme checks that loss of starch requires enzyme activity

Pre-incubate enzyme and substrate separately to the chosen temperature, mix to start the reaction, sample at fixed intervals, and use the same endpoint rule each time.

Repeat each condition, calculate a mean and inspect variation. An anomalous result should be investigated, not silently removed; uncertainty in timing, temperature and volume limits the precision of the conclusion.

SL Checkpoint: Explain the Curve, Not Just Its Shape

globular fold → active-site chemistry → induced fit → lower activation energy → faster turnover → controlled metabolic pathways

When explaining a rate pattern, identify what changed, then connect it to:

  • molecular motion and successful collisions
  • active-site occupancy
  • active-site shape and charge
  • depletion or changing conditions during measurement

A strong investigation measures initial rate, changes one independent variable, controls alternatives, includes a relevant control and uses repeats to reveal variation.

Enzymes as catalysts

3 marks

Explain how enzymes catalyse chemical reactions.

Role in metabolism

4 marks

Explain the role of enzymes in metabolic pathways.

Anabolic and catabolic reactions

2 marks

Identify the following processes as either anabolism or catabolism by placing a tick ( ✓ ) in the correct box.

ProcessAnabolismCatabolism
Light-independent reactions of photosynthesis□\square□\square
Glycolysis□\square□\square

Enzymes as globular proteins

1 mark

State a role of the active site of an enzyme.

Induced-fit binding

6 marks

Describe the lock and key model of enzyme activity and how the induced fit model extends it.

Molecular motion

1 mark

Which statement applies to enzymes?

Relationships between structure and function

6 marks

Some proteins in membranes act as enzymes. Outline enzyme-substrate specificity.

Effects on enzyme activity

8 marks

Explain the effect of changes of pH , substrate concentration and temperature on enzyme activity.

Measuring enzyme reactions

3 marks

Suggest how the percentage of decolorization could be obtained experimentally.

Effect of enzymes on activation energy

1 mark

The graph shows energy changes during a reaction both with and without an enzyme present.

Which statement correctly identifies two of the regions labelled X, Y and Z in the graph?