D4.3 Climate change

Climate change affects ecosystems through greenhouse-gas forcing, feedback cycles, habitat shifts, coral stress, phenology changes, and evolutionary responses across many environments.

Syllabus
First assessment 2025
Topic
D4.3
Level
HL

Learning objectives

D4.3.1Anthropogenic causes• Human activities increase atmospheric CO₂, methane, and other greenhouse gases• Fossil fuels, cement, agriculture, deforestation, and land-use change are major sourcesD4.3.2Positive feedback cycles• Positive feedback amplifies warming after an initial climate change• Examples include ice-albedo loss, permafrost methane, ocean CO₂ release, and wildfire feedbackD4.3.3Boreal forest tipping point• Boreal forests can shift from carbon sinks to carbon sources• Warming, drought, reduced snowfall, browning, insects, and fire increase tipping-point riskD4.3.4Polar habitat changes• Melting landfast ice and sea ice alters breeding, feeding, and resting habitat• Emperor penguins and walruses illustrate species dependent on ice timing and extentD4.3.5Ocean current changes• Ocean warming strengthens stratification and can reduce nutrient upwelling• Reduced upwelling lowers phytoplankton productivity and food supplyD4.3.6Range shifts• Species ranges can shift poleward, upslope, or contract as climate zones move• Montane birds and North American tree species show changing distribution limitsD4.3.7Coral reef threats• Warming causes coral bleaching by disrupting coral-zooxanthellae mutualism• Ocean acidification suppresses calcification, threatening reef biodiversity and collapseD4.3.8Carbon sequestration approaches• Carbon sequestration captures and stores atmospheric carbon dioxide• Afforestation, agroforestry, forest regeneration, and peatland rewetting increase carbon storesD4.3.9(HL)—Phenology• Phenology studies timing of seasonal biological events• Events include flowering, budburst, migration, nesting, breeding, and insect emergenceD4.3.10(HL)—Disruption of phenological synchrony• Climate change can desynchronize interacting species that rely on matched timing• Arctic plant-reindeer migration and great tit-caterpillar peaks are key examplesD4.3.11(HL)—Increased insect life cycles• Warmer temperatures can shorten insect development and add generations per year• Spruce bark beetles can shift from one to two annual attack periodsD4.3.12(HL)—Evolution from climate change• Climate change alters selection pressures and can shift phenotype frequencies• Finnish tawny owl colour change links milder winters, snow cover, and survival

Climate Is a Long-Term Pattern; Weather Is a Short-Term State

Weather Climate
atmospheric conditions at a particular time and place statistical pattern of weather over decades, commonly 20–30 years or longer
one storm, heatwave or cold day changing averages, ranges, seasonality and frequency of extremes

Climate change is a sustained change in global or regional climate patterns. One unusual day cannot establish it; long time-series evidence can.

Natural climate drivers exist, but the rapid warming since the mid-to-late twentieth century is primarily attributed to human-driven increases in greenhouse gases.

The Natural Greenhouse Effect Retains Some Outgoing Infrared Energy

  1. Most incoming shortwave solar radiation passes through the atmosphere.
  2. Land and ocean absorb energy and warm.
  3. The warm surface emits longwave infrared radiation.
  4. Greenhouse gases absorb specific infrared wavelengths.
  5. Re-emission sends energy in all directions, including back toward the surface.

The natural greenhouse effect makes Earth habitable. Enhanced greenhouse effect means that added greenhouse gases increase infrared retention and raise global mean temperature.

Shortwave solar radiation reaches and warms Earth; the surface emits longer-wave infrared radiation, some of which greenhouse gases absorb and re-emit in all directions.

Human Activities Add Greenhouse Gases Faster Than Sinks Remove Them

Human activity Main climate link
fossil-fuel combustion transfers geologically stored carbon to atmospheric CO₂
cement production releases CO₂ during fuel use and conversion of limestone
deforestation and land-use change releases biomass carbon and removes photosynthetic uptake
cattle, rice cultivation and waste add methane from anaerobic microbial processes
fertilizer and combustion processes add nitrous oxide and other greenhouse gases

Photosynthesis and other sinks remove much of the emitted CO₂, but not all of it. The remaining annual surplus accumulates in the atmosphere.

Methane absorbs infrared strongly per unit mass but is less abundant and shorter-lived than CO₂. Climate contribution depends on radiative properties, concentration and atmospheric lifetime together.

Multiple Lines of Evidence Link Recent Warming to Human Forcing

Evidence What it establishes
ice-core gas bubbles and oxygen isotopes past greenhouse-gas concentrations and temperature proxies covaried over long timescales
modern atmospheric measurements CO₂ now lies above the range recorded across recent glacial cycles and is rising rapidly
carbon sources and budget fossil fuels, cement and land-use change supply the added carbon
radiative physics and climate models added greenhouse gases produce the observed direction and scale of warming

Correlation in an ice-core graph alone does not prove causation. The causal conclusion comes from converging physical, chemical, historical and modelling evidence.

Orbital cycles initiated past glacial changes, with ice and greenhouse feedbacks amplifying them. That does not explain the current rapid greenhouse-gas increase from measured human sources.

Positive Feedback Amplifies an Initial Climate Change

A positive feedback produces a response that reinforces the original change, moving the system farther from its starting state.

  1. An initial forcing raises temperature.
  2. A temperature-sensitive component changes.
  3. That change increases heat absorption or adds greenhouse gas.
  4. The additional warming strengthens the same component change.

Positive means self-reinforcing, not beneficial. The feedback amplifies a forcing; it need not be the event that began the warming.

Four Feedback Loops Return to More Warming

Temperature-sensitive change Reinforcing step
ice melts darker surface lowers albedo and absorbs more solar energy
permafrost thaws decomposition releases methane and CO₂
ocean warms CO₂ solubility falls and carbon release can increase
drought and fire increase combustion releases CO₂ and removes carbon sinks

Warmer air can also contain more water vapour, itself a greenhouse gas, adding another reinforcing response.

The strength and timing of each feedback differ. Biological uptake and circulation can modify ocean carbon behavior, so a valid explanation states the mechanism without pretending every loop has one certain magnitude.

Four circular pathways connect warming to more warming through ice loss and lower albedo, permafrost thaw and greenhouse-gas release, reduced ocean carbon retention, and drought with wildfire.

A Boreal Forest Is a Carbon Sink Only while Uptake Exceeds Release

Carbon gain Carbon loss
photosynthesis and tree growth plant and microbial respiration
carbon stored in wood and litter decomposition of litter and thawed soil carbon
accumulation in cold or waterlogged soils combustion during peat and forest fires

net sink: uptake > release → ecosystem carbon store grows
net source: release > uptake → ecosystem carbon store shrinks and atmospheric carbon rises

A forest can remain visibly wooded while switching from sink to source. The classification depends on the net carbon balance, not tree presence alone.

Warming Can Push Boreal Forests into a Self-Reinforcing Carbon-Loss State

  1. Warmer winters and reduced snowfall alter soil insulation and water supply.
  2. Drought stress and heat reduce growth and cause forest browning.
  3. Insects, tree mortality and fire increase.
  4. Combustion and decomposition release biomass and soil carbon.
  5. Permafrost thaw exposes additional carbon to decomposition.
  6. Extra CO₂ and methane reinforce warming, drought and fire risk.

The tipping point is crossed when repeated carbon loss and impaired recovery maintain a net-source state instead of returning to net accumulation.

The relevant evidence must combine carbon fluxes, tree growth, mortality, fire and soil thaw through time; one photograph of a burned forest cannot establish the budget shift.

Sea Ice and Landfast Ice Create Different Polar Habitat Functions

Ice habitat Ecological function Climate-sensitive change
mobile pack or sea ice resting platform near offshore feeding grounds reduced extent and longer ice-free seasons
landfast ice attached to coast or seabed stable breeding and chick-rearing platform earlier breakout before breeding is complete
seasonal ice edge concentrates prey and structures access to food timing and location shift

Melting floating sea ice does not directly raise sea level like melting land ice, but it can transform habitat, food access and albedo.

Walruses and Emperor Penguins Depend on Ice at Different Life Stages

Species Ice dependency Consequence of earlier or reduced ice
walrus adults and calves rest on sea ice between benthic feeding dives longer travel, crowded land haul-outs and reduced safe resting habitat
emperor penguin colonies breed and rear chicks on stable Antarctic landfast ice early breakout can remove the platform before chicks are ready to survive at sea

Extent and timing both matter. The same total ice area at the wrong season or in the wrong location may not supply the required habitat function.

An adult female Atlantic walrus and juvenile rest on pack ice surrounded by open water in the Arctic.

Surface Warming Strengthens Stratification and Weakens Upwelling

  1. Surface water warms and becomes less dense relative to deeper water.
  2. The density difference strengthens stratification.
  3. Vertical mixing and nutrient-rich upwelling weaken or shift in timing.
  4. Fewer nitrate and phosphate ions reach the sunlit layer.
  5. Phytoplankton primary production falls where nutrients become limiting.

Upwelling also depends on winds, coastline and circulation. Warming can alter its timing and extent; it does not impose one identical response in every ocean region.

Normal upwelling brings cold nutrient-rich deep water into the sunlit surface layer; warming strengthens stratification, reduces mixing, lowers surface nutrients and weakens the food chain.

Reduced Upwelling Propagates from Phytoplankton through Marine Food Webs

  1. Lower surface nutrients limit phytoplankton growth.
  2. Less producer biomass feeds fewer zooplankton.
  3. Fish recruitment and biomass can fall as prey supply declines.
  4. Seabirds, marine mammals and fisheries receive less energy from the food web.

Phytoplankton also fix CO₂. Changes in production and sinking organic matter can alter biological carbon transfer to the deep ocean, linking food webs to climate feedback.

A predator decline alone does not prove reduced upwelling. Test the chain with current, nutrient, chlorophyll or phytoplankton, zooplankton and consumer data over time.

Species Track Moving Climate Zones Poleward and Upslope

Range boundary Response to warming
warm or equatorward/low-elevation edge local populations decline or disappear as tolerance is exceeded
cool or poleward/upper edge colonization can extend the range if habitat and dispersal allow
mountaintop or coastline barrier available climate space contracts because no farther suitable area exists

A range shift is a population-distribution change, not an individual animal choosing to evolve. Movement, establishment and local extinction together redraw the range.
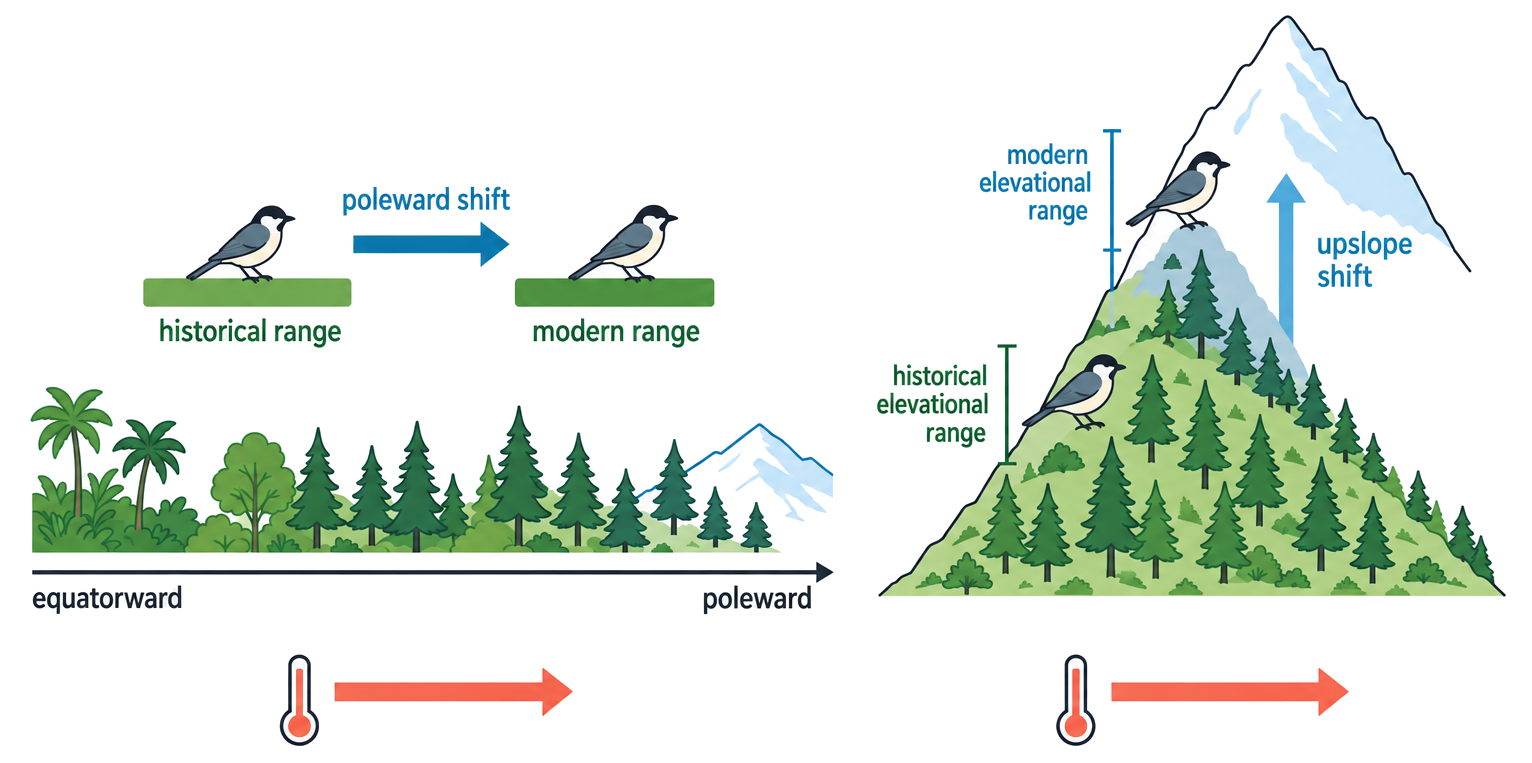
A map and mountain cross-section show a temperate species shifting poleward and a montane bird shifting upslope as its modern climate envelope moves.

Climate Space Can Move Faster Than Species Can Track It

Tracking requirement Possible barrier
dispersal seeds, juveniles or adults move too slowly
connected habitat farms, cities or fragmented forest block movement
suitable soil and partners climate arrives without pollinators, hosts or substrate
population growth colonists fail to establish at the new edge

Repeated surveys can compare historical and modern upper and lower limits. Consistent upslope or poleward shifts across many species strengthen the climate interpretation, while species-specific exceptions reveal other controls.

Tree saplings may shift faster than mature-tree distributions because adult trees persist long after recruitment conditions change. Range contraction can occur even while old individuals remain.

Coral Reefs Depend on a Temperature-Sensitive Mutualism

Coral supplies to zooxanthellae Zooxanthellae supply to coral
protected, illuminated cells and inorganic nutrients photosynthetic organic carbon and oxygen
CO₂ and nitrogenous waste from metabolism much of the energy supporting coral growth and calcification

Reef-building corals live near their upper thermal tolerance. Sustained heat stress disrupts photosynthesis and cellular regulation in the symbiosis.

The coral animal is not a plant. Its photosynthetic partner is the zooxanthella living within coral tissues.

Heat Stress Causes Bleaching by Separating Coral from Zooxanthellae

  1. Unusually warm water stresses the coral–algal association.
  2. Damaged photosynthetic processes produce harmful reactive molecules.
  3. Coral expels zooxanthellae or loses their pigments.
  4. Transparent tissue reveals the white calcium carbonate skeleton.
  5. Energy supply falls; prolonged or repeated bleaching increases disease and mortality.

Bleaching is not instant death. Corals can recover if stress ends and compatible symbionts return, but repeated events leave less time to rebuild energy reserves and reproduce.

White colour is the visible symptom; the central mechanism is loss of the mutualistic photosynthetic partner and its energy contribution.

Ocean Acidification Reduces Carbonate Available for Coral Skeletons

  1. Atmospheric CO₂ dissolves into seawater.
  2. Dissolved CO₂ forms carbonic acid and releases hydrogen ions.
  3. Hydrogen ions combine with carbonate ions.
  4. Carbonate availability and calcium carbonate saturation fall.
  5. Corals must spend more energy calcifying and skeleton growth weakens.

Warming and acidification are different pressures from the same CO₂-driven problem: heat disrupts symbiosis; altered carbonate chemistry suppresses skeleton formation.

Ocean acidification means falling pH, not that seawater necessarily becomes below pH 7. The biologically important change is the shift in carbonate chemistry.

Repeated Bleaching and Weak Calcification Can Collapse Reef Habitat

  1. Heat events reduce coral energy and survival.
  2. Acidification slows new skeleton formation and reef repair.
  3. Dead framework erodes faster than living corals rebuild it.
  4. Three-dimensional refuges, feeding sites and nursery habitat disappear.
  5. Fish and invertebrate diversity and food-web functions decline.

Pollution, sedimentation and overfishing can further weaken recovery. Ecosystem collapse arises from interacting pressures and loss of habitat-building coral, not temperature in isolation.

Two pathways show heat stress expelling zooxanthellae and dissolved CO₂ lowering pH and calcium carbonate formation; both converge on degraded reef structure and lower biodiversity.

Climate Effects Follow Forcing, Feedback, Exposure and Biological Response

human greenhouse-gas source → enhanced infrared retention → climate variable changes → feedback may amplify the change → habitat or physiological mechanism alters survival, production or distribution → population and ecosystem consequences

Impact Mechanism that must appear
boreal sink becomes source carbon release exceeds uptake through drought, mortality, fire and thaw
ice-dependent species decline required resting or breeding platform is lost at the critical time
marine productivity falls stratification reduces nutrient upwelling to phytoplankton
range contracts or shifts climate space moves but dispersal and habitat constrain tracking
reef degrades bleaching removes symbiont energy and acidification suppresses calcification

Do not jump directly from “warming” to “species decline.” The biological mechanism and the relevant time or place make the explanation causal.

Carbon Sequestration Requires Capture plus Persistent Storage

Carbon sequestration is the capture of atmospheric CO₂ and its storage in a biological or physical pool for a meaningful period.

Term Starting land and action
afforestation establish forest where there was not previously forest cover
reforestation or forest regeneration restore trees and forest processes where forest was lost or damaged
agroforestry combine trees with crops or livestock on managed land
peatland rewetting restore waterlogged conditions that slow decomposition

Sequestration is a flow into a store. Existing forest conservation mainly avoids emissions and protects a current store; it is not identical to creating additional uptake.

Tree-Based Approaches Store Carbon in Biomass and Soil

Approach Carbon mechanism Additional benefit or trade-off
afforestation new tree growth fixes CO₂ into wood, roots and soil can compete with other land uses or harm native open habitats
forest regeneration surviving seed sources and succession rebuild native biomass often supports habitat complexity but takes time
agroforestry trees add long-lived biomass and reduce soil carbon loss within farms retains food production but management determines permanence
  • match species to climate, water and native ecology
  • protect soil carbon and avoid displacing deforestation elsewhere
  • count survival and growth, not only seedlings planted
  • plan for fire, drought, harvest and future climate

A fast-growing monoculture can store carbon yet reduce biodiversity or water availability. Climate benefit must be evaluated with ecosystem consequences.

Rewetting Peat Protects a Carbon Store Built under Low Oxygen

  1. Waterlogging limits oxygen diffusion into soil.
  2. Anaerobic conditions slow decomposer respiration.
  3. Partly decomposed plant material accumulates as peat.
  4. Drainage introduces oxygen, accelerating decomposition and CO₂ release.
  5. Rewetting raises the water table and slows further carbon loss.

Peatlands hold exceptionally dense soil carbon accumulated over centuries to millennia. Preventing loss of an old store can have a different timescale and value from planting new biomass.

Rewetting can initially affect methane emissions and local land use. Net climate benefit must include multiple gases, water level and long-term avoided CO₂ loss.

Judge Sequestration by Additionality, Permanence and the Whole System

Criterion Question
additionality would the carbon gain or avoided loss occur without the action?
permanence could fire, drainage, harvest or drought rapidly release the store?
rate and capacity how much carbon is stored, and over what time?
leakage does the action shift deforestation or emissions elsewhere?
biodiversity and people does it support native habitat, water and livelihoods or create new harm?

Sequestration complements rapid emissions reduction; finite land and reversible biological stores cannot indefinitely compensate for continued fossil-carbon release.

Report the baseline, boundary and monitoring period. Gross tree growth without mortality, soil change and displaced activity can overstate net removal.

Mitigation Protects and Enlarges Carbon Stores without Replacing Emissions Cuts

reduce fossil and land-use emissions first → protect existing high-carbon ecosystems → add appropriate forest, agroforestry or peatland storage → monitor whole-system net carbon → maintain the store against fire, harvest, drainage and climate stress

Land context Strong first option
intact high-carbon ecosystem conserve the existing store and avoid degradation
degraded former forest support native regeneration
productive farm integrate suitable trees through agroforestry
drained peat soil restore waterlogging where feasible
native non-forest habitat avoid inappropriate tree planting

A tonne captured temporarily is not equivalent to a tonne of fossil carbon left underground permanently. Time, reversal risk and ecosystem fit belong in the comparison.

Phenology Records When Seasonal Biological Events Occur

HL only
Event group Examples
plant development budburst, flowering, fruiting, leaf fall
animal movement migration arrival or departure
reproduction nesting, egg laying, breeding and birth
food availability insect emergence and caterpillar biomass peak

Phenology is the study of the timing of recurring seasonal or cyclical biological events and the environmental cues associated with them.

A seasonal timeline places budburst, flowering, insect emergence, migration, nesting, autumn leaf change and seed dispersal under photoperiod and temperature cues.

Temperature and Photoperiod Do Not Shift in the Same Way

HL only
Cue Climate-change response Biological implication
temperature spring thresholds can occur earlier in warmer years temperature-sensitive development may advance
photoperiod day length on each calendar date is unchanged species relying strongly on light may shift less
snow or ice state melt and accessibility respond to weather and accumulated conditions migration or feeding habitat can shift nonlinearly
internal state and food depend on prior stages and resource history responses can lag behind direct temperature cues

Interacting species remain synchronized only if their event dates shift by similar amounts. Different cue sensitivities create mismatch risk.

An earlier event can be phenotypic plasticity within individuals or evolution across generations. Timing change alone does not distinguish them.

Phenology Needs Standardized Dates, Cues and Ecological Outcomes

HL only
  1. Define the event precisely, such as first flower, median hatch date or peak insect biomass.
  2. Record date and location with a consistent sampling method over many years.
  3. Measure candidate cues such as temperature, photoperiod, snowmelt or rainfall.
  4. Compare trends among interacting species and across sites.
  5. Link timing overlap to survival, reproduction or resource use.

First-event dates are sensitive to observer effort and rare early individuals. Peak or median timing and repeated sampling can better represent a population.

A date shift shows phenological change; ecological harm requires evidence that overlap, food supply or breeding success also changed.

Synchrony Is the Overlap between Interacting Seasonal Demands and Resources

HL only

Phenological synchrony occurs when interacting events overlap at the time needed—for example, peak chick food demand coinciding with peak caterpillar biomass.

Interaction If one event advances farther Likely consequence
flower–pollinator flowers open before pollinators are active reduced pollination and seed set
herbivore–plant young leaves mature before grazers arrive lower food quality
chick–caterpillar prey peak precedes maximum chick demand slower growth or fewer fledglings

Both species can move earlier and still become mismatched if they shift by different amounts. Compare overlap, not just the direction of change.

Great-Tit Breeding Can Lag behind an Earlier Caterpillar Peak

HL only
  1. Spring warming advances caterpillar development and peak biomass.
  2. Great-tit laying also responds to temperature, but to cues over a different time window.
  3. The prey peak can advance farther than hatching and chick demand.
  4. Parents encounter less food during maximum chick growth.
  5. Fledgling number or mass can fall, reducing reproductive success.

The mechanism is reduced overlap, not simply “warm weather harms birds.” Populations may partly adjust breeding dates, so long-term outcome depends on the pace and limits of that response.

Earlier decades show caterpillar biomass overlapping great-tit chick food need, while recent warm decades show the caterpillar peak shifted earlier and overlap reduced.

Earlier Arctic Plant Growth Does Not Guarantee Matching Reindeer Migration

HL only
  1. Warming and earlier snowmelt advance nutritious young plant growth.
  2. Reindeer migration timing responds to temperature, snow, photoperiod, inherited routes and movement constraints.
  3. If arrival advances less than the plant-growth peak, forage is older and less nutritious.
  4. Reduced maternal condition or calf growth can lower fitness.

Migration can also advance and preserve some synchrony. The correct prediction compares the size of the plant and animal shifts rather than assuming mismatch from warming alone.

Demonstrate mismatch with plant quality and animal arrival data at the same places and years, then connect overlap to feeding or reproductive outcomes.

Warmer Conditions Can Shorten Insect Development within Thermal Limits

HL only
Temperature effect Population consequence
faster enzyme-driven development within the viable range egg-to-adult generation time shortens
longer frost-free season more time remains for another complete generation
warmer winter more overwintering stages survive
temperature exceeds tolerance or drought removes host quality survival can fall despite faster development

Warming does not increase insect generations without limit. Development has an optimum and requires suitable hosts, moisture and enough season length to complete the extra cycle.

Voltinism is the number of generations completed in one year; climate change can shift a population from univoltine to bivoltine conditions.

A Second Bark-Beetle Generation Adds Another Attack Period

HL only
  1. Adult beetles tunnel through bark and lay eggs beside phloem.
  2. Larvae feed on phloem, disrupting sucrose transport and weakening the tree.
  3. Larvae pupate and new adults emerge.
  4. Warmer seasons allow the cycle to finish earlier.
  5. A second generation attacks again in late summer, when stressed trees may resist fewer beetles.

More adults and two attack periods increase the chance that beetle density exceeds the threshold needed to overwhelm resin and other tree defences.

Drought-stressed trees are easier to kill; dead trees add fuel and reduce carbon uptake, linking insect outbreaks to the boreal carbon-loss feedback.

Climate-Driven Evolution Requires Heritable Variation and Differential Reproduction

HL only
  1. A trait varies among individuals.
  2. At least part of the variation is heritable.
  3. Climate-linked conditions alter survival or reproductive success among variants.
  4. Trait-associated alleles or heritable phenotypes change frequency across generations.
Observation Why it is not yet proof of evolution
one animal changes behavior can be within-lifetime plasticity
population moves north can be migration without genetic change
phenotype mean changes environment can alter phenotype directly

Climate change creates a selection pressure; populations evolve only when inherited variants contribute unequally to later generations.

Milder Finnish Winters Shift Selection toward Brown Tawny Owls

HL only
  1. Tawny owls vary heritably from pale grey to brown plumage.
  2. Historically snowy winters favoured pale camouflage; brown birds had higher mortality in severe winters.
  3. Milder winters reduce snow cover and change the camouflage advantage.
  4. Brown birds survive and reproduce relatively more often.
  5. Across decades, the brown phenotype rises from about 30% to about 50% of the population.

The owls do not darken during one winter. Natural selection changes the population frequency of inherited colour variants across generations.

Snowy habitat favours grey tawny-owl camouflage, low-snow forest favours brown camouflage, and frequency bars show the brown phenotype increasing from about 30% to 50%.

Climate Change Alters Timing, Generation Number and Selection

HL only

climate variable changes → seasonal cue or development rate changes → timing overlap, generations or relative fitness changes → ecological outcome occurs within lifetimes; evolution occurs only if inherited variants change frequency across generations

Observation First question
flowering or migration date advances which cue changed, and how was timing measured?
interacting events move earlier did their overlap increase, persist or decline?
insect outbreak intensifies did development time, winter survival or generation number change?
phenotype frequency shifts is the variation heritable and linked to differential reproduction?

Plastic timing responses can occur before genetic evolution and can themselves alter selection. Keep immediate response, ecological interaction and generational change distinct.

Anthropogenic causes

7 marks

Explain the impact of anthropogenic activity on climate change.

Positive feedback cycles

4 marks

Explain how positive feedback cycles could increase the rate of warming of the Earth.

Boreal forest tipping point

2 marks

An increase in global temperatures poses a critical threat to boreal forests. Explain the consequences of climate change to this northern ecosystem.

Polar habitat changes

3 marks

Discuss the use of Adélie penguins in studying the effects of global warming.

Ocean current changes

1 mark

What is a consequence of ocean water having a very high temperature?

Range shifts

1 mark

The data shows how the hardiness zones in part of North America are predicted to change over the next 25 years. A hardiness zone is an area that has a certain average annual minimum temperature, a factor relevant to the survival of many plants. The lower the number, the more cold

resistant the plants must be.

What is a likely consequence of this change for tree species?

Coral reef threats

5 marks

Outline the reasons that climate change is a threat to coral reefs.

Carbon sequestration approaches

1 mark

Which action will decrease carbon sequestration?

Phenology exam focus

HL only

1 mark

Which of the following could be a subject of phenological research?

Evolution from climate change

HL only

3 marks

Suggest how climate change can influence the natural selection of organisms that live in the Arctic oceans.