
Question 7
[Maximum number: 1]
The diagram shows the long-run total cost (LRTC) curve of a firm.
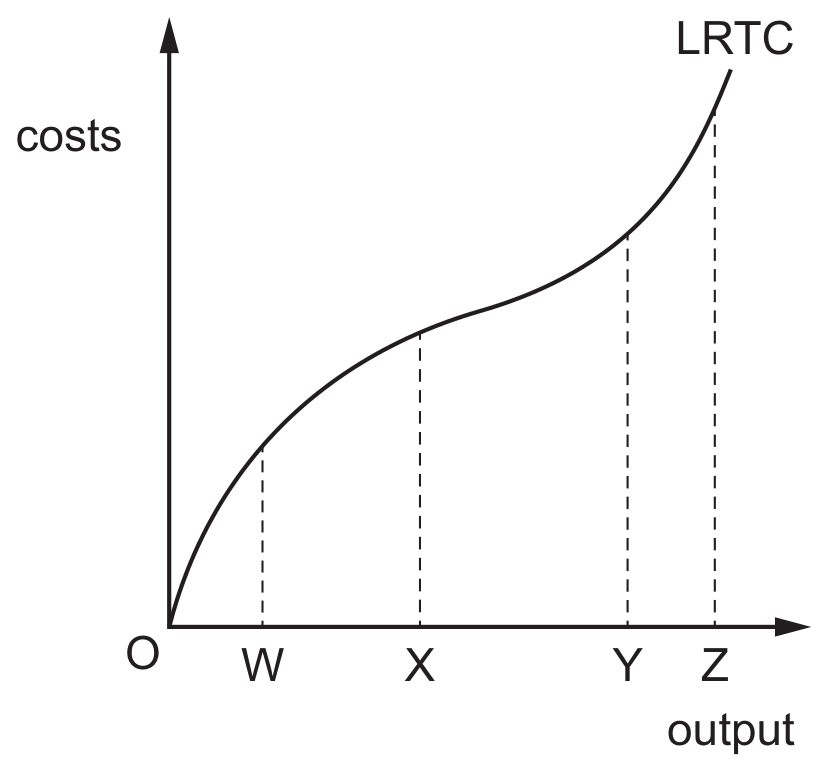
At which output is the long-run average total cost at its minimum?
A
OW
B
OX
C
OY
D
OZ
Practise long-run cost analysis with LRAC, SRAC, LRTC and minimum efficient scale in firm and market-structure contexts.
The diagram shows the long-run total cost (LRTC) curve of a firm.
At which output is the long-run average total cost at its minimum?
OW
OX
OY
OZ