C1.3.7—Limiting factors investigation

Photosynthesis rate is limited by whichever required factor is least available, commonly light intensity, carbon dioxide concentration or temperature, connecting the mechanism to observable photosynthesis evidence.

Syllabus
First assessment 2025
Objective
C1.3.7
Level
SL

Exam analysis

Chance of appearing21%of analysed past papers
Latest appearanceNovember 2025
Most common paperPaper3
Typical marks1–2

Common command terms

  • State
  • Identify
  • Determine
  • Calculate
  • Describe
  • Compare
  • Explain
  • Suggest
  • Draw
  • Sketch
  • Predict
  • Outline
  • Discuss

Recent exam appearances

November 2025Paper1A ["SL"] · TZ15[ 1 ]C1.3.7—Limiting factors investigation
November 2025Paper1A ["SL"] · TZ35[ 1 ]C1.3.7—Limiting factors investigation
May 2025Paper1A ["SL"] · TZ14[ 1 ]C1.3.7—Limiting factors investigation
May 2024Paper1 ["SL"] · TZ17[ 1 ]C1.3.7—Limiting factors investigation
May 2024Paper1 ["SL"] · TZ212[ 1 ]C1.3.7—Limiting factors investigation

Coverage 2010–2025 · Updated 15 Jul 2026

A Plateau Means the Limiting Factor Has Changed

A limiting factor is the condition in shortest effective supply relative to the requirements of photosynthesis. Increasing it raises the rate only until another factor becomes limiting.

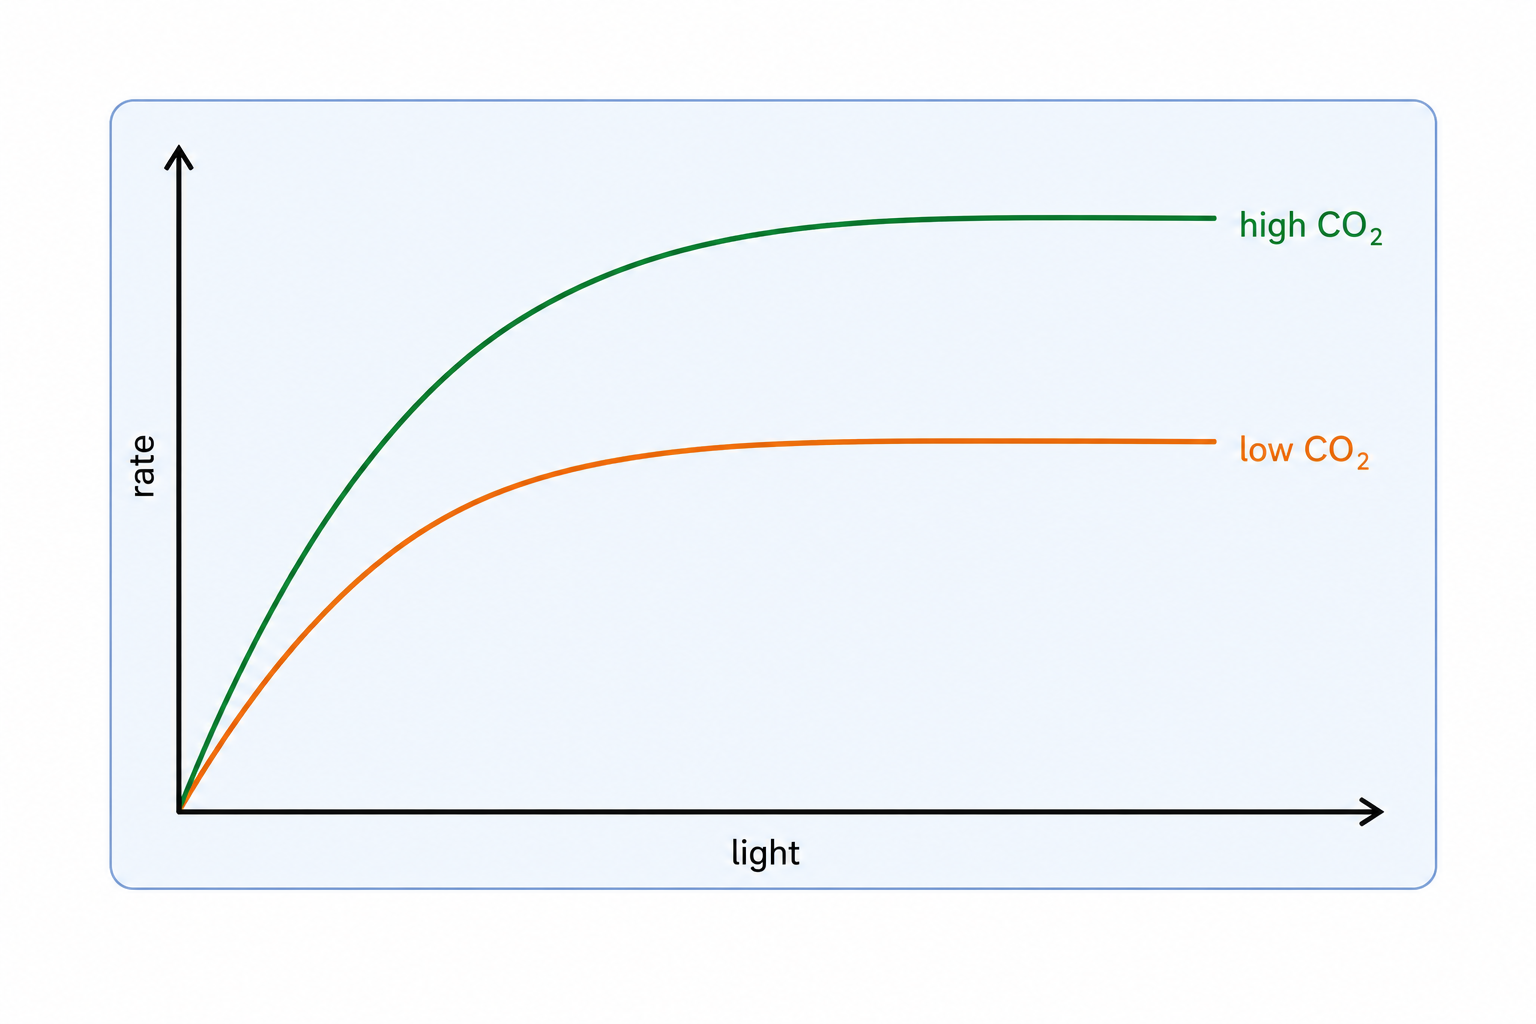
Photosynthesis rate rises with light intensity and then plateaus; high carbon dioxide permits a higher plateau than low carbon dioxide.
Region of curve Interpretation
steep rise as light increases light is limiting
plateau at low CO₂ added light cannot overcome carbon limitation
higher plateau at high CO₂ relieving CO₂ limitation reveals a higher maximum under those conditions

Measure Photosynthesis as a Rate, Not a Bubble Count Alone

Estimate photosynthesis from oxygen volume produced per unit time or carbon dioxide removed per unit time. Bubble number is less valid because bubble size varies.

An illuminated Elodea shoot supplies oxygen to a capillary, where gas-bubble displacement is measured with a microburette and stopwatch.
Experimental role Example
independent variable light intensity, CO₂ concentration or temperature
dependent variable initial O₂-production or CO₂-uptake rate
controls plant species and amount, measurement time, wavelength, the other limiting factors
reliability repeat each treatment and compare means with variation

Allow the apparatus to equilibrate, change one independent variable across a suitable range, measure an initial rate, reset the gas bubble or sensor, and repeat. Use a heat shield or water bath when changing lamp distance so temperature does not change with light.

Temperature Produces an Optimum, Not a Plateau

Photosynthesis rate rises with temperature to an optimum and then falls steeply above the optimum.
Temperature region Why rate changes
below optimum greater kinetic energy increases successful enzyme–substrate collisions
optimum combined photosynthetic processes reach their highest rate under these conditions
above optimum carbon-fixation performance falls and other heat stresses increase; do not assume immediate wholesale enzyme denaturation

Light and CO₂ usually give rising curves that level off as limitation changes. Temperature affects enzyme-controlled reactions, so its curve normally rises to an optimum and then declines.

SL Checkpoint: Read Photosynthesis as Matter, Energy and Evidence

light energy → excited pigment electrons → ATP and reduced NADP → CO₂ reduced using hydrogen from water → organic carbon compounds; photolysis of water releases O₂

  • A chromatogram separates pigments; Rf compares their movement under matched conditions.
  • An absorption spectrum measures captured wavelengths; an action spectrum measures whole-process rate.
  • A limiting-factor experiment changes one condition, controls the others and measures O₂ production or CO₂ uptake per unit time.

When a rate curve plateaus, identify which factor was relieved and which may now be limiting. When evaluating CO₂ enrichment, separate strong control from ecological realism and do not extrapolate beyond the tested conditions.

Limiting factors investigation

[ 9 ]

Explain methods by which the rate of photosynthesis can be measured, including conditions that affect the rate.

Drawing canvas

Concept essentials

  • Photosynthesis rises with a limiting factor only while that factor restricts the rate.
  • Light intensity, carbon dioxide concentration and temperature are common limiting factors.
  • A plateau on a rate graph indicates that another factor has become limiting.
  • Photosynthesis rate can be measured by oxygen production, carbon dioxide uptake, pH change or biomass gain.