C1.3 Photosynthesis

Photosynthesis converts light energy into chemical energy by using pigments, thylakoid reactions and Calvin-cycle carbon fixation to build organic compounds from carbon dioxide.

Syllabus
First assessment 2025
Topic
C1.3
Level
SL

Learning objectives

Photosynthesis Stores Light Energy in Carbon Compounds

Photosynthesis converts light energy into chemical energy stored in organic carbon compounds. It supplies the carbon compounds and most of the chemical energy that enter ecosystems.

Photoautotroph Where chlorophyll captures light
plant or alga thylakoid membranes inside chloroplasts
cyanobacterium internal photosynthetic membranes; no chloroplast
Chlorophyll-containing thylakoids in a plant chloroplast and photosynthetic membranes in a cyanobacterium absorb light.

light absorbed by pigments → excited electrons → ATP and reduced NADP → CO₂ reduced into carbon compounds

Carbon Comes from CO₂; Released Oxygen Comes from Water

Overall matter equation

6CO₂ + 6H₂O + light energy →
C₆H₁₂O₆ + 6O₂
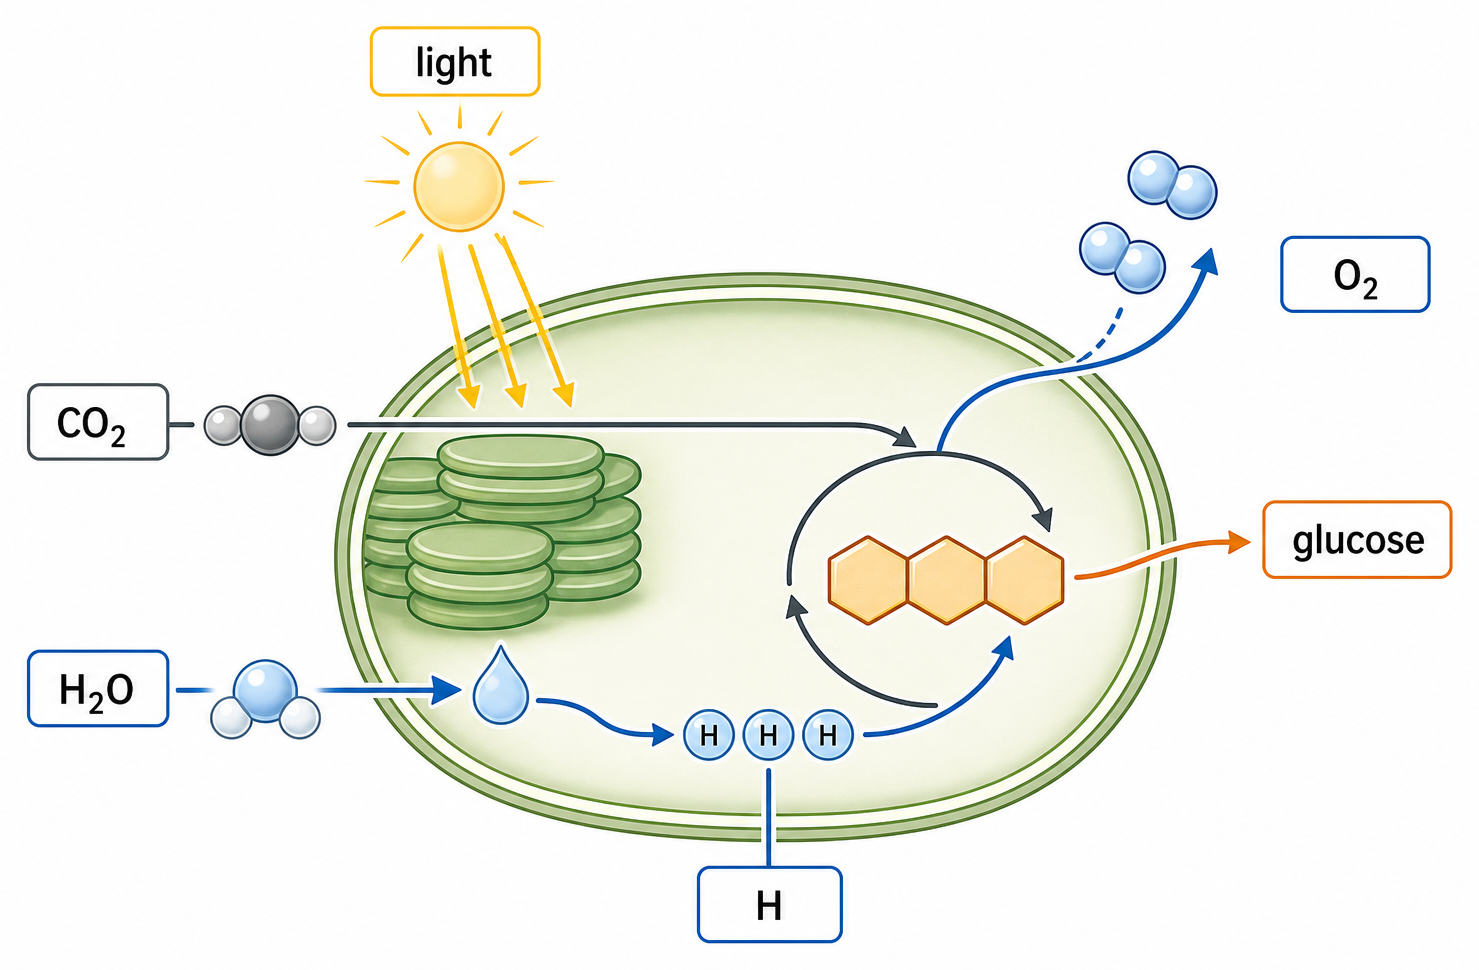
Light-dependent reactions use water and release oxygen, while ATP and reduced NADP support carbon dioxide fixation in the stroma.
Atom or product Source and fate
carbon CO₂ is fixed and reduced into carbohydrate
hydrogen water supplies hydrogen carried by reduced NADP
released O₂ produced by photolysis of water, not removed from CO₂

Plants, algae and cyanobacteria carry out oxygenic photosynthesis. Glucose is a useful summary product, but fixed carbon also feeds the synthesis of many other compounds.

Chromatography Separates a Leaf's Pigment Mixture

Pigments separate because each partitions differently between a moving solvent and the stationary phase. A pigment that is more soluble in the solvent and less strongly attracted to the stationary phase moves farther.

A pigment chromatogram labels the origin, pigment distance and solvent-front distance used to calculate Rf.

Rf=dpigmentdsolvent frontR_f = \frac{d_{pigment}}{d_{solvent\ front}}

  • Extract pigments in an organic solvent and place a concentrated spot on the origin.
  • Keep the origin above the solvent; let the solvent rise.
  • Mark the solvent front immediately, then measure from the origin to each spot's centre.
  • Compare colour and Rf only with standards run under the same solvent, temperature and stationary phase.

Pigments Absorb Selected Wavelengths, Not Every Colour

Absorption spectra show carotenoids, chlorophyll b and chlorophyll a absorbing different parts of the visible spectrum, especially blue and red wavelengths.

A photon is absorbed only when its energy matches an allowed change in a pigment's electrons. Absorption raises an electron to an excited state, beginning the energy transfers of the light-dependent reactions.

Chlorophylls absorb strongly in blue and red regions but weakly in much of the green region, so green light is reflected or transmitted. Accessory pigments absorb additional wavelengths and transfer excitation energy toward chlorophyll a.

Absorption and Action Spectra Answer Different Questions

Spectrum What is varied What the y-axis measures What it tests
absorption wavelength light absorbed by a pigment or extract which wavelengths pigments capture
action wavelength rate of photosynthesis, such as O₂ production or CO₂ uptake which wavelengths drive the whole process

Both normally show strong effects in blue and red regions and weaker effects in much of the green region. The curves are related, not identical: an action spectrum integrates all pigments, energy transfer and every later rate-limiting step.

To compare wavelengths fairly, keep incident photon supply, temperature, CO₂ availability and plant material constant; a coloured filter that also changes intensity confounds the conclusion.

A Plateau Means the Limiting Factor Has Changed

A limiting factor is the condition in shortest effective supply relative to the requirements of photosynthesis. Increasing it raises the rate only until another factor becomes limiting.

Photosynthesis rate rises with light intensity and then plateaus; high carbon dioxide permits a higher plateau than low carbon dioxide.
Region of curve Interpretation
steep rise as light increases light is limiting
plateau at low CO₂ added light cannot overcome carbon limitation
higher plateau at high CO₂ relieving CO₂ limitation reveals a higher maximum under those conditions

Measure Photosynthesis as a Rate, Not a Bubble Count Alone

Estimate photosynthesis from oxygen volume produced per unit time or carbon dioxide removed per unit time. Bubble number is less valid because bubble size varies.

An illuminated Elodea shoot supplies oxygen to a capillary, where gas-bubble displacement is measured with a microburette and stopwatch.
Experimental role Example
independent variable light intensity, CO₂ concentration or temperature
dependent variable initial O₂-production or CO₂-uptake rate
controls plant species and amount, measurement time, wavelength, the other limiting factors
reliability repeat each treatment and compare means with variation

Allow the apparatus to equilibrate, change one independent variable across a suitable range, measure an initial rate, reset the gas bubble or sensor, and repeat. Use a heat shield or water bath when changing lamp distance so temperature does not change with light.

Temperature Produces an Optimum, Not a Plateau

Photosynthesis rate rises with temperature to an optimum and then falls steeply above the optimum.
Temperature region Why rate changes
below optimum greater kinetic energy increases successful enzyme–substrate collisions
optimum combined photosynthetic processes reach their highest rate under these conditions
above optimum carbon-fixation performance falls and other heat stresses increase; do not assume immediate wholesale enzyme denaturation

Light and CO₂ usually give rising curves that level off as limitation changes. Temperature affects enzyme-controlled reactions, so its curve normally rises to an optimum and then declines.

CO₂ Enrichment Tests a Conditional Prediction

Extra CO₂ can raise photosynthesis or growth only while light, temperature, water, mineral nutrients and biochemical capacity remain sufficient. An enrichment result therefore supports a conditional prediction, not unlimited future growth.

Towers around a forest plot release carbon dioxide into open air for a FACE enrichment experiment.
Design Strength Main limitation
greenhouse or chamber close control of CO₂ and other conditions enclosure changes light, temperature, airflow and scale
FACE field plot exposes intact crops or ecosystems under realistic open-air conditions rainfall, light and other variables cannot be controlled and must be monitored

Compare enriched and ambient-CO₂ replicates, measure photosynthesis and biomass over time, and report variation. Differences among species, years or water treatments show interaction with other limiting factors.

SL Checkpoint: Read Photosynthesis as Matter, Energy and Evidence

light energy → excited pigment electrons → ATP and reduced NADP → CO₂ reduced using hydrogen from water → organic carbon compounds; photolysis of water releases O₂

  • A chromatogram separates pigments; Rf compares their movement under matched conditions.
  • An absorption spectrum measures captured wavelengths; an action spectrum measures whole-process rate.
  • A limiting-factor experiment changes one condition, controls the others and measures O₂ production or CO₂ uptake per unit time.

When a rate curve plateaus, identify which factor was relieved and which may now be limiting. When evaluating CO₂ enrichment, separate strong control from ecological realism and do not extrapolate beyond the tested conditions.

Light energy → chemical energy

8 marks

Explain the processes by which light energy is converted into chemical energy.

CO₂ → glucose

4 marks

Outline how photosynthesis produces glucose.

Oxygen as by-product

1 mark

Which group(s) produce(s) oxygen as a by-product of photosynthesis?

I. Algae
II. Cyanobacteria
III. Fungi

Photosynthetic pigment separation

3 marks

Describe the process used to obtain this chromatogram.

Absorption of specific wavelengths

4 marks

Outline how plants make use of the different wavelengths of light.

Absorption vs. action spectra

3 marks

Draw a fully labelled graph of the action spectrum for photosynthesis.

Limiting factors investigation

9 marks

Explain methods by which the rate of photosynthesis can be measured, including conditions that affect the rate.

CO₂ enrichment experiments

2 marks

Using the data in the graph, discuss whether rising carbon dioxide levels in the atmosphere will increase growth rates in maize.