
Question 11(b)
[Maximum number: 4]
The table shows some values for .
Where appropriate, values of y are given correct to 2 decimal places.

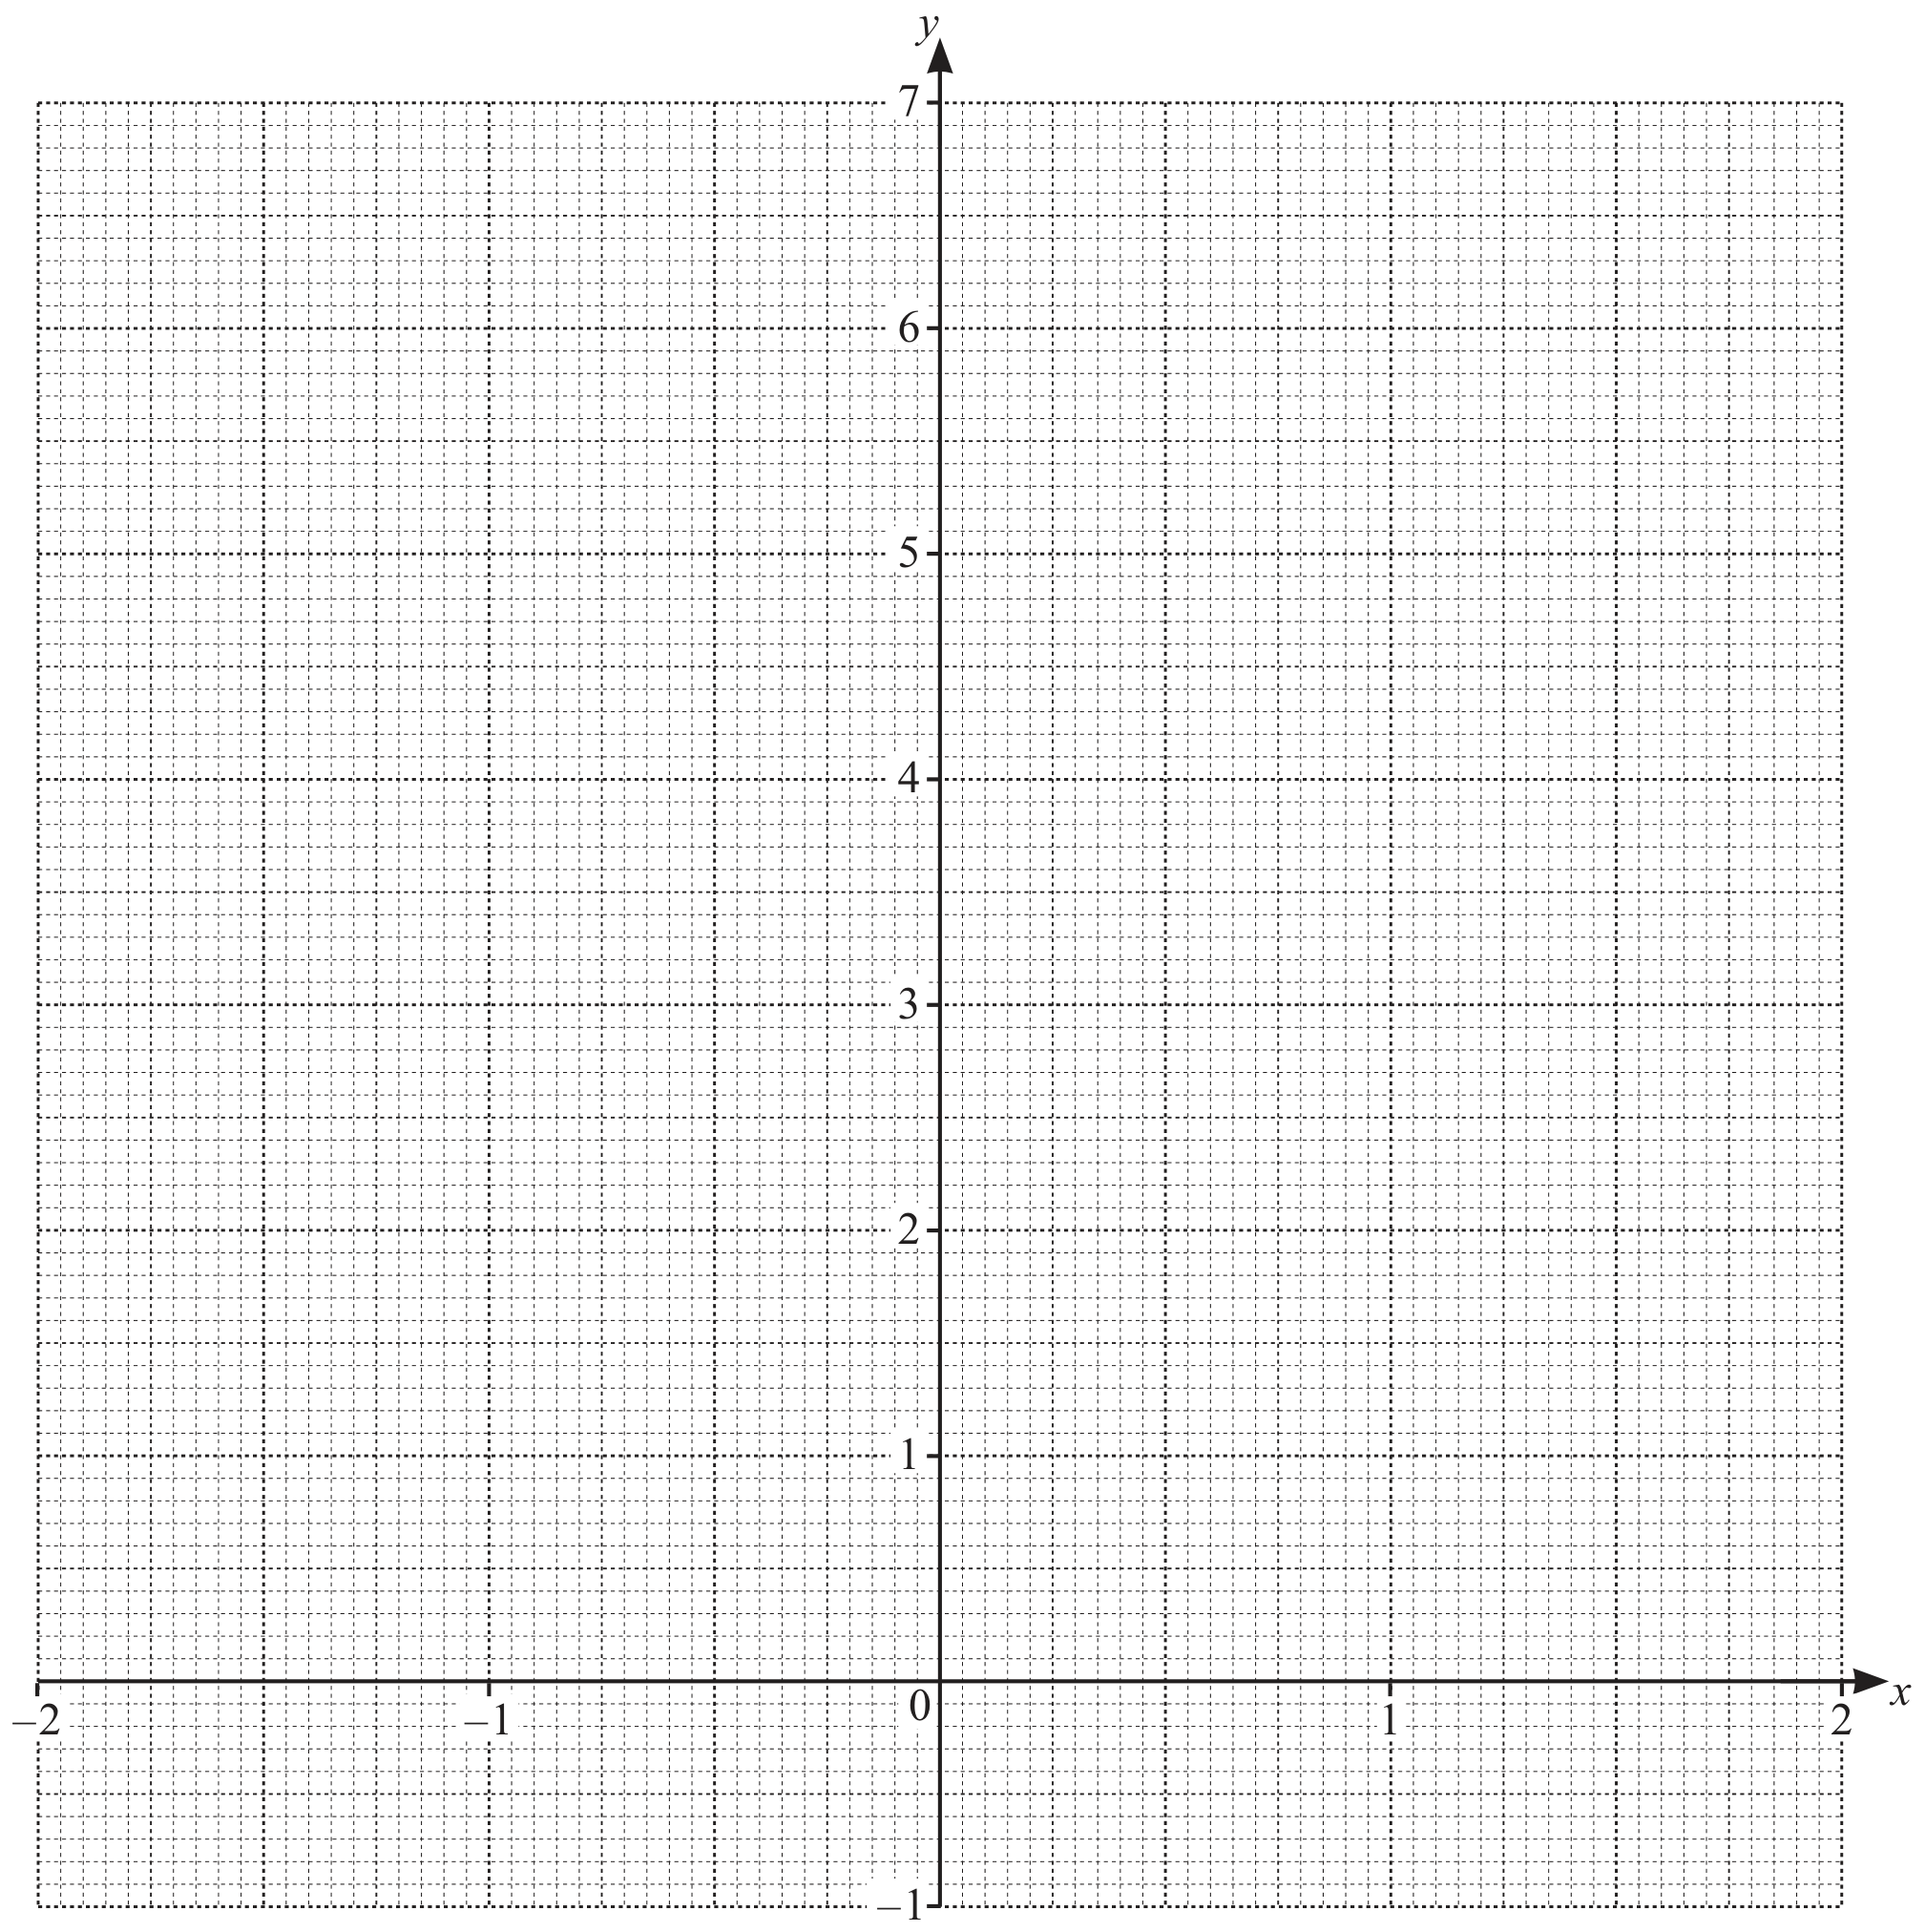
Draw the graph of for .
 EduNinja
Practise calculating and plotting function values, drawing a smooth curve and using a suitable additional line to obtain graphical roots.
The table shows some values for .
Where appropriate, values of y are given correct to 2 decimal places.
Draw the graph of for .