CAIE IGCSE Mathematics Extended Averages and Measures of Spread

Practise calculating centre and spread from individual, frequency and grouped data, including quartiles, interquartile range and estimated mean using class midpoints.

Syllabus
2028–2030
Topic
E9.3
Level
Extended

Exam points

  • read or calculate the median, quartiles, range and interquartile range from ordered data summaries
  • estimate a grouped-data mean using each class midpoint in Σ(midpoint × frequency) ÷ Σfrequency
  • identify the modal class as the interval with the greatest frequency, preserving its boundaries

E9.3 Averages and measures of spread question 1

[Maximum number: 6]

Question (a)

(a)

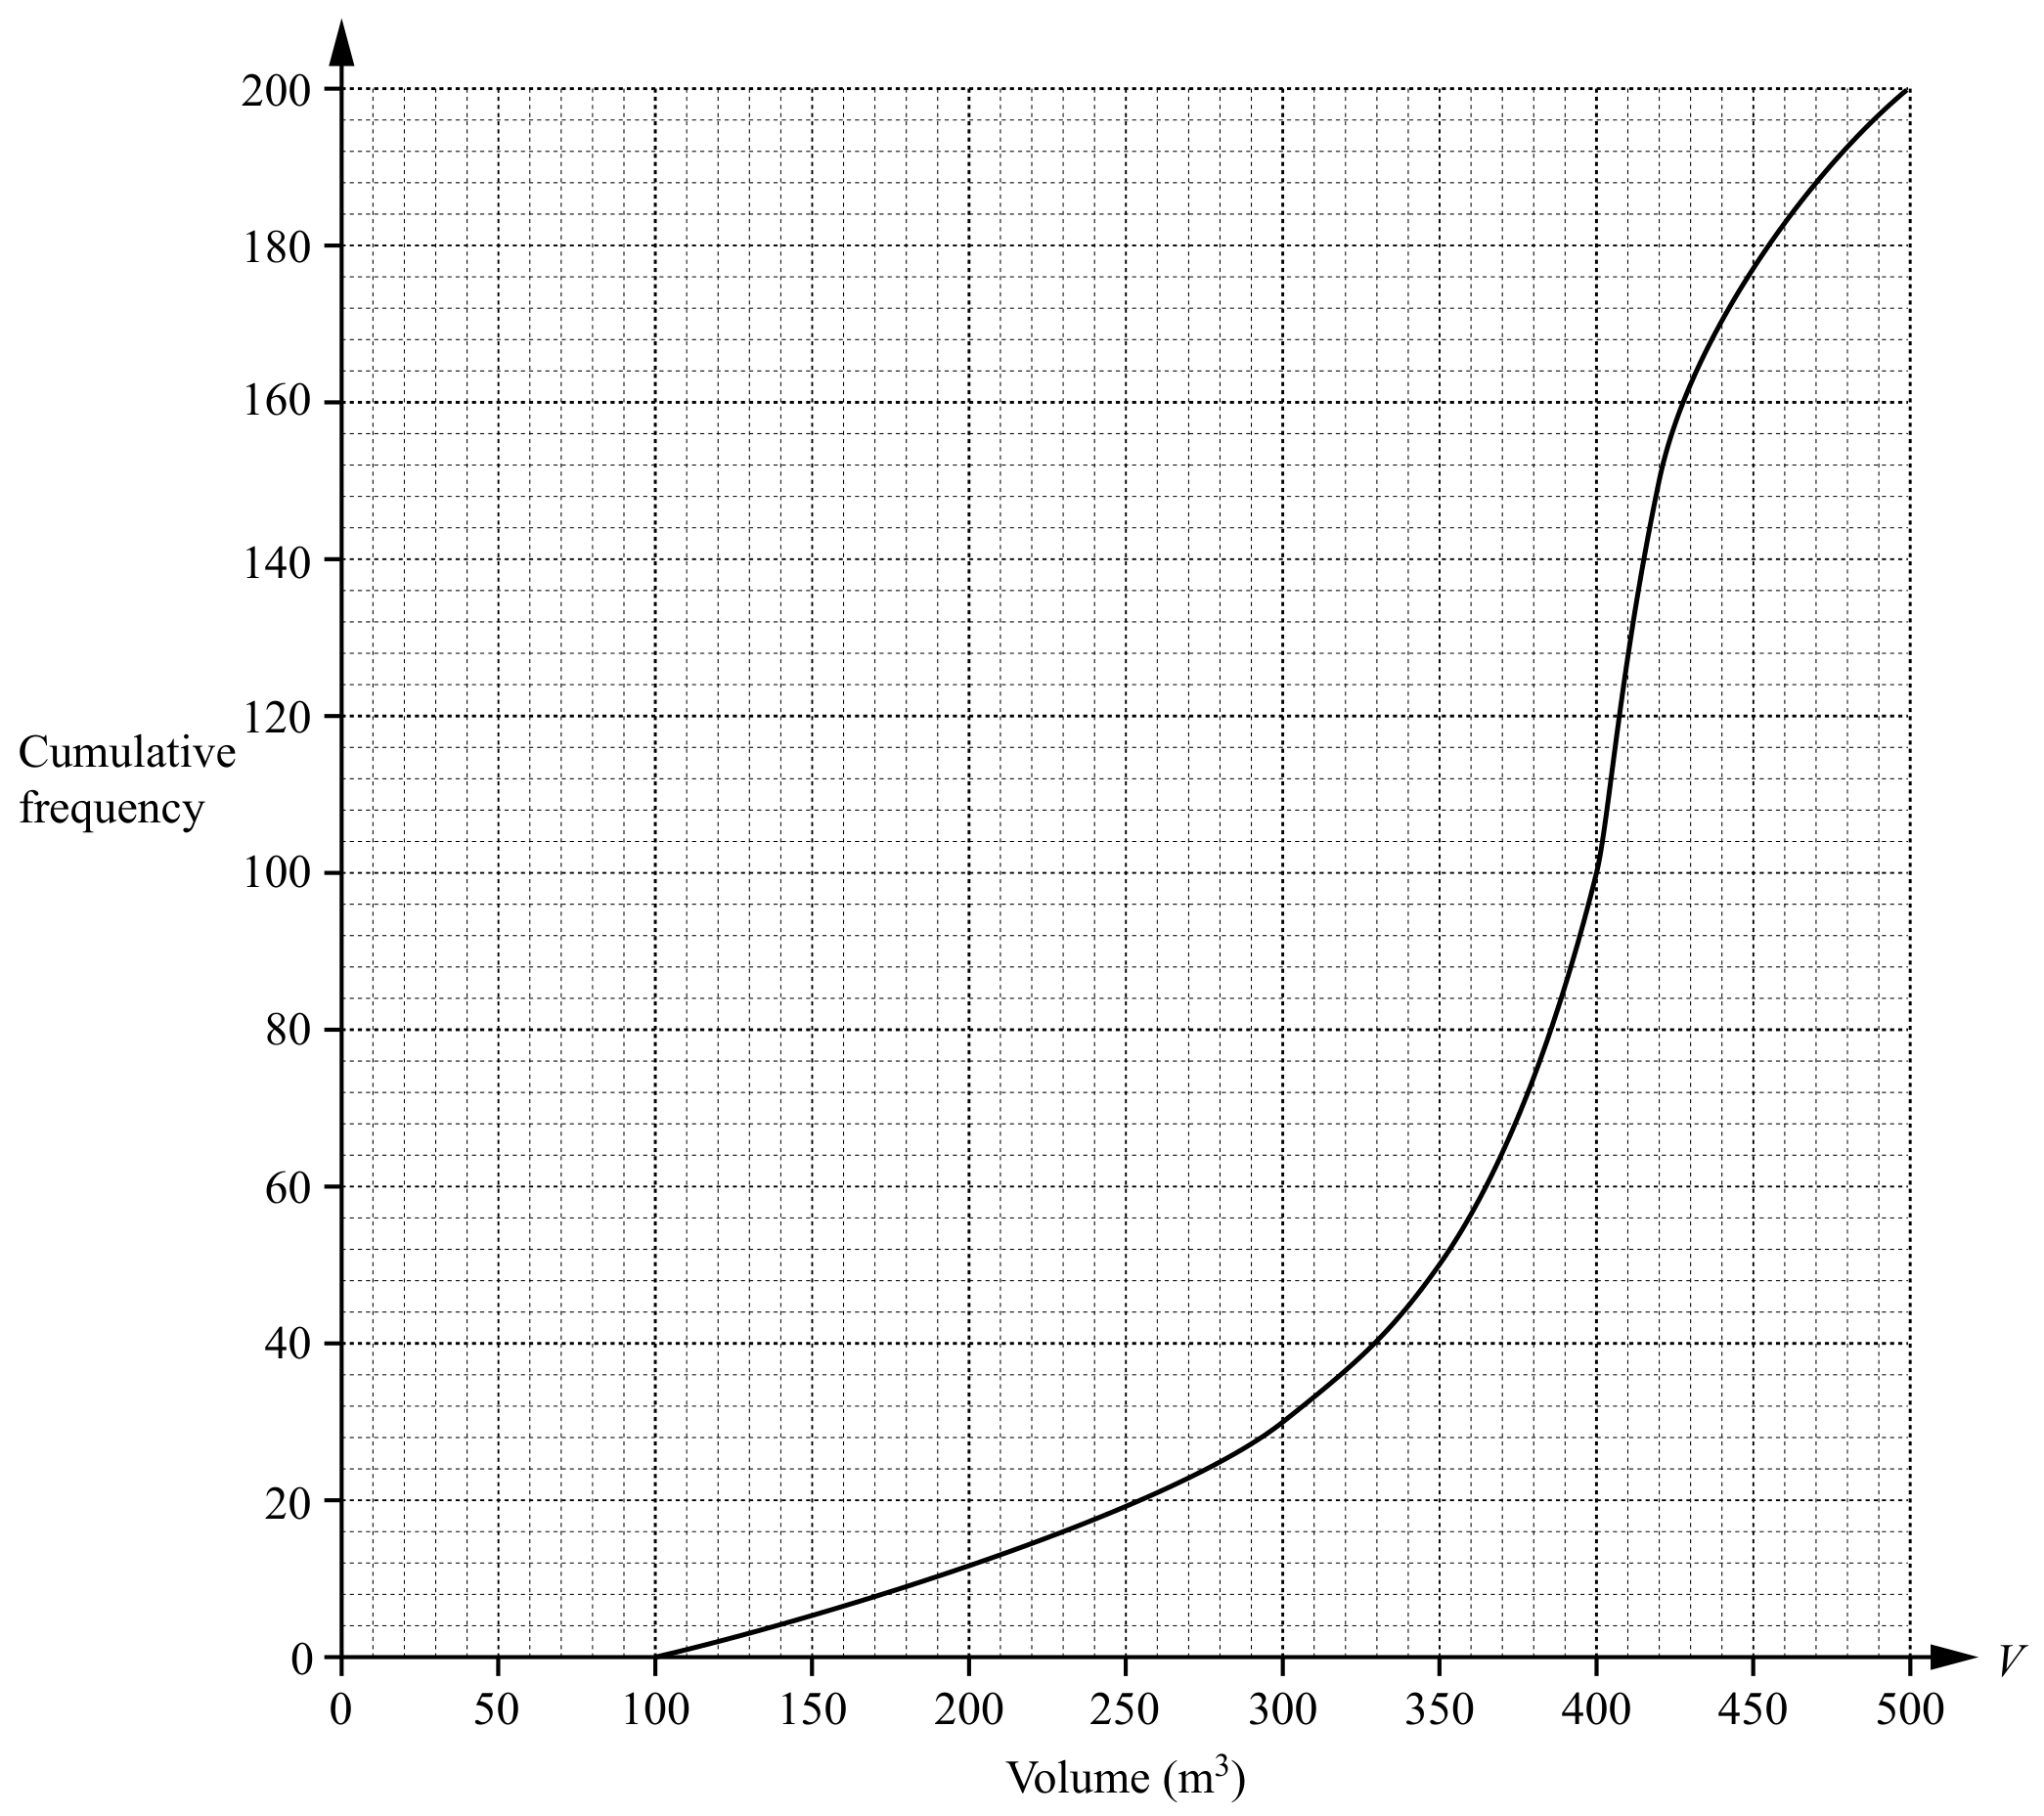
200 students estimate the volume, V m3V \mathrm{~m}^{3}, of a classroom. The cumulative frequency diagram shows their results.

Figure for Question (a) — CAIE IGCSE Mathematics Extended

Use the graph to find an estimate of

[ 2 ]

Question (i)

(i)

the interquartile range,

___ m^3

[ 2 ]

Question (b)

(b)

The 200 students also estimate the total area, A m2A \mathrm{~m}^{2}, of the windows in the classroom. The table shows their results.

Table for Question (b) — CAIE IGCSE Mathematics Extended
[ 4 ]

Question (i)

(i)

Calculate an estimate of the mean.

You must show all your working.

___ m^2

[ 4 ]

E9.3 Averages and measures of spread question 2

[Maximum number: 1]

The heights, h metres, of the 120 boys in an athletics club are recorded.
The table shows information about the heights of the boys.

Table for Question E9.3 Averages and measures of spread question 2 — CAIE IGCSE Mathematics Extended

Write down the modal class.
<h<h \leqslant

All question bank results loaded