CAIE IGCSE Mathematics Extended Interpreting Box Plots

Practise comparing distributions from box-and-whisker plots by using medians for typical values, interquartile ranges for variation and quartiles for estimates.

Syllabus
2028–2030
Topic
E9.2
Level
Extended

Exam points

  • compare typical values by reading both medians and translating the numerical difference into context
  • compare consistency using both interquartile ranges, with the smaller IQR indicating less variation
  • use quartile positions to estimate the fraction and count lying above or below a stated boundary

E9.2 Interpreting statistical data question 1

[Maximum number: 1]

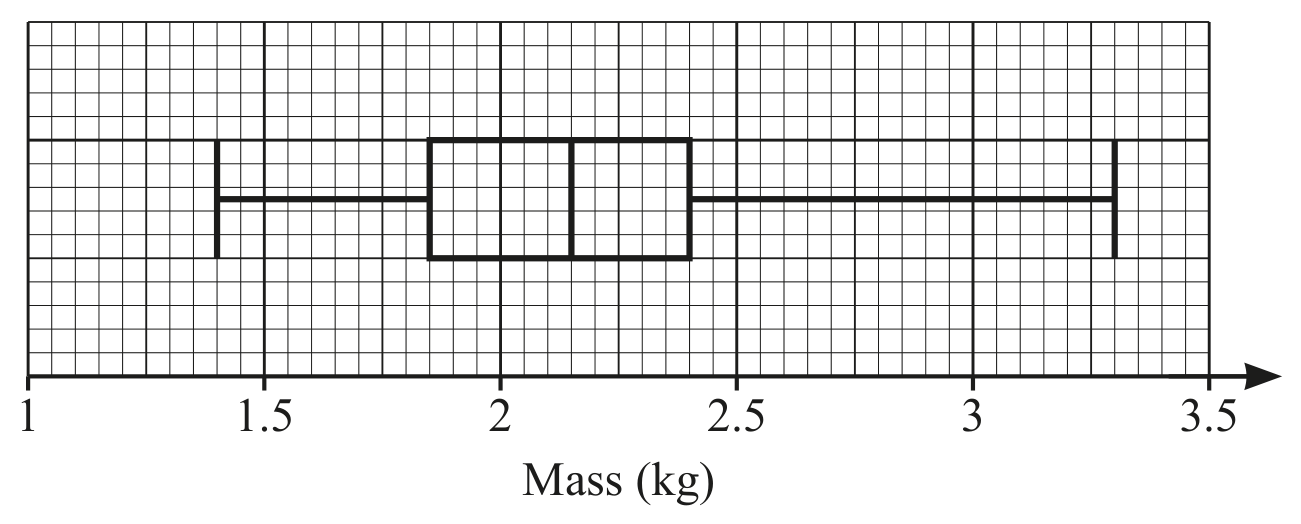
The box-and-whisker plot shows information about the mass, in kg, of some parcels.

Figure for Question E9.2 Interpreting statistical data question 1 — CAIE IGCSE Mathematics Extended

Find the mass of the heaviest parcel.
kg\mathrm{kg}

E9.2 Interpreting statistical data question 2

[Maximum number: 1]

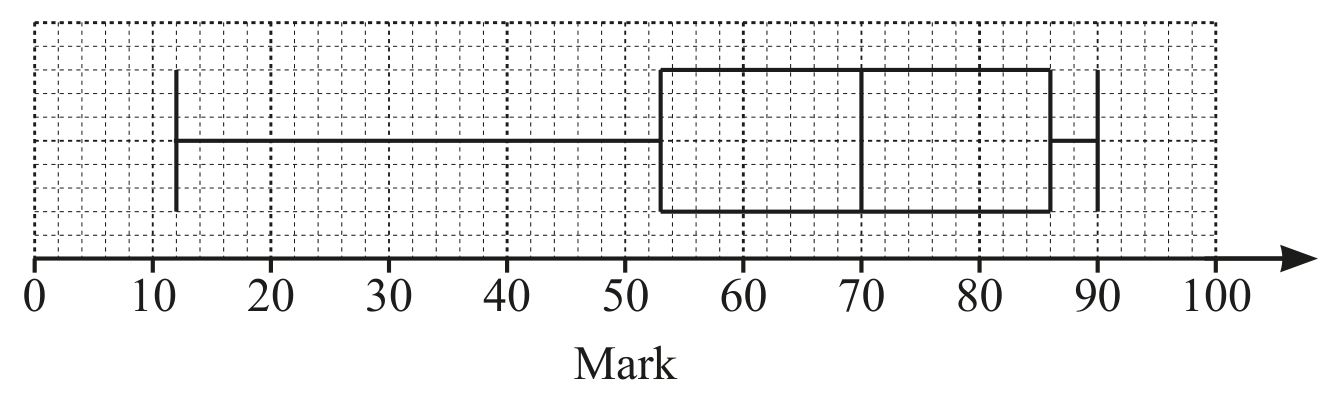
The box-and-whisker plot shows information about the marks scored by some students in a test.

Figure for Question E9.2 Interpreting statistical data question 2 — CAIE IGCSE Mathematics Extended

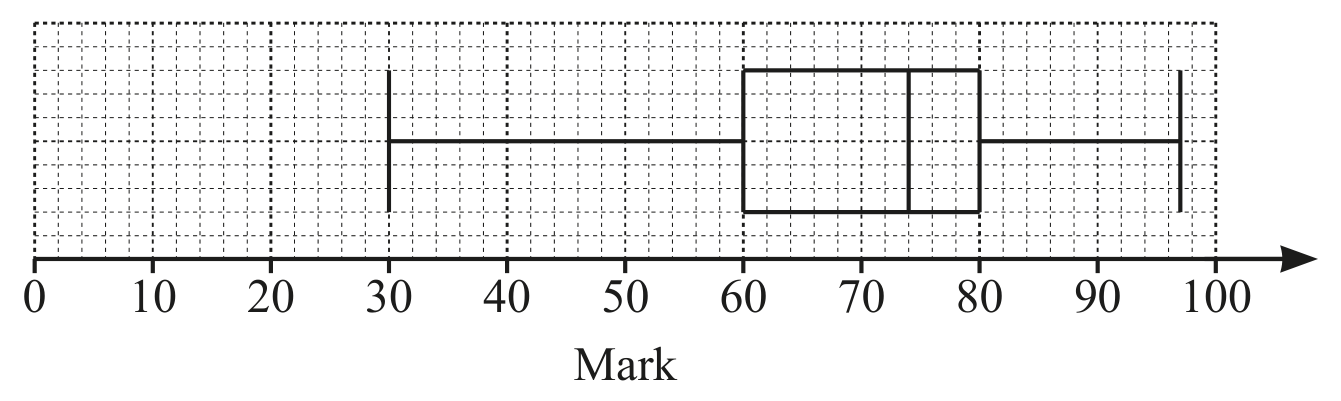
This box-and-whisker plot shows information about the marks scored by the same students in a second test.

Figure for Question E9.2 Interpreting statistical data question 2 — CAIE IGCSE Mathematics Extended

Make one comparison between the distributions of marks in the two tests.

All question bank results loaded