CAIE IGCSE Mathematics Extended Statistical Diagrams

Practise constructing statistical diagrams from frequencies and five-number summaries, with emphasis on pie-chart sectors, ordered leaves and box plots.

Syllabus
2028–2030
Topic
E9.4
Level
Extended

Exam points

  • convert a frequency into a pie-chart sector using frequency ÷ total × 360° and draw it accurately
  • arrange each stem's leaves in ascending order and include a key that identifies the data value
  • plot minimum, quartiles, median and maximum at the correct scale to construct a box plot

E9.4 Statistical charts and diagrams question 1

[Maximum number: 4]

Question (a)

(a)

The list shows 15 midday temperatures, in degrees Celsius, in Suntown.

Table for Question (a) — CAIE IGCSE Mathematics Extended
[ 4 ]

Question (i)

(i)

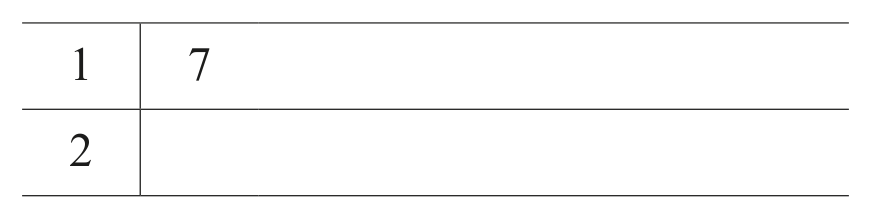
Complete the stem-and-leaf diagram to show this information.

Table for Question (i) — CAIE IGCSE Mathematics Extended

Key: 171 \mid 7 represents 17C17^{\circ} \mathrm{C}

[ 2 ]

Question (ii)

(ii)

Rahul draws a pie chart to show this information.

Calculate the sector angle for the number of days the temperature is 18C18^{\circ} \mathrm{C}.

[ 2 ]
All question bank results loaded