CAIE IGCSE Mathematics Extended E9.7 Histograms Question Bank
Practise drawing and interpreting histograms, using class widths and frequency density to complete bars, tables and frequencies.
- Syllabus
- 2028–2030
- Topic
- E9.7
- Level
- Extended
Practise drawing and interpreting histograms, using class widths and frequency density to complete bars, tables and frequencies.
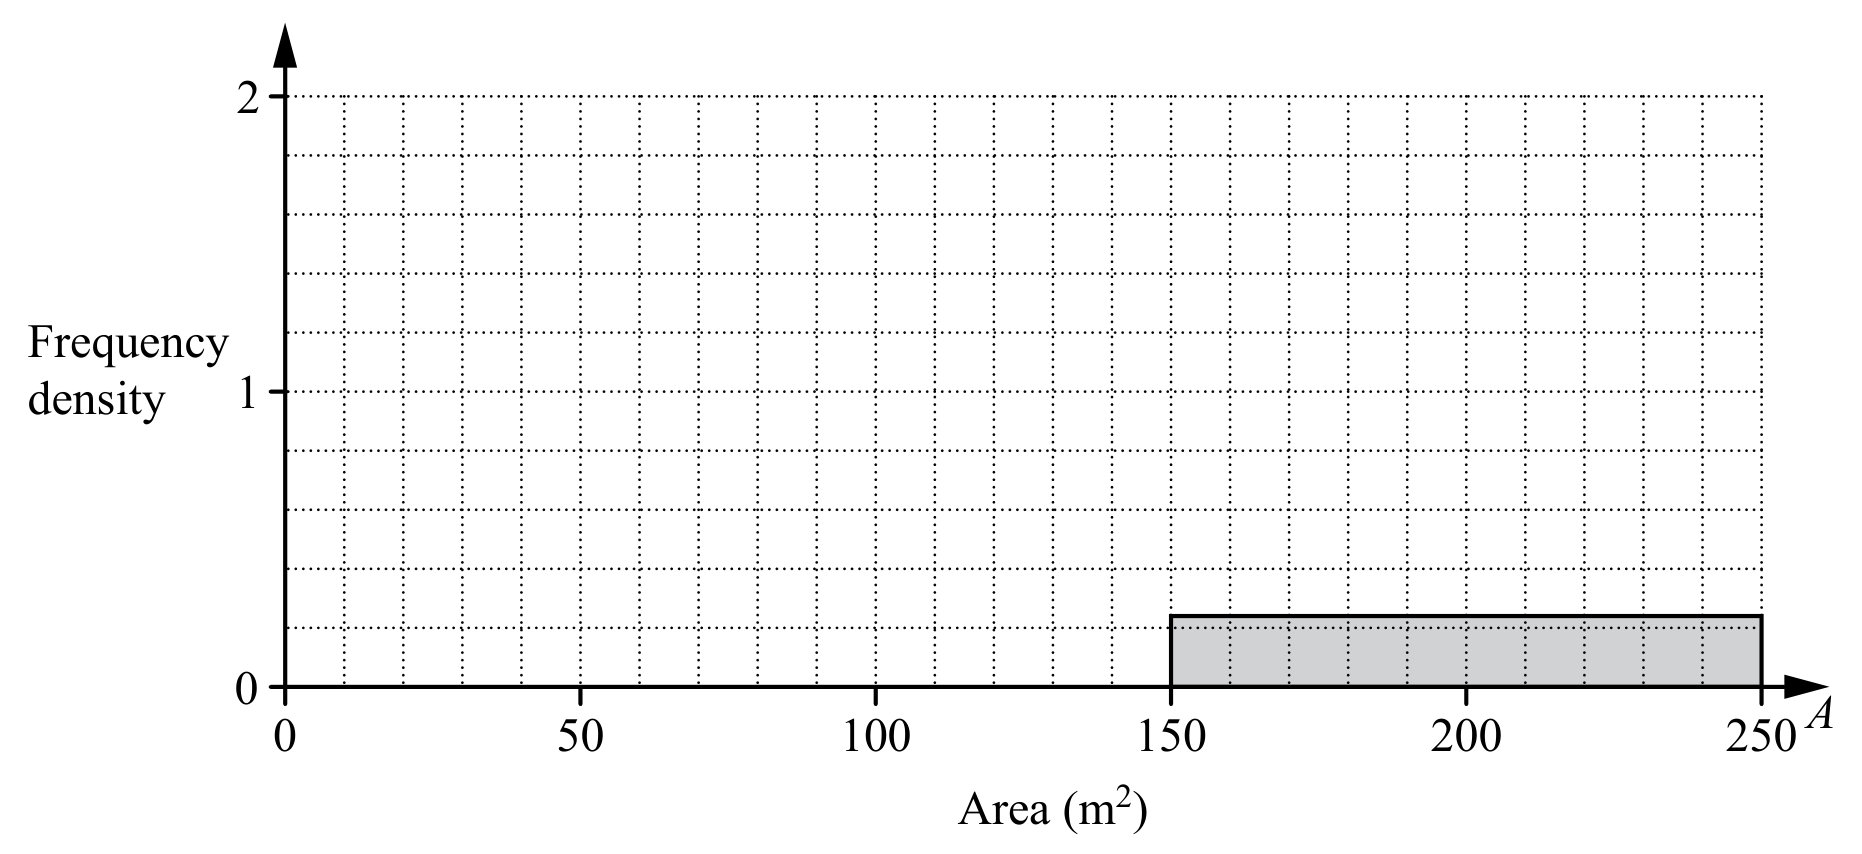
The 200 students also estimate the total area, , of the windows in the classroom. The table shows their results.

Complete the histogram to show the information in the table.
Some apples are weighed and the mass, m grams, of each apple is recorded. The table shows the results.

The histogram shows some of the information from the table.
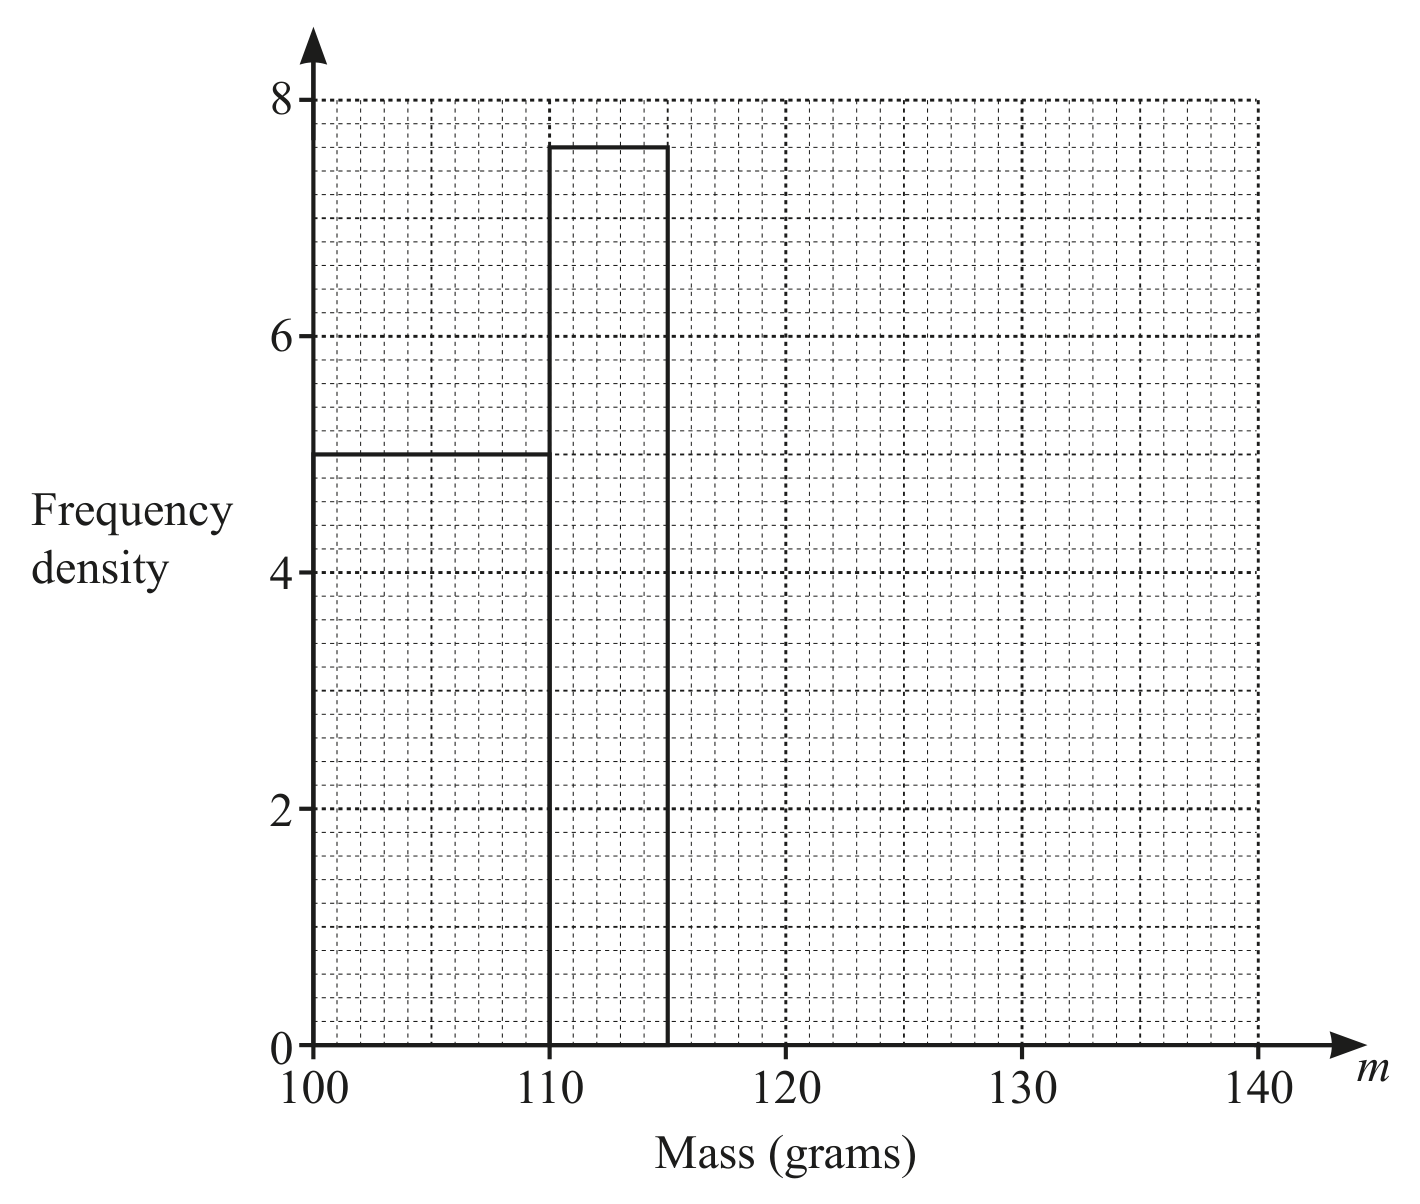
Work out the value of x.
x=
Complete the histogram.