CAIE IGCSE Mathematics Extended Statistics Question Bank

Practise organising and interpreting data, calculating averages and spread, and constructing statistical diagrams from raw, grouped and cumulative information.

Syllabus
2028–2030
Topic
9
Level
Extended

9. Statistics question 1

[Maximum number: 2]

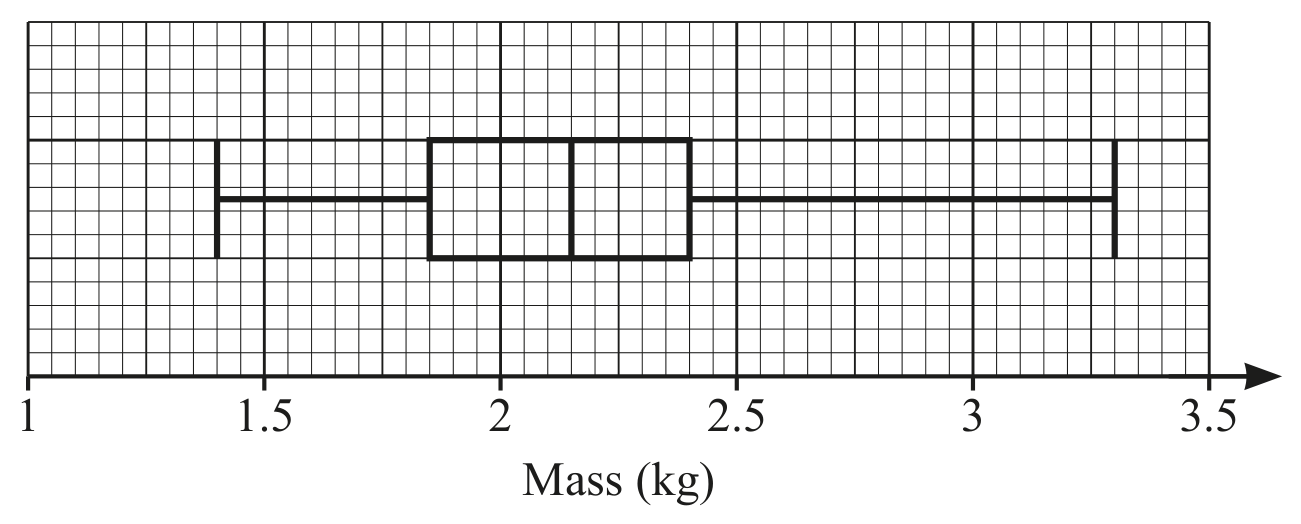
The box-and-whisker plot shows information about the mass, in kg, of some parcels.

Figure for Question 9. Statistics question 1 — CAIE IGCSE Mathematics Extended

Question (a)

(a)

Find the mass of the heaviest parcel.
kg\mathrm{kg}

[ 1 ]

Question (b)

(b)

Find the interquartile range.
kg\mathrm{kg}

[ 1 ]

9. Statistics question 2

[Maximum number: 13]

Question (a)

(a)

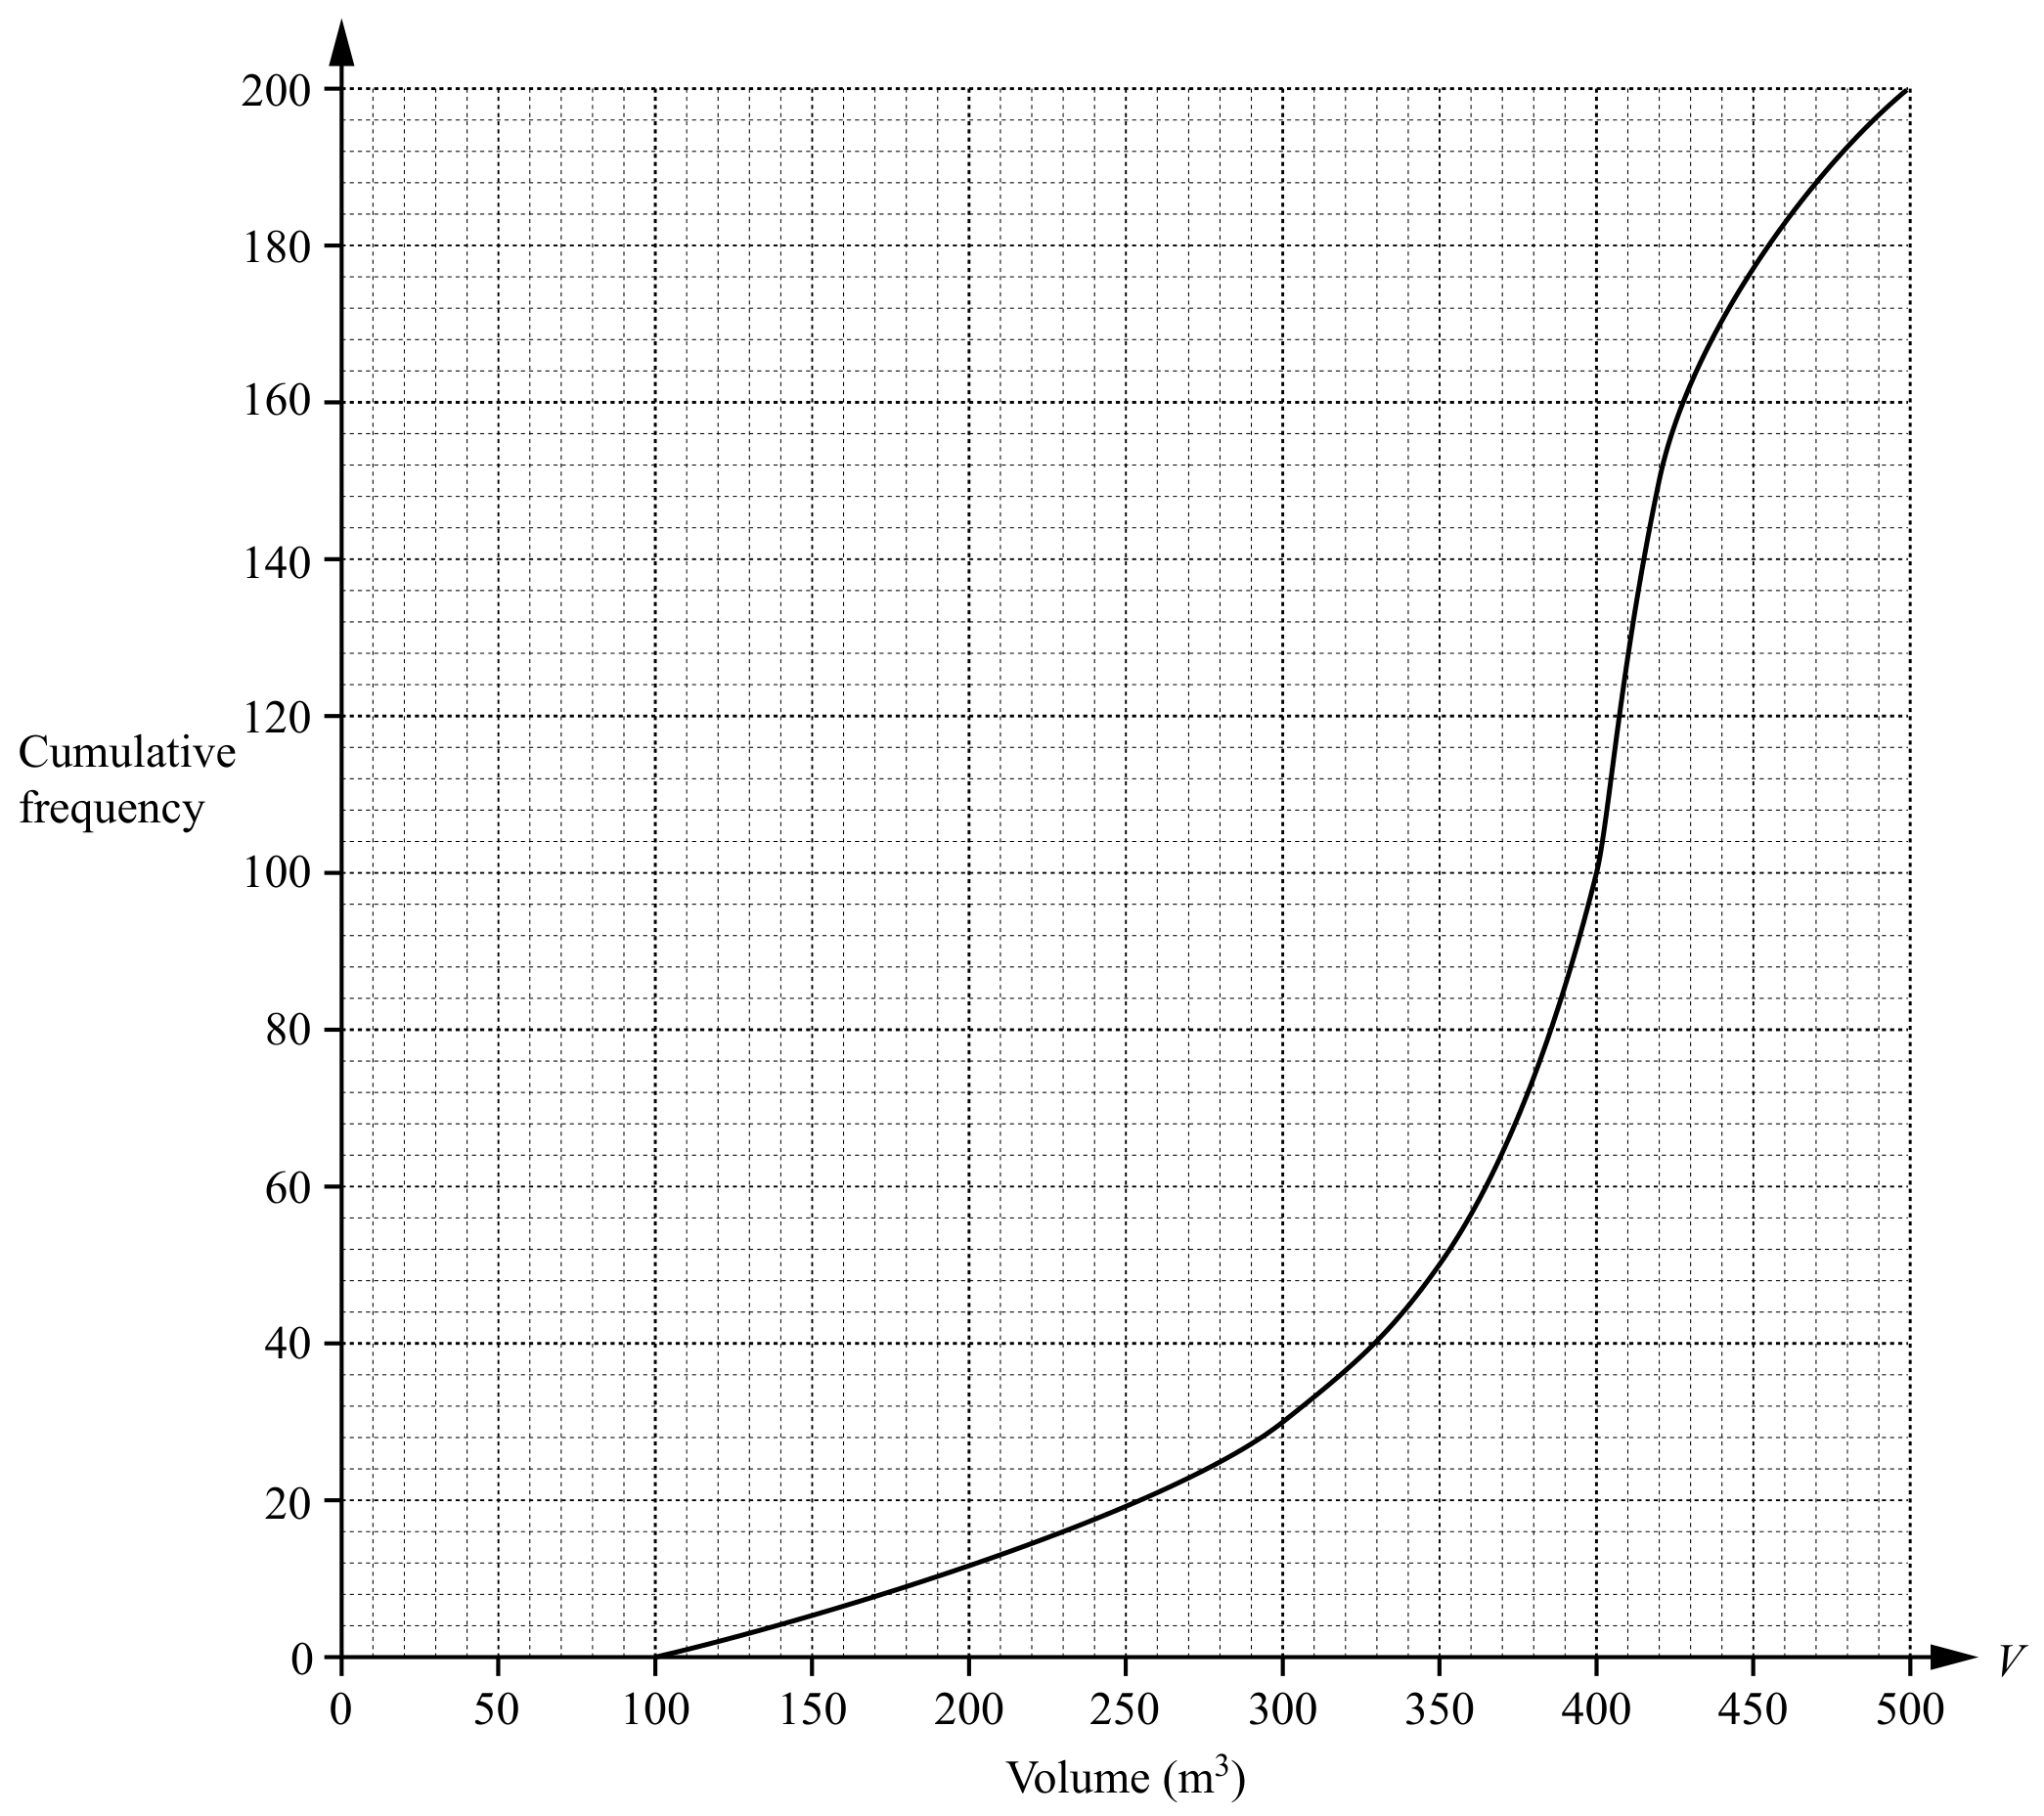
200 students estimate the volume, V m3V \mathrm{~m}^{3}, of a classroom. The cumulative frequency diagram shows their results.

Figure for Question (a) — CAIE IGCSE Mathematics Extended

Use the graph to find an estimate of

[ 5 ]

Question (i)

(i)

the interquartile range,

___ m^3

[ 2 ]

Question (ii)

(ii)

the 60th percentile,

___ m^3

[ 1 ]

Question (iii)

(iii)

the number of students who estimate that the volume is greater than 300 m3300 \mathrm{~m}^{3}.

[ 2 ]

Question (b)

(b)

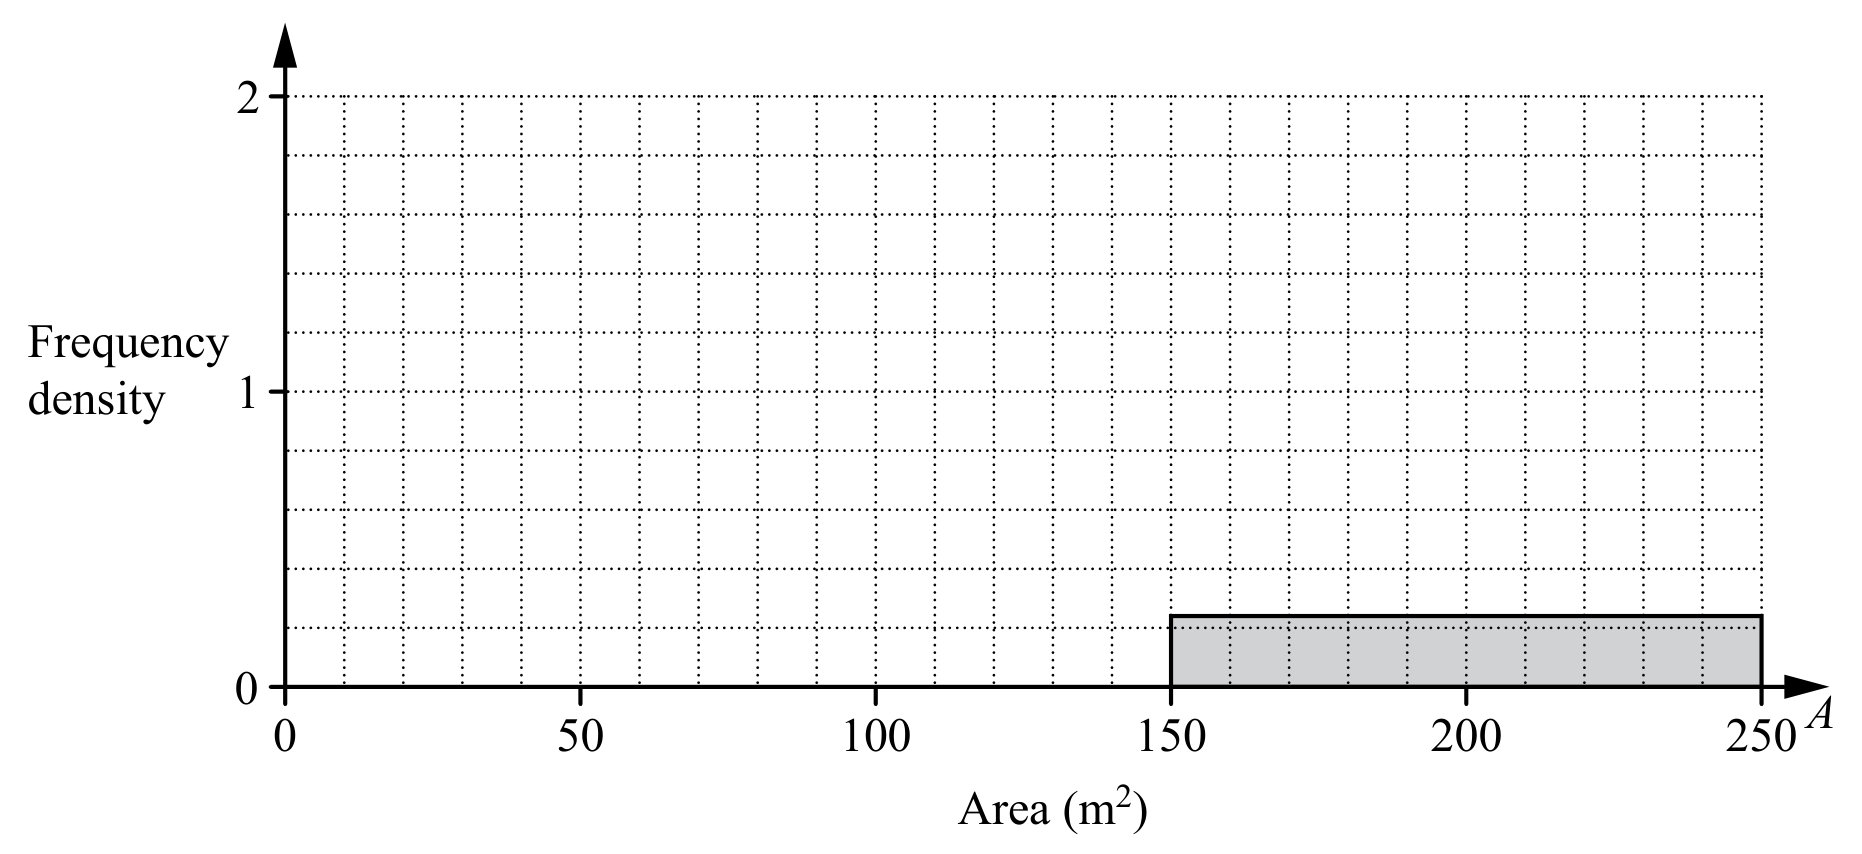
The 200 students also estimate the total area, A m2A \mathrm{~m}^{2}, of the windows in the classroom. The table shows their results.

Table for Question (b) — CAIE IGCSE Mathematics Extended
[ 8 ]

Question (i)

(i)

Calculate an estimate of the mean.

You must show all your working.

___ m^2

[ 4 ]

Question (ii)

(ii)

Complete the histogram to show the information in the table.

Figure for Question (ii) — CAIE IGCSE Mathematics Extended
[ 4 ]

9. Statistics question 3

[Maximum number: 15]

Question (a)

(a)

The list shows 15 midday temperatures, in degrees Celsius, in Suntown.

Table for Question (a) — CAIE IGCSE Mathematics Extended
[ 6 ]

Question (i)

(i)

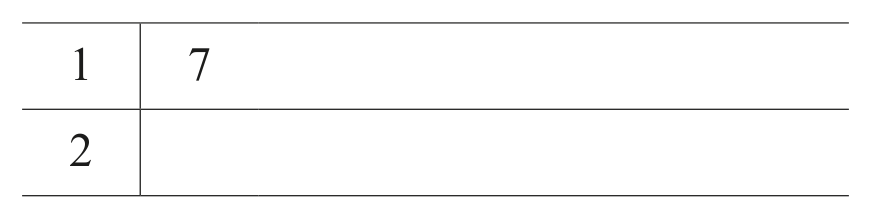
Complete the stem-and-leaf diagram to show this information.

Table for Question (i) — CAIE IGCSE Mathematics Extended

Key: 171 \mid 7 represents 17C17^{\circ} \mathrm{C}

[ 2 ]

Question (ii)

(ii)

Find the median. C{ }^{\circ} \mathrm{C}

[ 1 ]

Question (iii)

(iii)

Find the upper quartile. C{ }^{\circ} \mathrm{C}

[ 1 ]

Question (iv)

(iv)

Rahul draws a pie chart to show this information.

Calculate the sector angle for the number of days the temperature is 18C18^{\circ} \mathrm{C}.

[ 2 ]

Question (b)

(b)
Figure for Question (b) — CAIE IGCSE Mathematics Extended

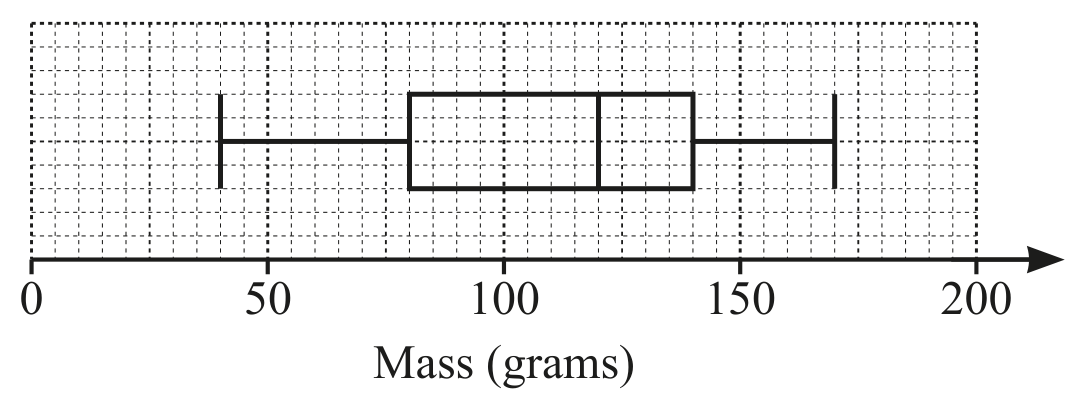
The box-and-whisker plot shows information about the masses, in grams, of some apples.

[ 3 ]

Question (i)

(i)

Find the median.

[ 1 ]

Question (ii)

(ii)

Find the range.
g

[ 1 ]

Question (iii)

(iii)

Find the interquartile range. g [1]

[ 1 ]

Question (c)

(c)
Table for Question (c) — CAIE IGCSE Mathematics Extended

The time, t$ minutes, spent on homework in one week by each of 200 students is recorded. The table shows the results. \begin{tabular}{|l||c|c|c|c|c|} \hline Time (t$ minutes) & $40<t\leqslant60$ & $60<t\leqslant80$ & $80<t\leqslant90$ & $90<t\leqslant100$ & $100<t\leqslant150$ \\
\hline Frequency & 20 & 66 & 48 & 36 & 30 \\
\hline
\end{tabular}

Calculate an estimate of the mean.

[ 4 ]

Question (d)

(d)
Table for Question (d) — CAIE IGCSE Mathematics Extended

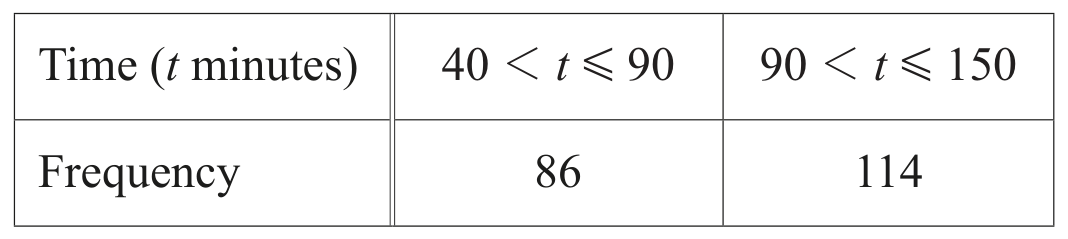
A new table with different class intervals is completed.

\begin{tabular}{|l||c|c|}
\hline Time (t$ minutes) & $40<t\leqslant90 & $90<t\leqslant150$ \\
\hline Frequency & 86 & 114 \\
\hline
\end{tabular}

On a histogram the height of the bar for $40<t\leqslant90$ is 30.4 cm.
Find the height of the bar for $90<t\leqslant150$.

[ 2 ]

9. Statistics question 4

[Maximum number: 11]

Question (a)

(a)

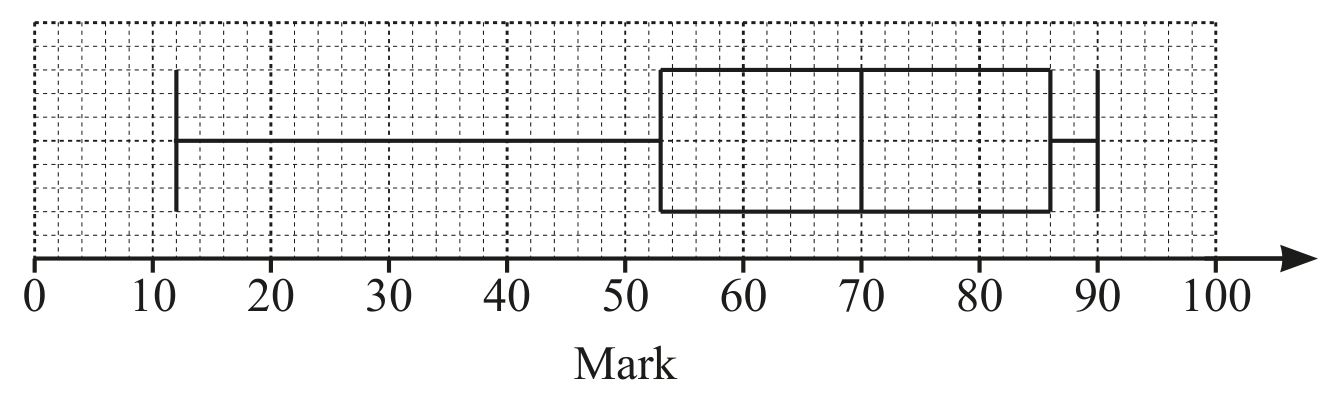
The box-and-whisker plot shows information about the marks scored by some students in a test.

Figure for Question (a) — CAIE IGCSE Mathematics Extended
[ 4 ]

Question (i)

(i)

Write down the median mark.

[ 1 ]

Question (ii)

(ii)

Work out the range.

[ 1 ]

Question (iii)

(iii)

Jais scored a mark in the test that was higher than the marks scored by 75% of the students. Write down a possible mark for Jais.

[ 1 ]

Question (iv)

(iv)

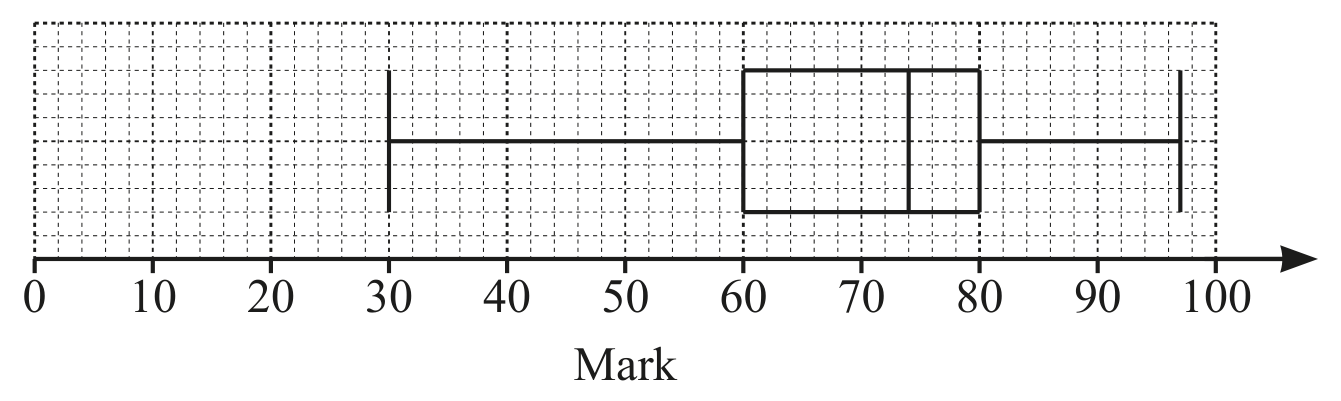
This box-and-whisker plot shows information about the marks scored by the same students in a second test.

Figure for Question (iv) — CAIE IGCSE Mathematics Extended

Make one comparison between the distributions of marks in the two tests.

[ 1 ]

Question (b)

(b)

The table shows information about the height, h cm, of each of 50 plants.

Table for Question (b) — CAIE IGCSE Mathematics Extended

Calculate an estimate of the mean.

[ 4 ]

Question (c)

(c)

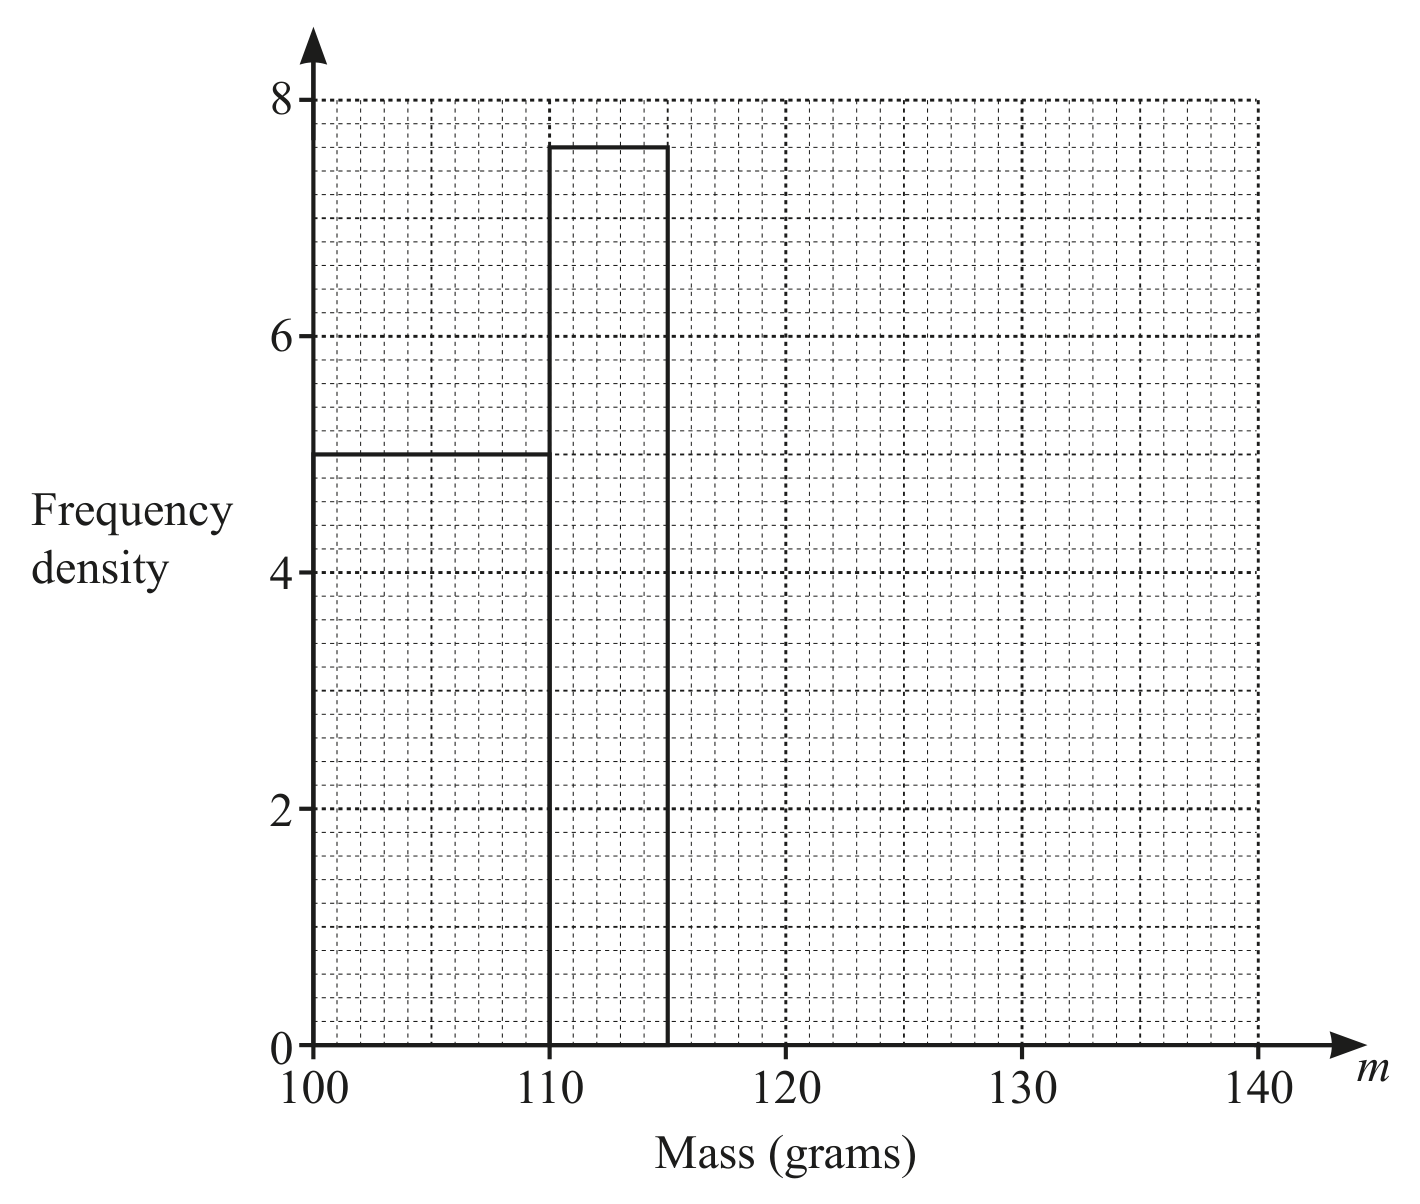
Some apples are weighed and the mass, m grams, of each apple is recorded. The table shows the results.

Table for Question (c) — CAIE IGCSE Mathematics Extended

The histogram shows some of the information from the table.

Figure for Question (c) — CAIE IGCSE Mathematics Extended
[ 3 ]

Question (i)

(i)

Work out the value of x.
x=

[ 1 ]

Question (ii)

(ii)

Complete the histogram.

[ 2 ]
All question bank results loaded