CAIE IGCSE Mathematics Extended Practical Graphs
Practise interpreting and drawing travel, conversion and speed–time graphs and calculating rates or distances from gradients and areas.
- Syllabus
- 2028–2030
- Topic
- E2.9
- Level
- Extended
Practise interpreting and drawing travel, conversion and speed–time graphs and calculating rates or distances from gradients and areas.
The diagram shows the speed-time graph for the first 180 seconds of a train journey.
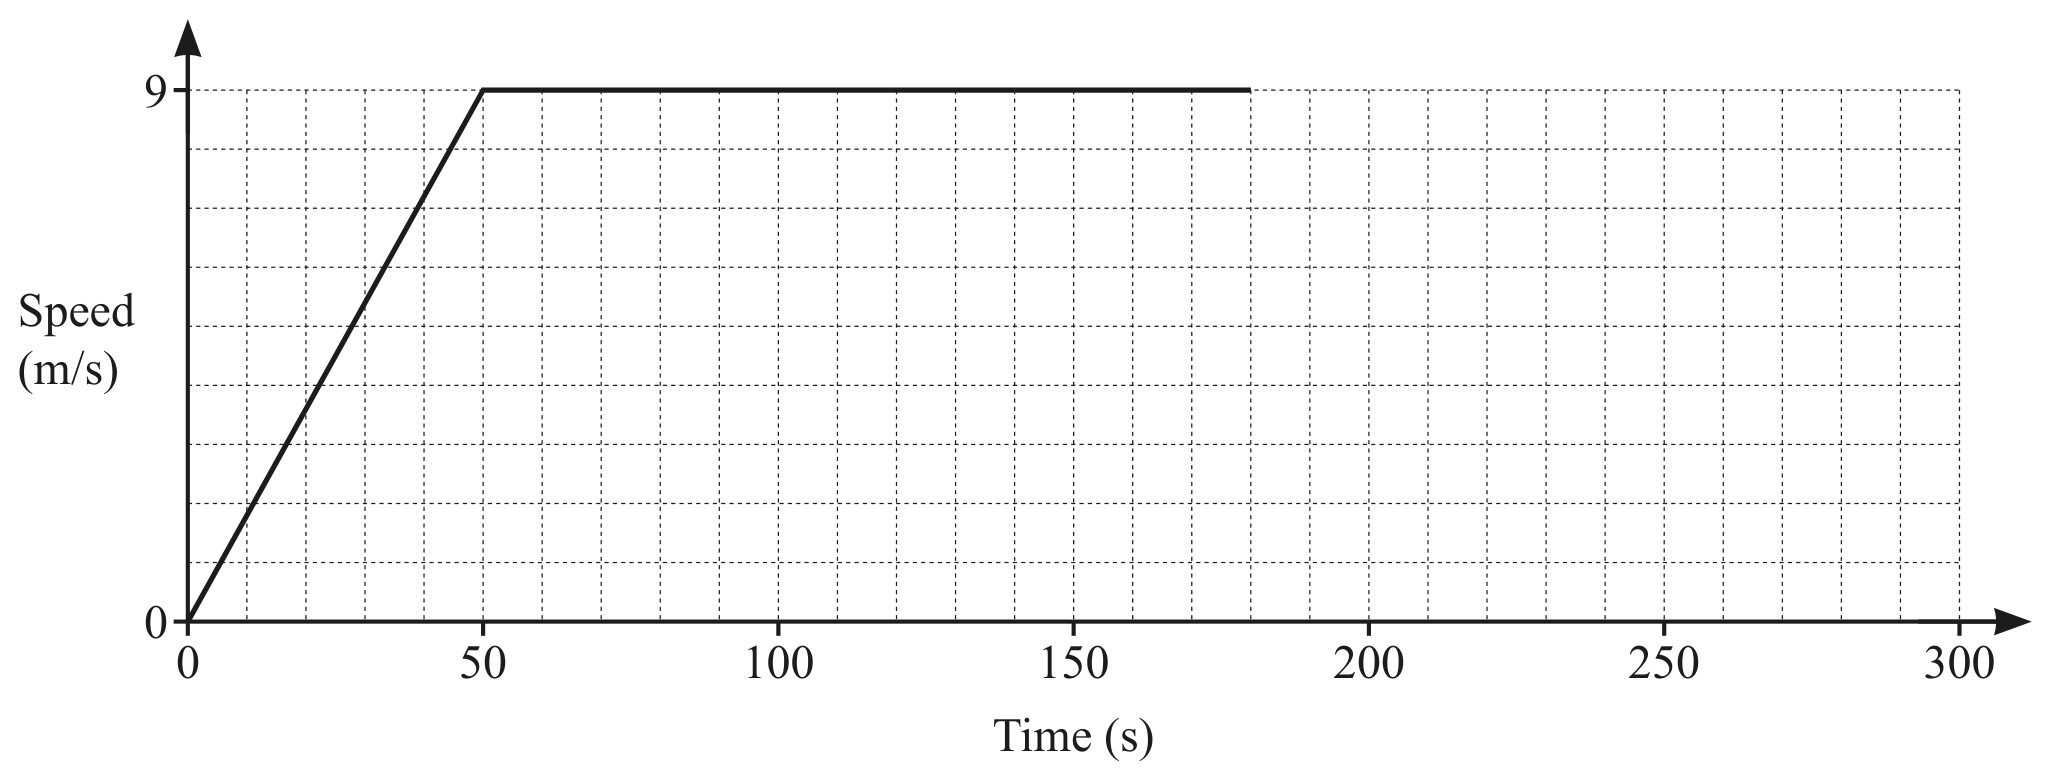
Find the acceleration, in , of the train during the first 50 seconds.
After 180 seconds, the train decelerates at a constant rate of .
Show that the train decelerates for 60 seconds until it stops.
Complete the speed-time graph.
Calculate the average speed of the train for the whole journey.