CAIE IGCSE Mathematics Extended E9.6 Cumulative Frequency Diagrams Question Bank

Practise building cumulative totals, plotting upper class boundaries and reading quantiles or threshold counts from a smooth curve.

Syllabus
2028–2030
Topic
E9.6
Level
Extended

Exam points

  • accumulate class frequencies and plot each total at its upper class boundary
  • draw a smooth increasing curve through clearly marked plotted points
  • read quantiles or counts above a threshold using horizontal and vertical guides

E9.6 Cumulative frequency diagrams question 1

[Maximum number: 3]

Question (a)

(a)

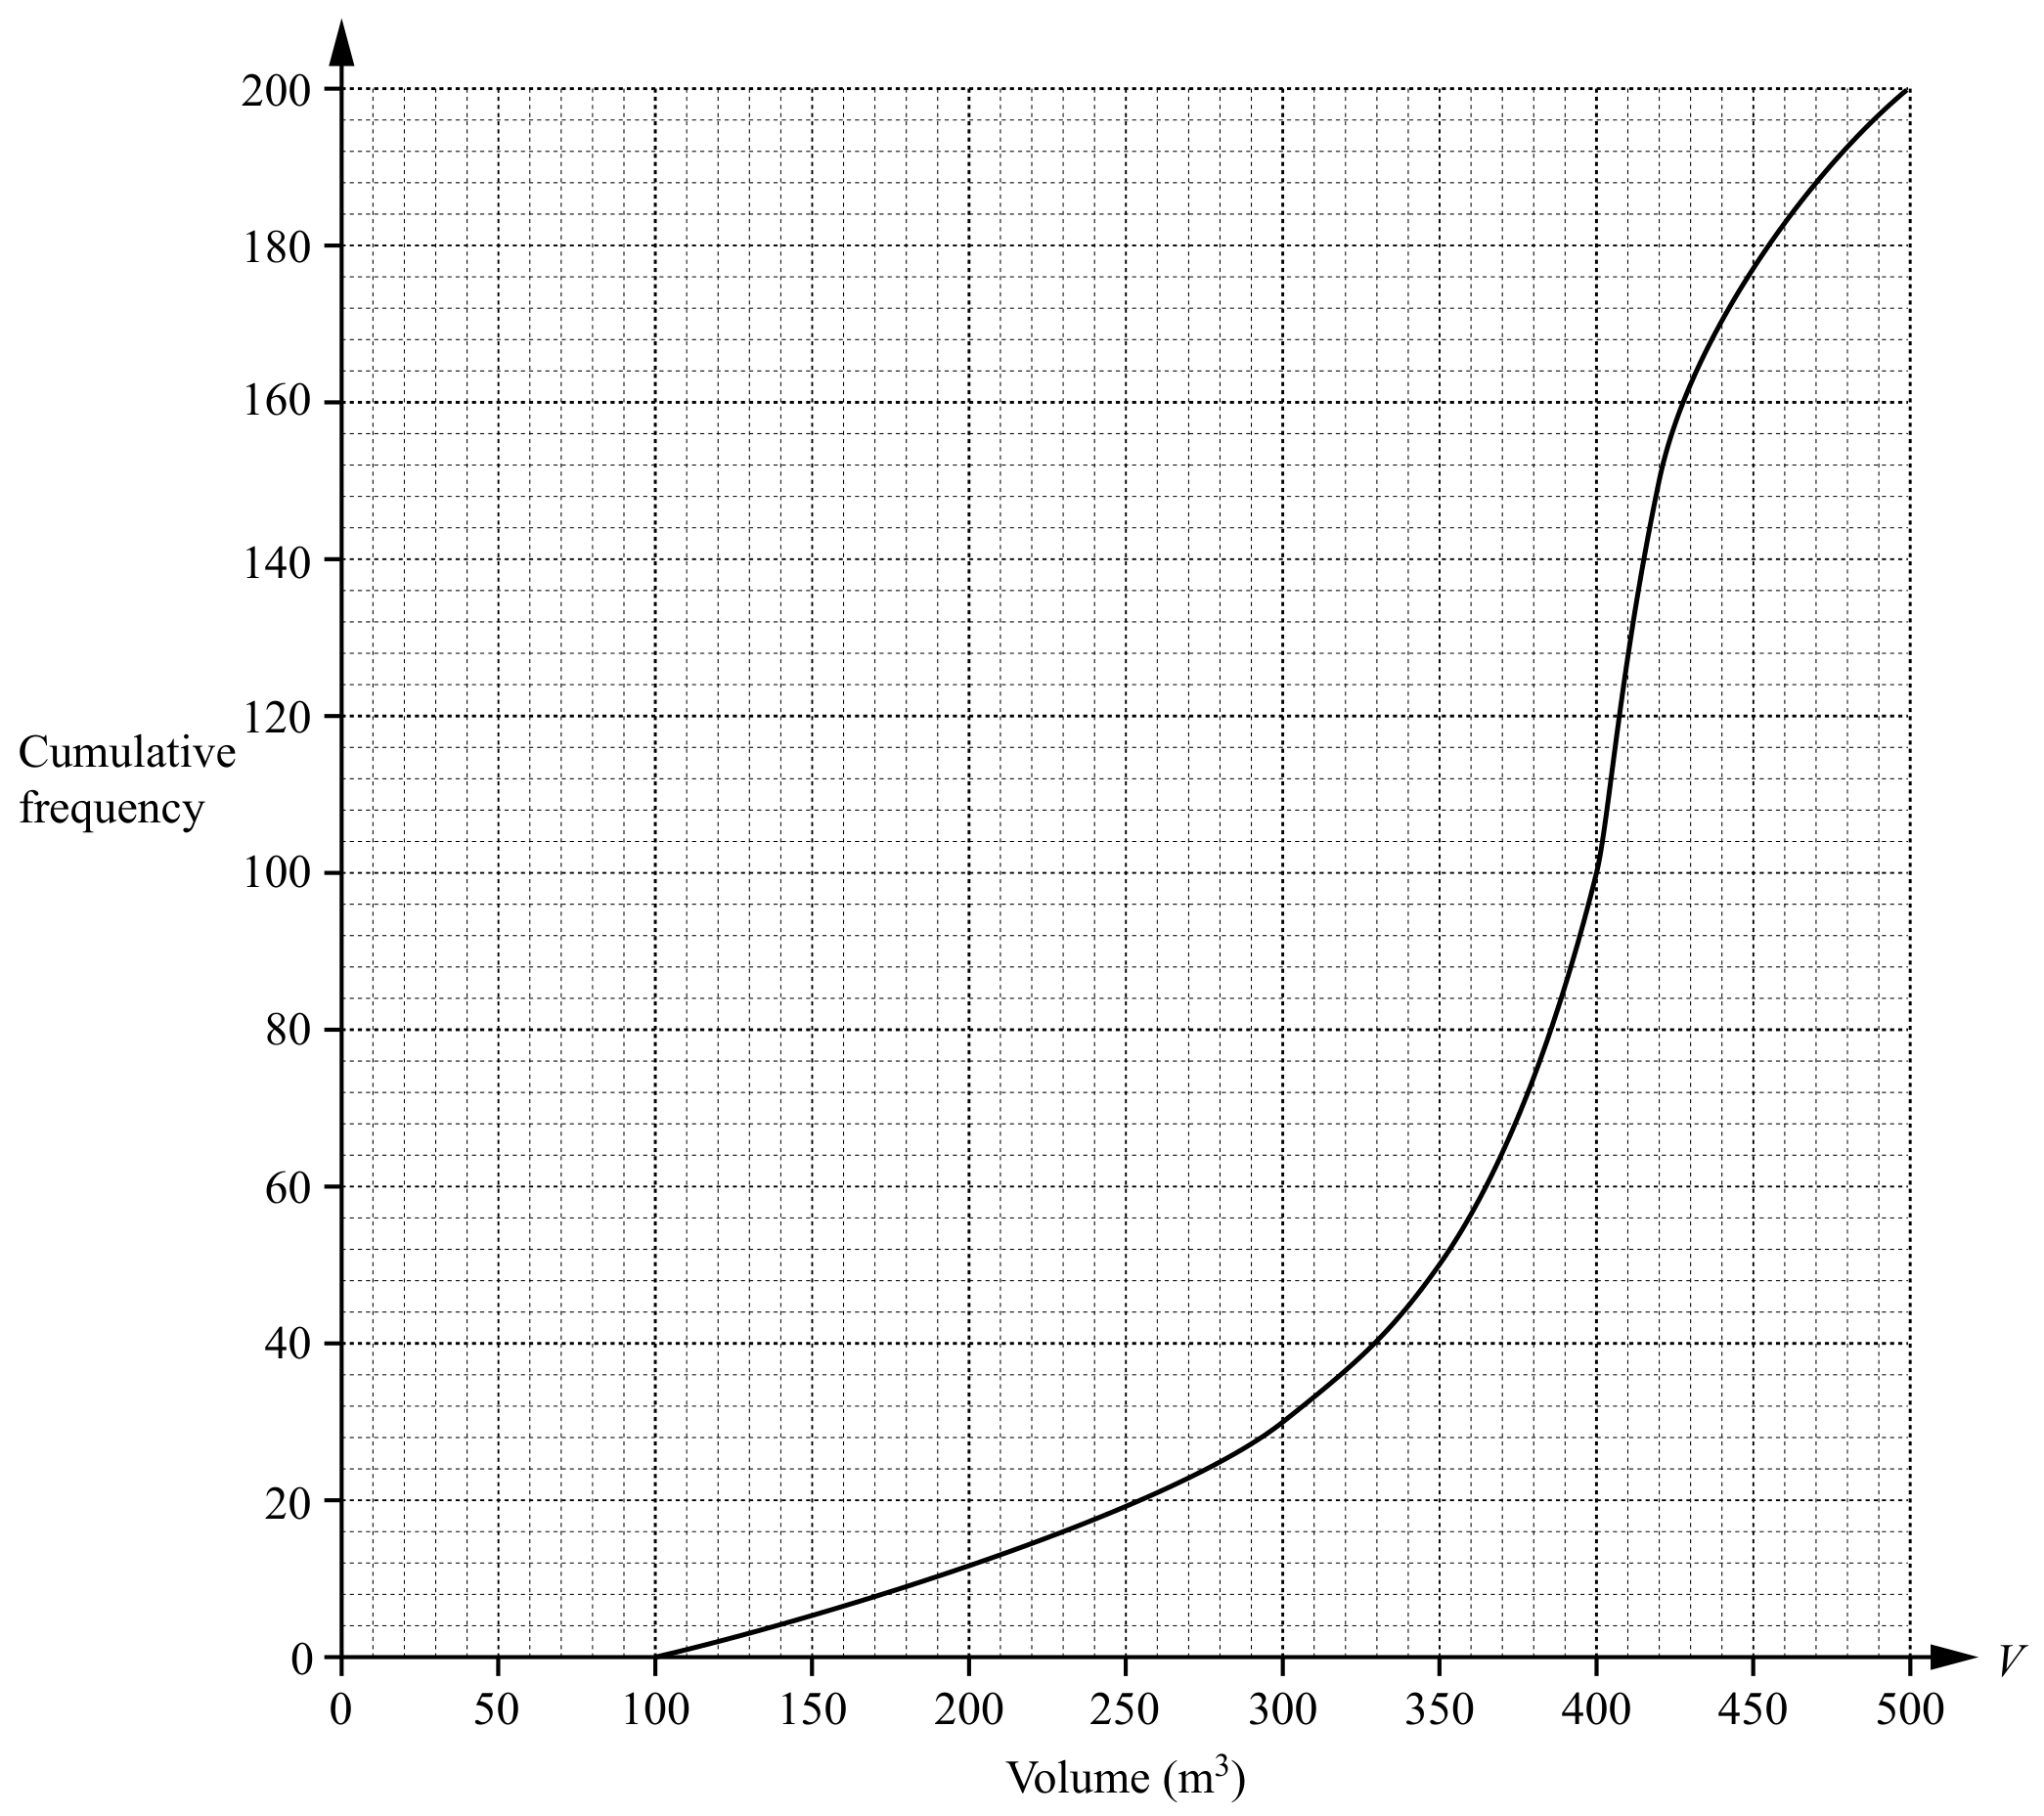
200 students estimate the volume, V m3V \mathrm{~m}^{3}, of a classroom. The cumulative frequency diagram shows their results.

Figure for Question (a) — CAIE IGCSE Mathematics Extended

Use the graph to find an estimate of

[ 3 ]

Question (i)

(i)

the 60th percentile,

___ m^3

[ 1 ]

Question (ii)

(ii)

the number of students who estimate that the volume is greater than 300 m3300 \mathrm{~m}^{3}.

[ 2 ]
All question bank results loaded