IB Physics SL A.3.3 Sankey diagrams
Practise reading and drawing Sankey diagrams, using arrow widths to compare useful output and wasted energy or power.
- Syllabus
- First assessment 2025
- Objective
- —
- Level
- SL
Practise reading and drawing Sankey diagrams, using arrow widths to compare useful output and wasted energy or power.
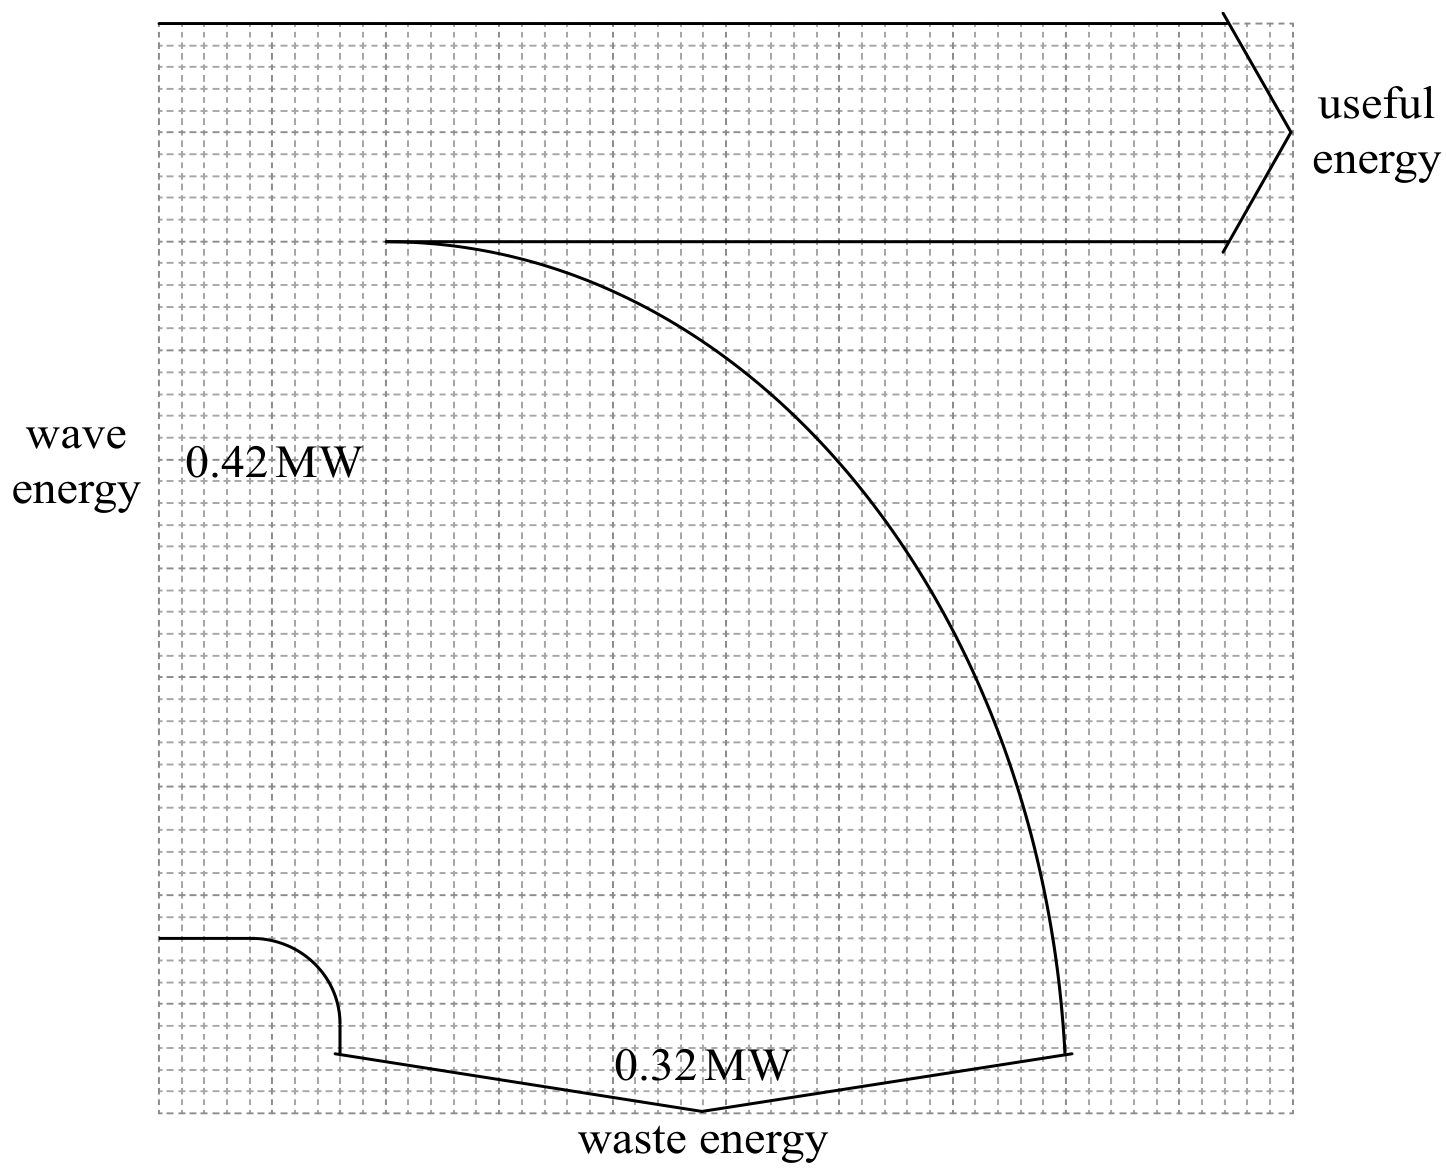
On the grid, sketch a labelled Sankey diagram that represents the energy transformation in this OWC.