CAIE A-Level Economics 7.4.5 Deadweight welfare loss

CAIE A-Level Economics 7.4.5 Deadweight welfare loss
Cambridge International AS & A Level Economics 9708 syllabus for exams in 2026, 2027 and 20282026–2028

Practise using marginal social cost and benefit diagrams to locate output gaps, welfare loss and allocative efficiency.

How this is tested

  • identify the deadweight welfare loss area on externality diagrams
  • predict output changes needed to move from market equilibrium to allocative efficiency
  • explain how positive consumption externalities can leave market output below the efficient level

Question 6

[Maximum number: 1]

The diagram shows market failure caused by negative production externalities.
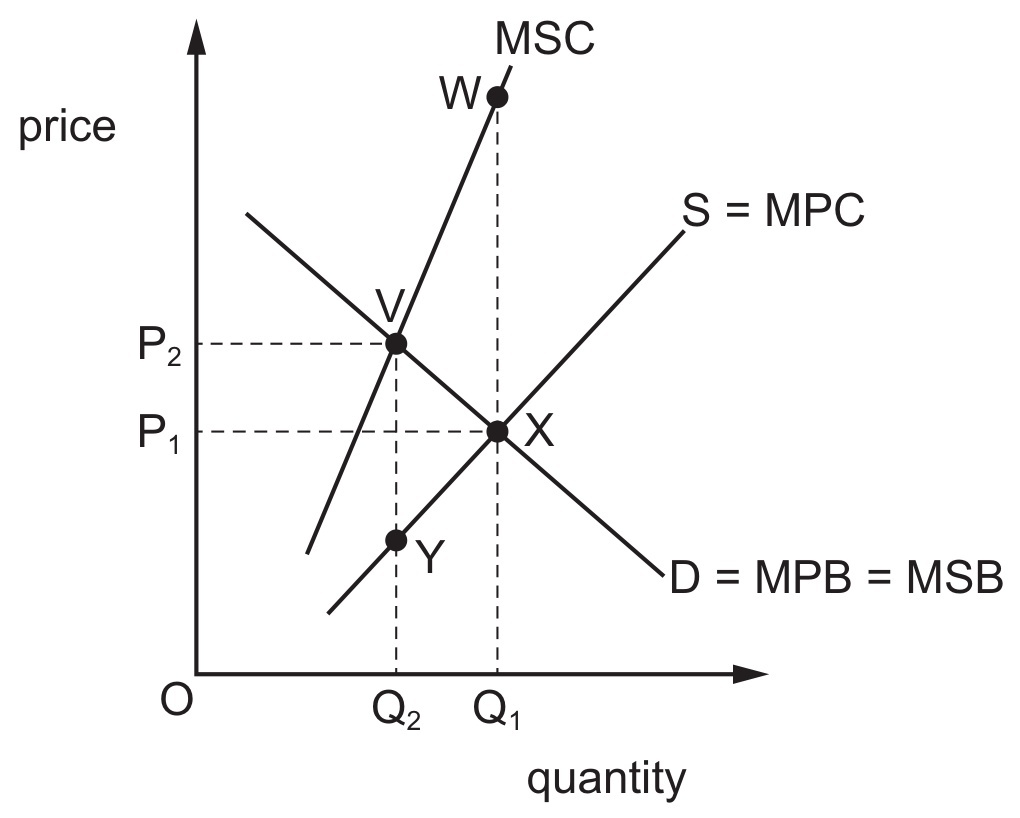
Figure for Question 6 — CAIE A-Level Economics

Identify the correct combination of the result of the market failure and the area on the diagram that shows deadweight welfare loss.

result of market

failure

area showing

deadweight

welfare loss

overproduction

VWX

overproduction

XYV

underproduction

VWX

underproduction

XYV