EduNinja
[Maximum number: 4]

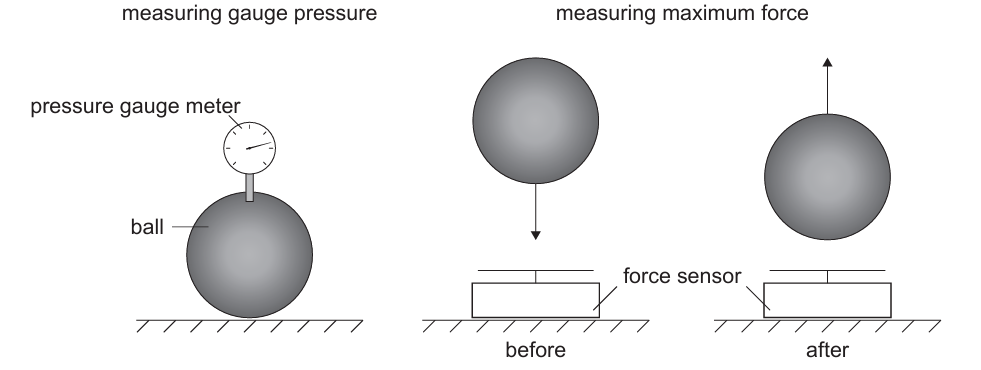
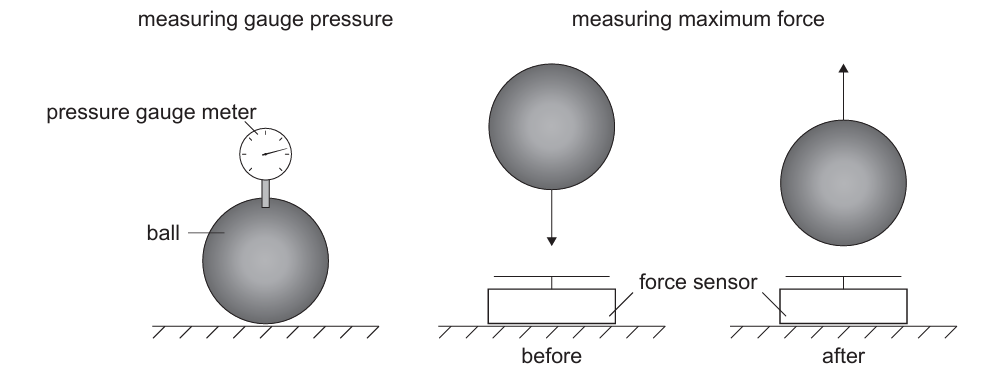
A group of students uses pressurized air to move a piston that forces a nail into a block of wood. A gauge is used to measure the pressure P of compressed air above atmospheric pressure. The nail enters the wood perpendicular to its surface.

Question image

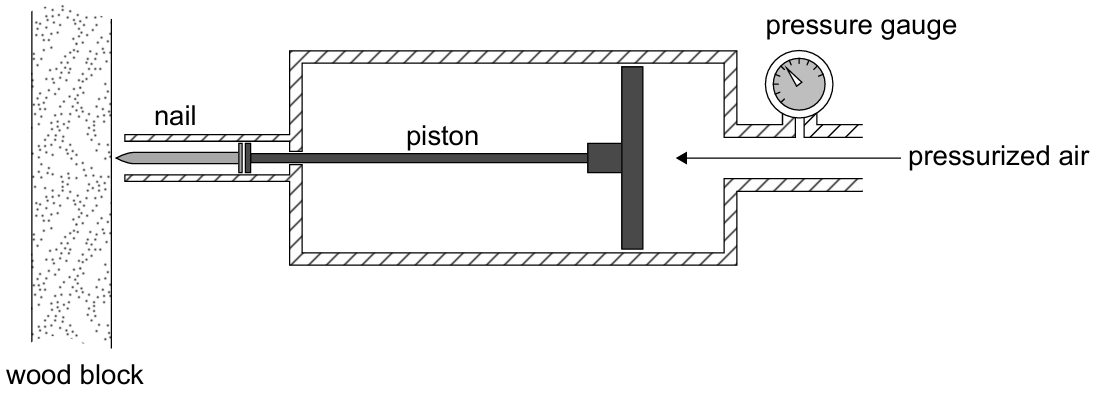
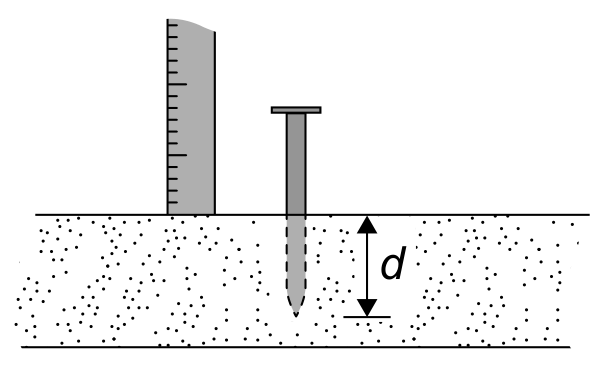
The students use a ruler to measure the length of the nail which remains above the surface of the wood as shown. The depth of the nail inside the wood is d. All necessary length measurements are recorded using a ruler with uncertainty ±1 mm\pm 1 \mathrm{~mm}.

Question image
(a)

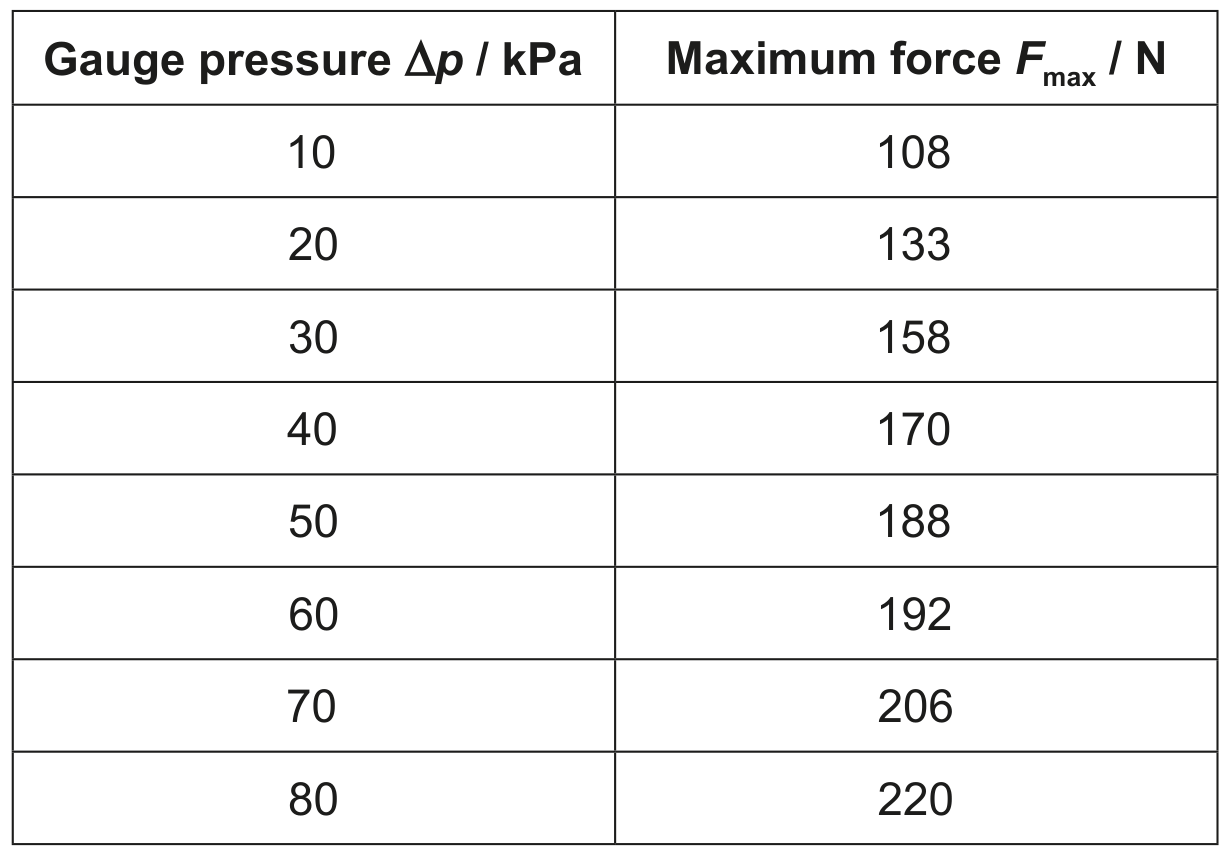
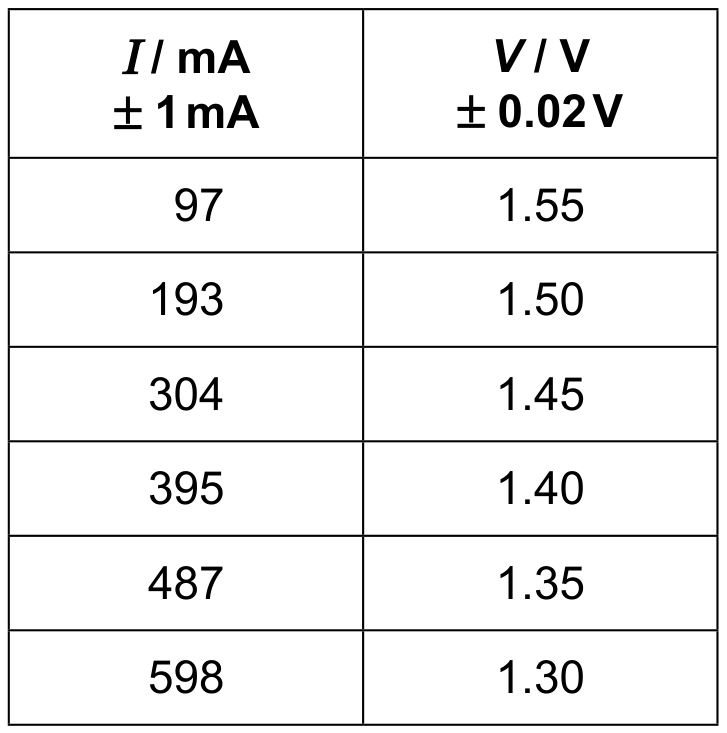
The students systematically increase the pressure and calculate d.

Table
[ 2 ]
(i)

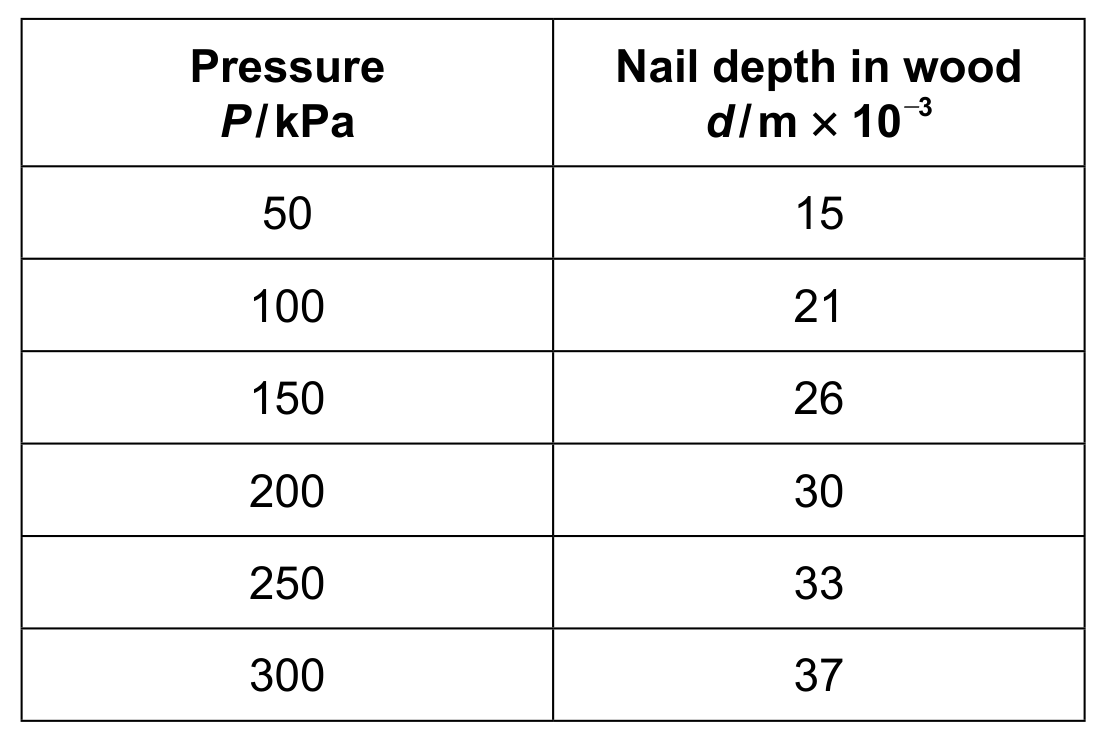
By using two sets of data in the table, show that the relationship between d and P is not directly proportional.

[ 2 ]
(b)

The students suggest the following relationship between d and P :

d=kPd=k \sqrt{P}

where k is a constant.
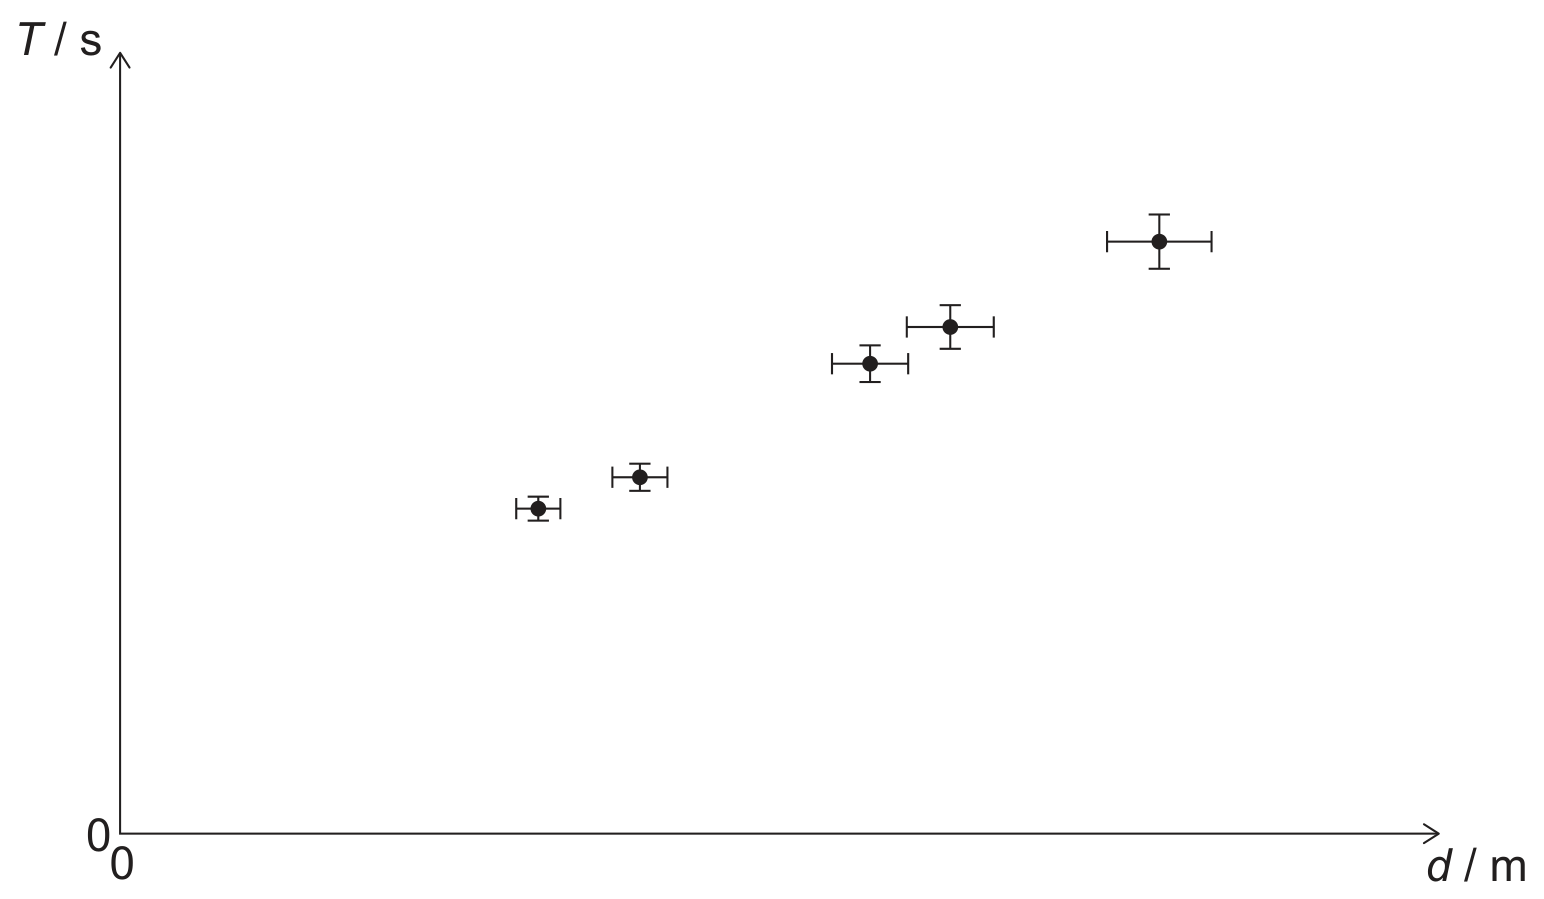
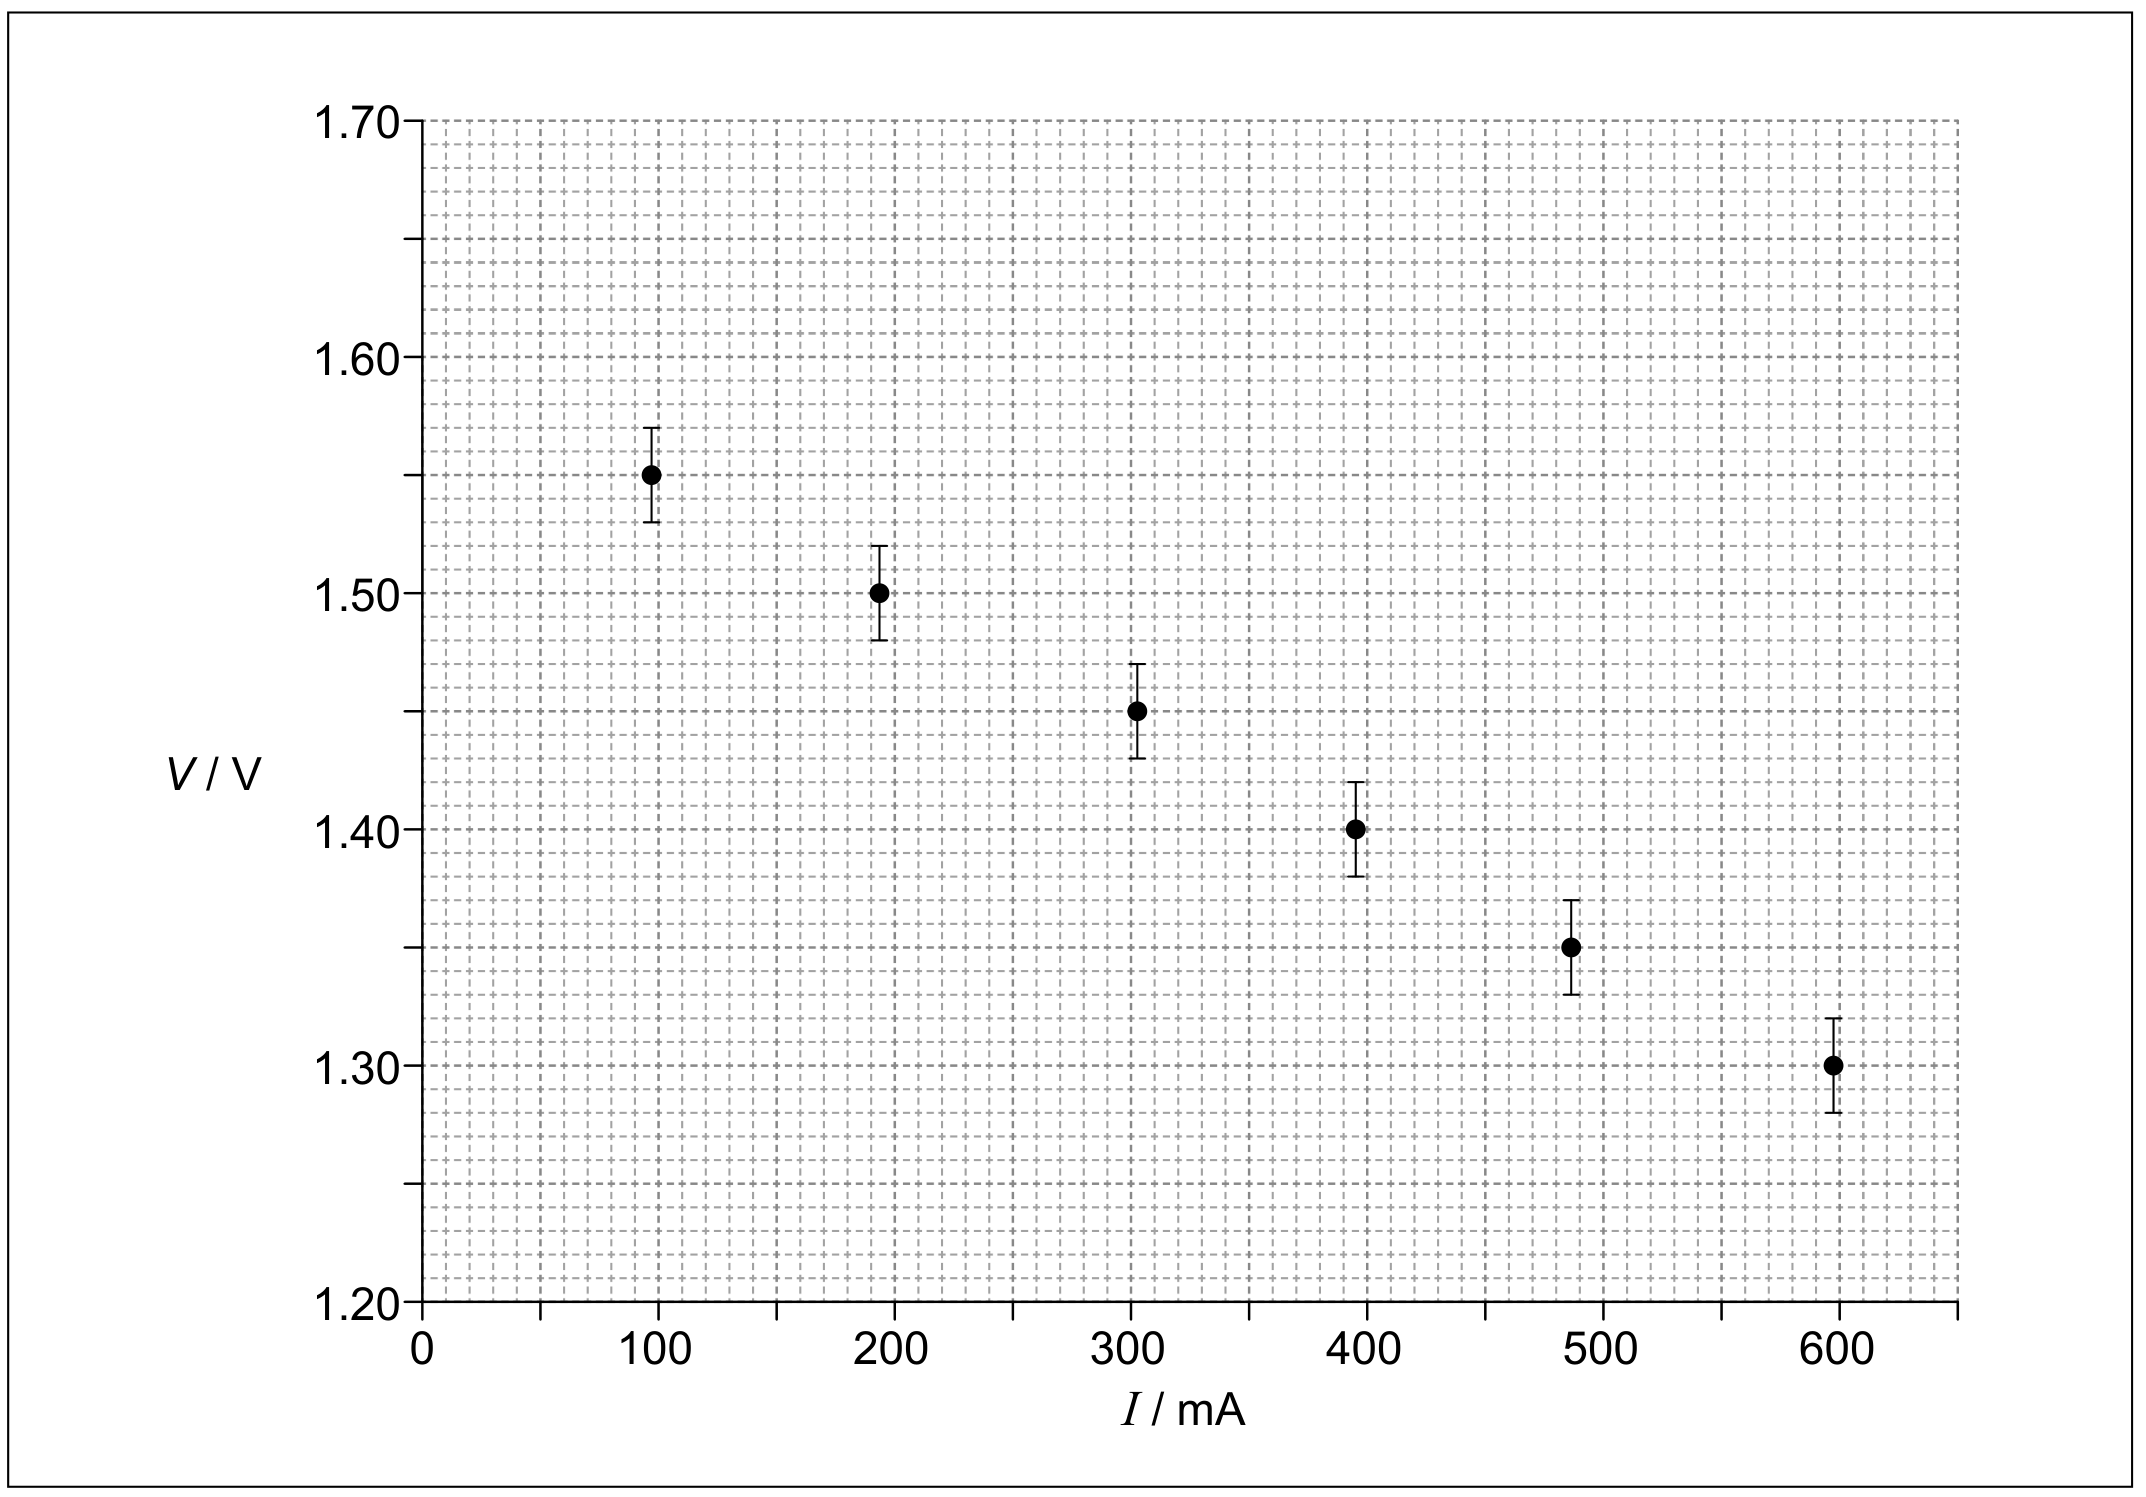
To verify the relationship, the variation of d with P\sqrt{P} is plotted.
One data point is missing.

Question image
[ 1 ]
(i)

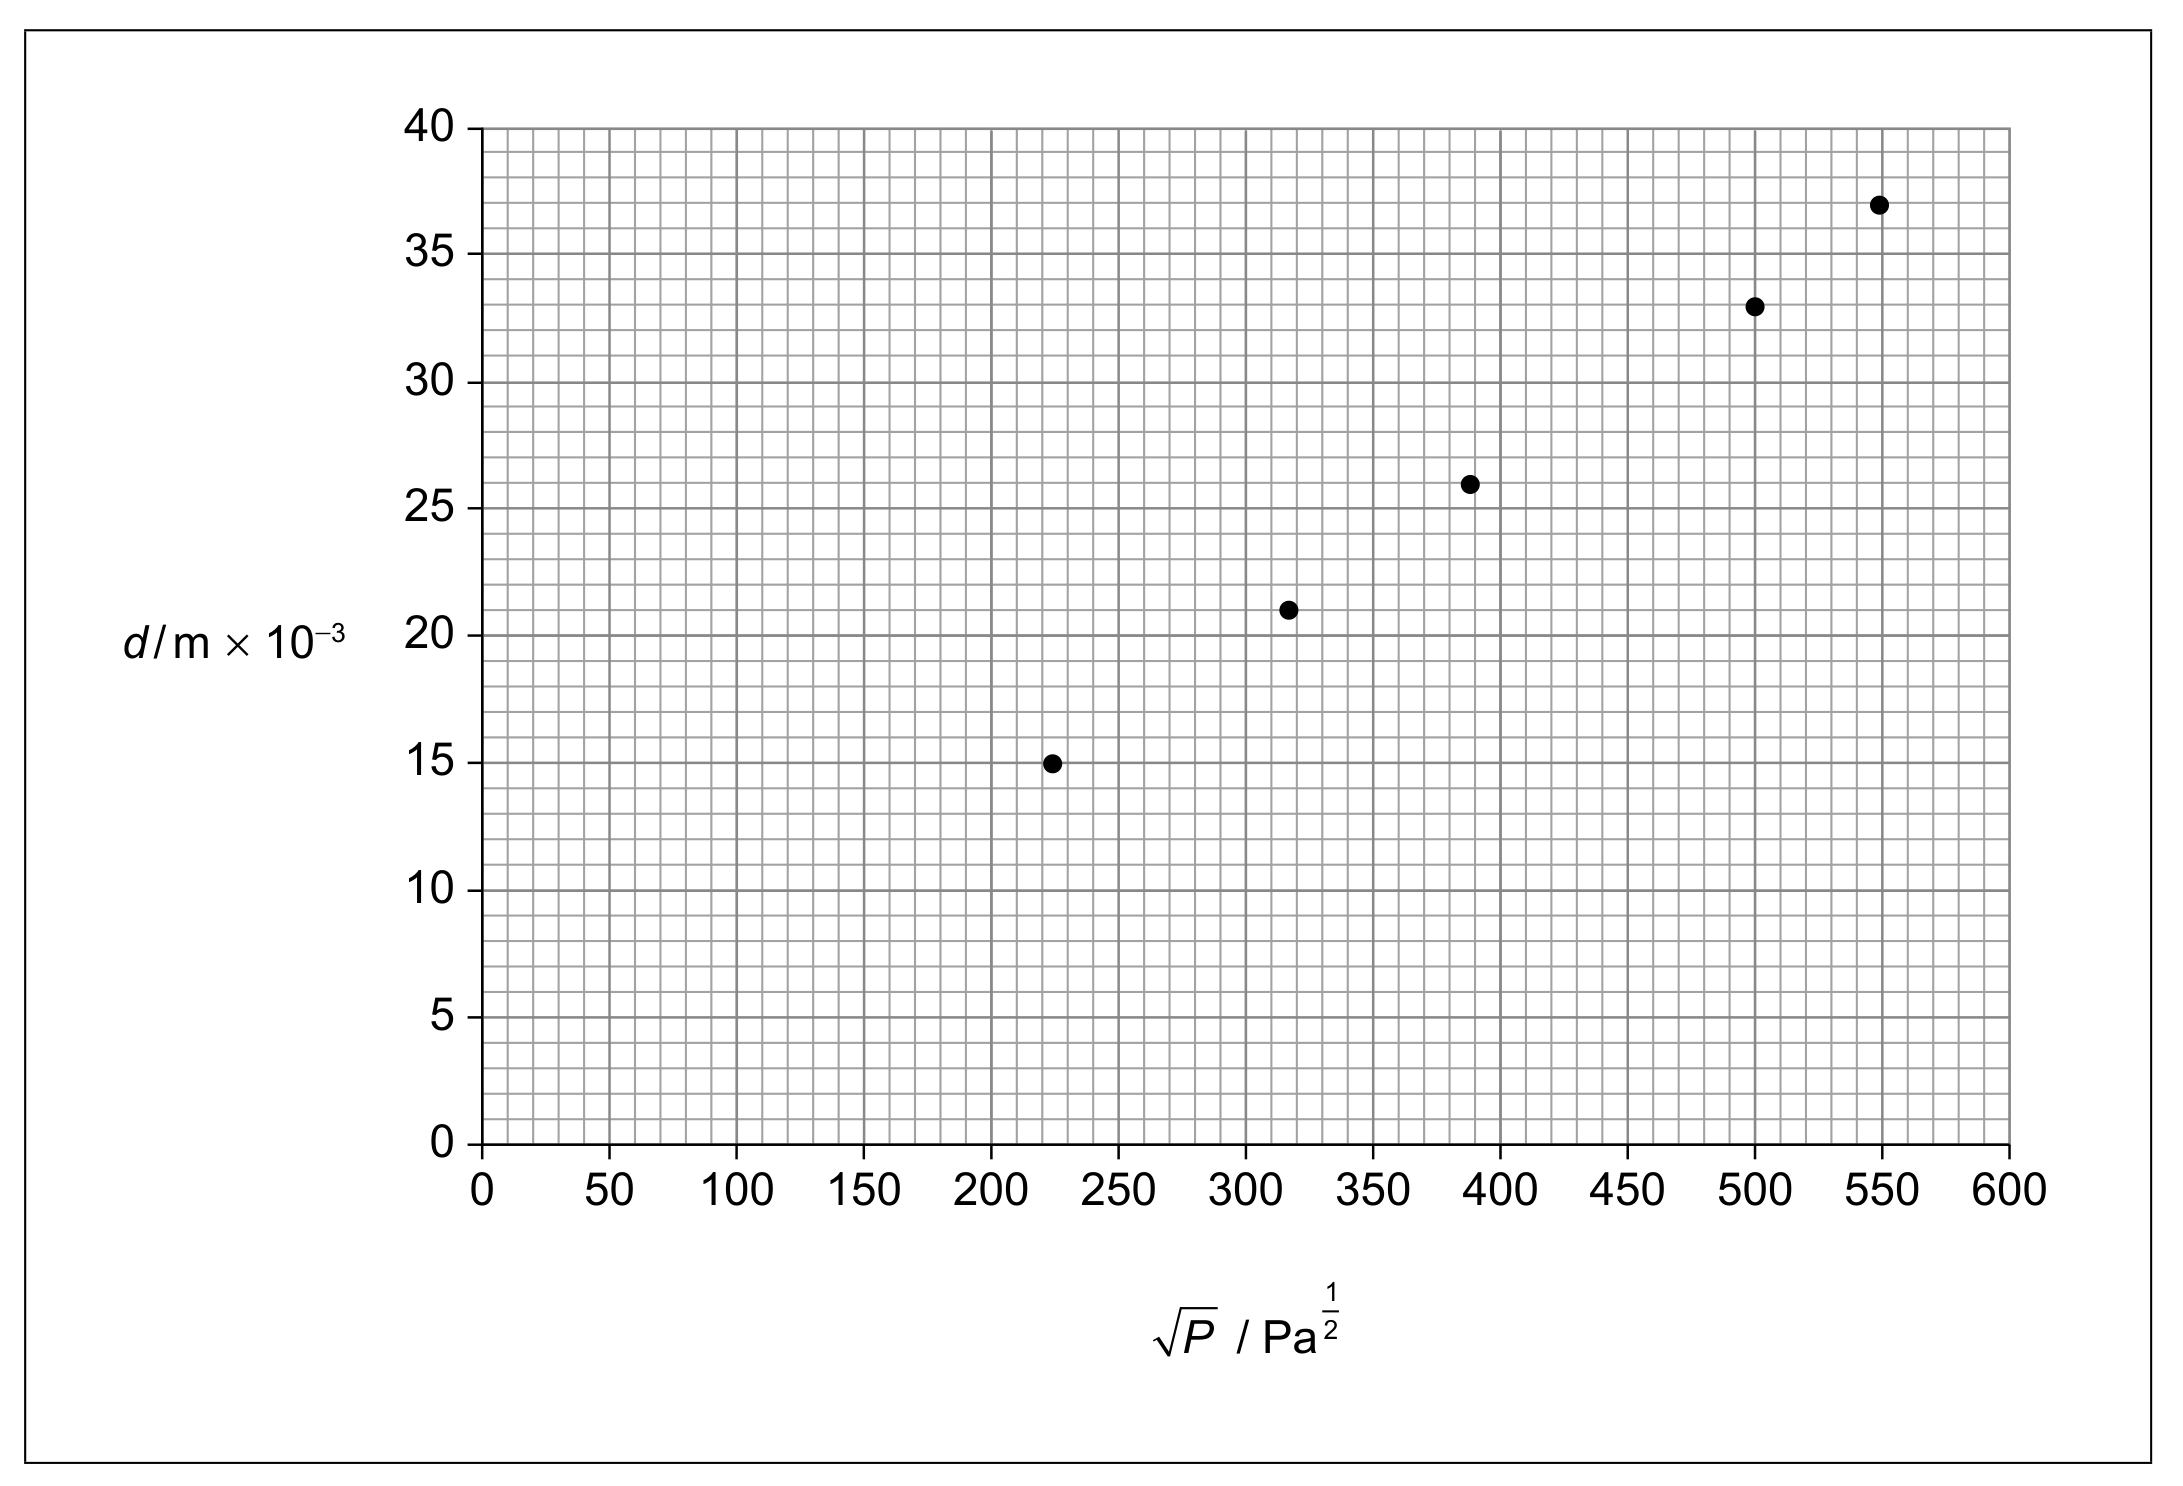
Determine the coordinates of the missing point using the original data set and plot it on the graph.

[ 1 ]
(c)

The students collect only one value of d for each value of P. Suggest why this is a poor method.

[ 1 ]
[Maximum number: 3]

A student performs an experiment with a rod that is free to oscillate in a horizontal plane. Two identical small spheres, each of mass m, are placed at equal distances from the centre of the rod. The student records values of the period of oscillation of the rod T in seconds for different values of the distance of separation of the spheres d, in metres.

Question image

The student plots the variation with d of T, keeping m constant.

Question image
(a)
(i)

The student proposes the hypothesis that T is directly proportional to d. Outline whether the graph supports this model.

[ 1 ]
(b)

The student goes on to investigate the relationship proposed in (b) between T and m, keeping d constant.

Sketch the graph expected for this experiment on the axes provided.

Question image
[ 2 ]
[Maximum number: 3]

A student investigates the relationship between the pressure in a ball and the maximum force that the ball produces when it rebounds.

A pressure gauge measures a difference Δp\Delta p between the atmospheric pressure and the pressure in the ball. A force sensor measures the maximum force Fmax F_{\text {max }} exerted on it by the ball during the rebound.

measuring gauge pressure

measuring gauge pressure

The student collects the following data.

Table

The student initially hypothesizes that Fmax F_{\text {max }} is proportional to Δp\Delta p.

(a)

Deduce, using two suitable data points from the table, that the student's initial hypothesis is not supported.

[ 3 ]
[Maximum number: 4]

A student investigates the relationship between the pressure in a ball and the maximum force that the ball produces when it rebounds.

A pressure gauge measures a difference Δp\Delta p between the atmospheric pressure and the pressure in the ball. A force sensor measures the maximum force Fmax F_{\text {max }} exerted on it by the ball during the rebound.

Question image
(a)

Deduce, using two suitable data points from the table, that the student's initial hypothesis is not supported.

[ 3 ]
(b)
(i)

Explain why the new hypothesis is supported.

[ 1 ]
[Maximum number: 1]

A student attaches one end of a copper wire to an oscillator operating at a fixed frequency. The other end of the wire passes over a pulley to weights that hang vertically. The first harmonic standing wave is established by using the slider to change the length of the wire. The procedure is repeated for different weights.

Question image

The mass m of the weights and the wavelength λ\lambda of the wave are related by

m=μf2gλ2m=\frac{\mu f^{2}}{g} \lambda^{2}

where μ\mu is a constant, f is the frequency of the wave and g=9.8 ms2g=9.8 \mathrm{~ms}^{-2}.

(a)

The graph shows the data obtained by the student, plotted to show the variation of m with λ2\lambda^{2}.

Question image
[ 1 ]
(i)

Identify the evidence for a systematic error in the data.

[ 1 ]
[Maximum number: 2]

A spherical soap bubble is made of a thin film of soapy water. The bubble has an internal air pressure PiP_{\mathrm{i}} and is formed in air of constant pressure PoP_{\mathrm{o}}. The theoretical prediction for the variation of ( PiPoP_{\mathrm{i}}-P_{\mathrm{o}} ) is given by the equation

(PiPo)=4 gR\left(P_{\mathrm{i}}-P_{\mathrm{o}}\right)=\frac{4 \mathrm{~g}}{R}

where γ\gamma is a constant for the thin film and R is the radius of the bubble.
Data for ( PiPoP_{\mathrm{i}}-P_{\mathrm{o}} ) and R were collected under controlled conditions and plotted as a graph showing the variation of ( PiPoP_{\mathrm{i}}-P_{\mathrm{o}} ) with 1R\frac{1}{R}.

Question image
(a)

Suggest whether the data are consistent with the theoretical prediction.

[ 2 ]
[Maximum number: 3]

A student investigates the electromotive force (emf) ε\varepsilon and internal resistance r of a cell.

Question image

The current I and the terminal potential difference V are measured.
For this circuit V=εIrV=\varepsilon-I r.
The table shows the data collected by the student. The uncertainties for each measurement are shown.

Table

The graph shows the data plotted.

Question image
(a)

Determine, using the graph, the emf of the cell including the uncertainty for this value. Give your answer to the correct number of significant figures.

[ 3 ]
(a)

Explain whether the data support the hypothesis that v is directly proportional to W.

[ 1 ]
0