[Maximum number: 1]
The graph shows the relationship between two quantities p and q. The gradient of the graph is r and the intercept on the p axis is s.
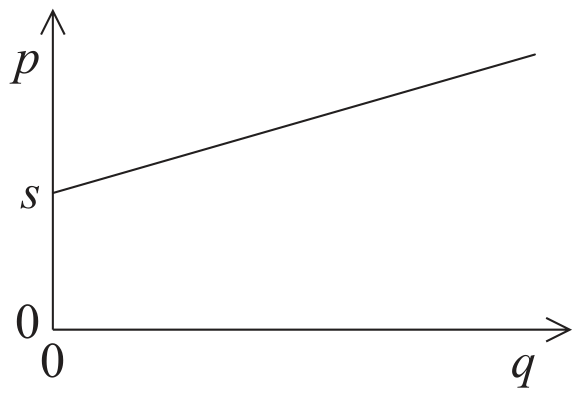
Which of the following is the correct relationship between p and q ?
A
p=s q+r
B
p=r q+s
C
p=r q-s
D
p=r s+q