Data analysis question.
An experiment is undertaken to investigate the relationship between the temperature of a ball and the height of its first bounce.
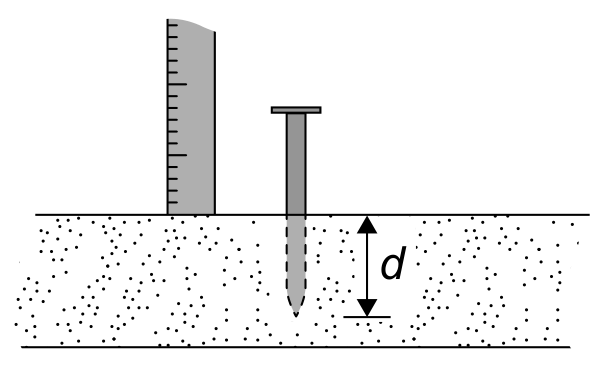
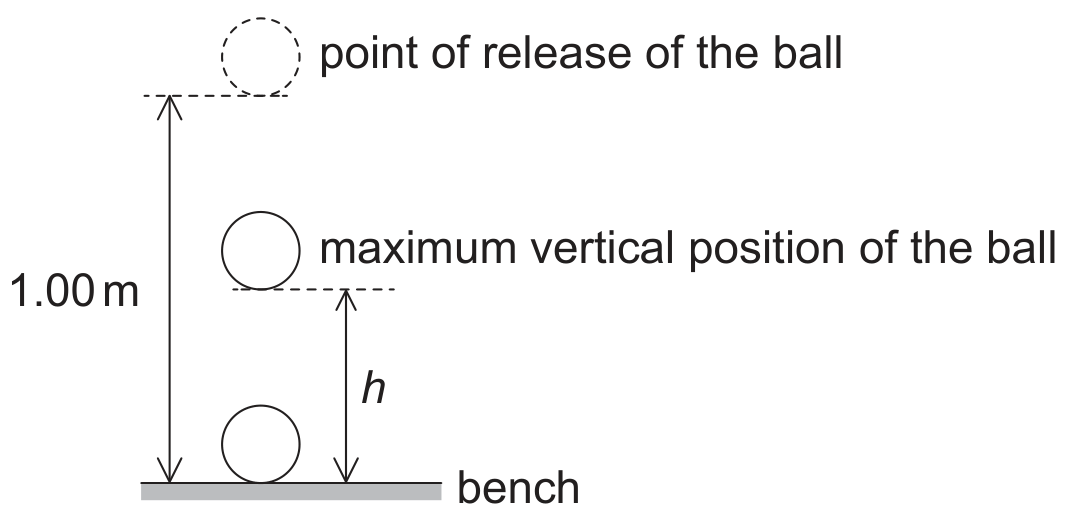
A ball is placed in a beaker of water until the ball and the water are at the same temperature. The ball is released from a height of 1.00 m above a bench. The maximum vertical height h from the bottom of the ball above the bench is measured for the first bounce. This procedure is repeated twice and an average is calculated from the three measurements.
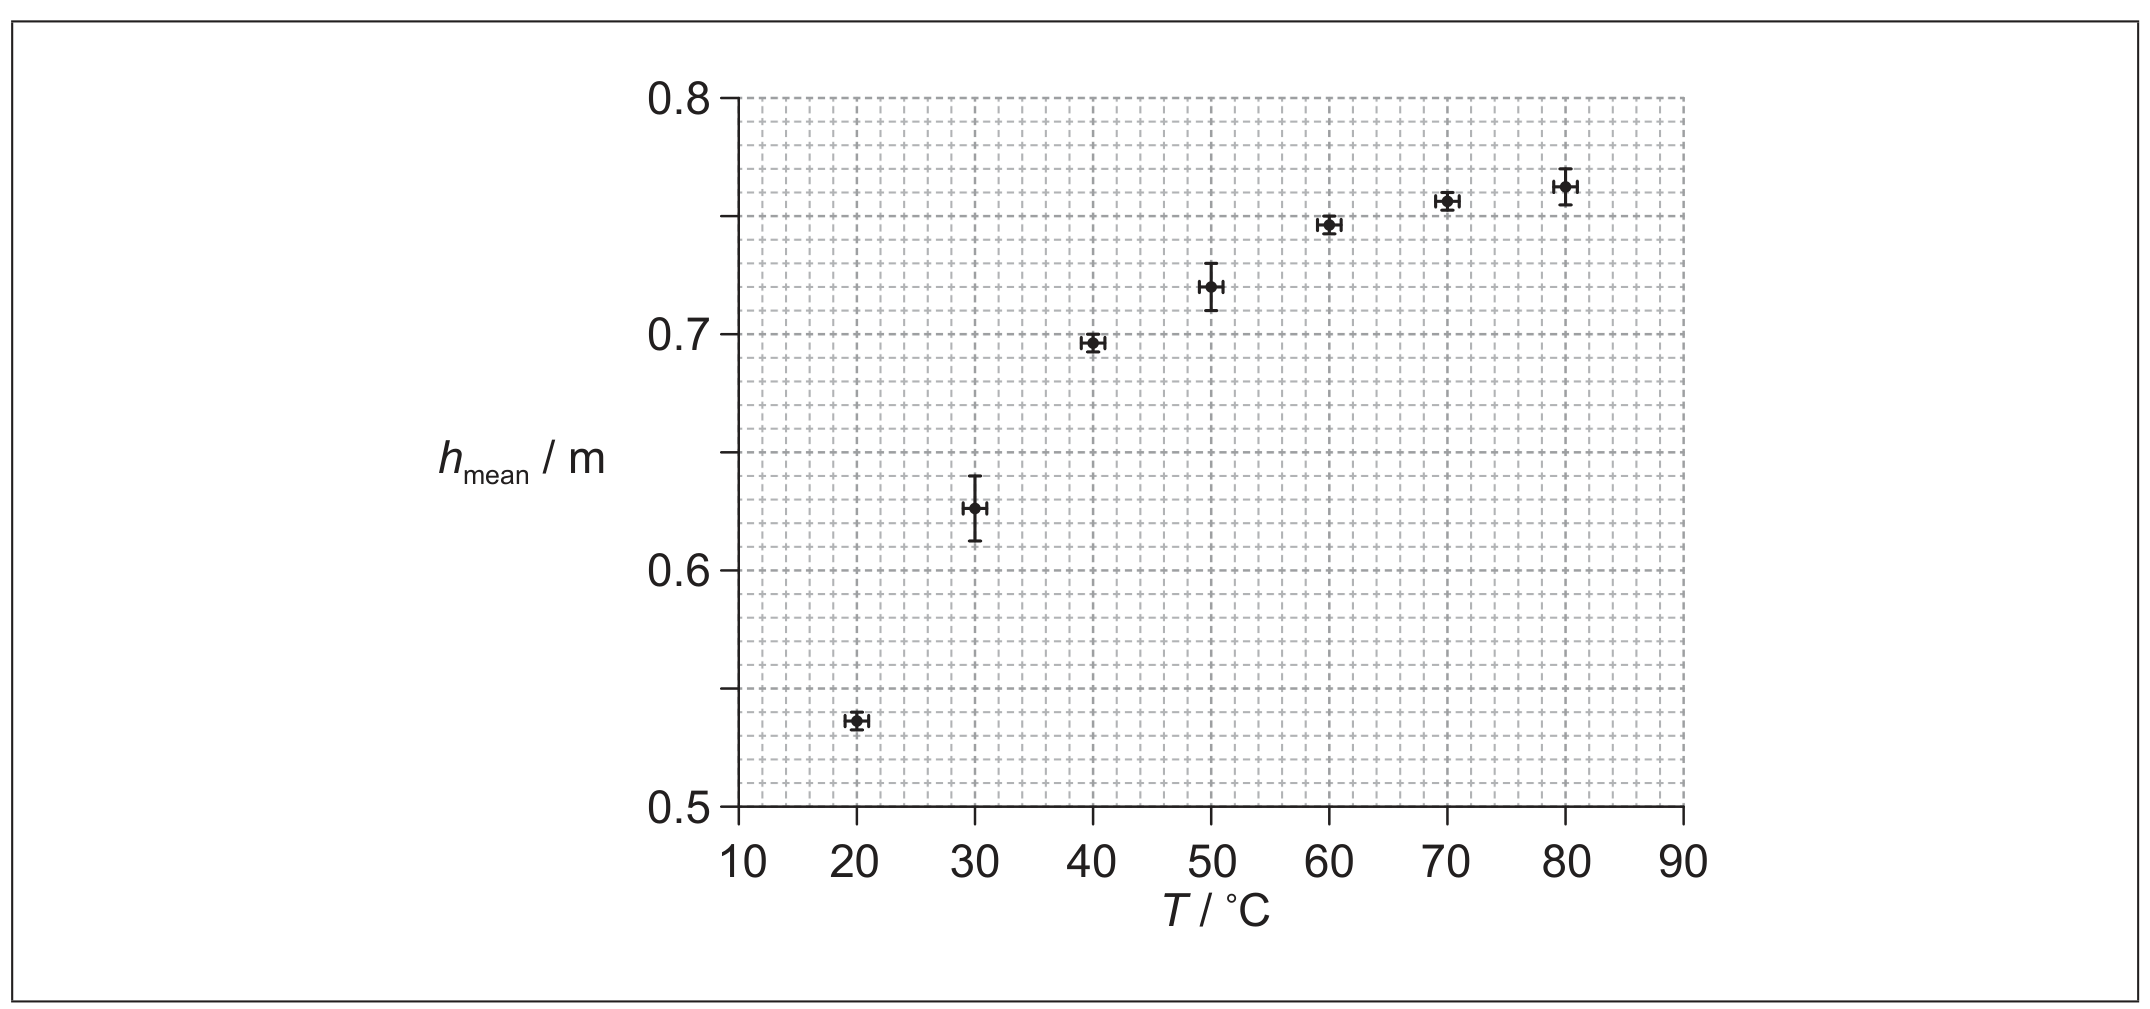
The procedure is repeated for a range of temperatures. The graph shows the variation of with temperature T.
State the uncertainty in each value of T.
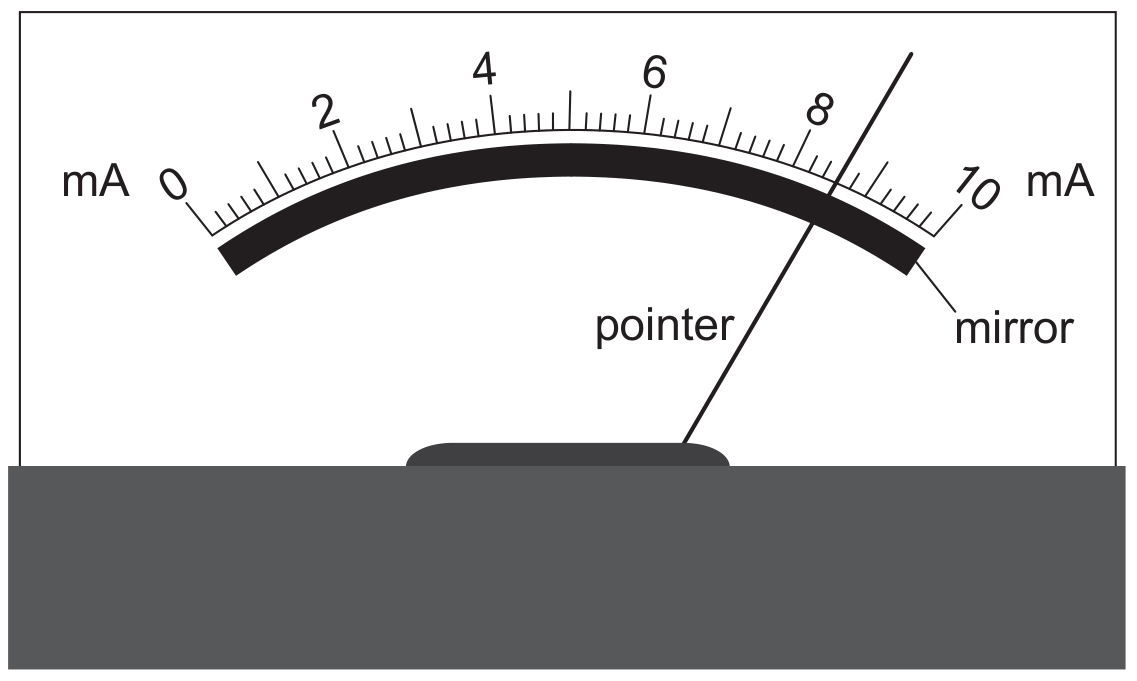
The temperature is measured using a liquid in glass thermometer. Explain why it is likely that the uncertainty in T is constant.