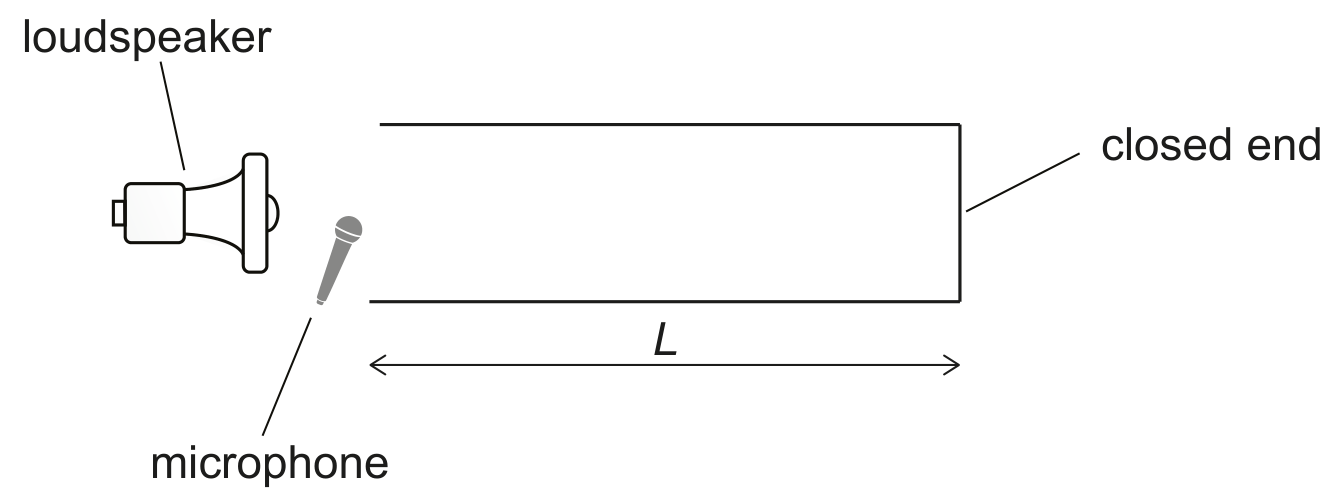
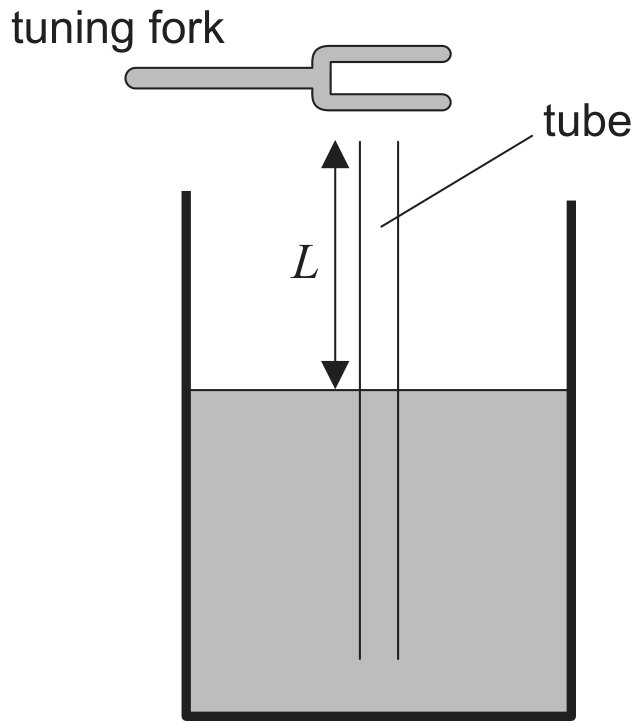
Student A conducts an experiment to determine the speed of sound in air using tubes of different lengths. Each tube is open at one end and closed at the other end.
A short pulse of sound is produced by a loudspeaker near the open end of each tube. A microphone is placed at the open end of each tube and detects the sound entering and leaving the tube.

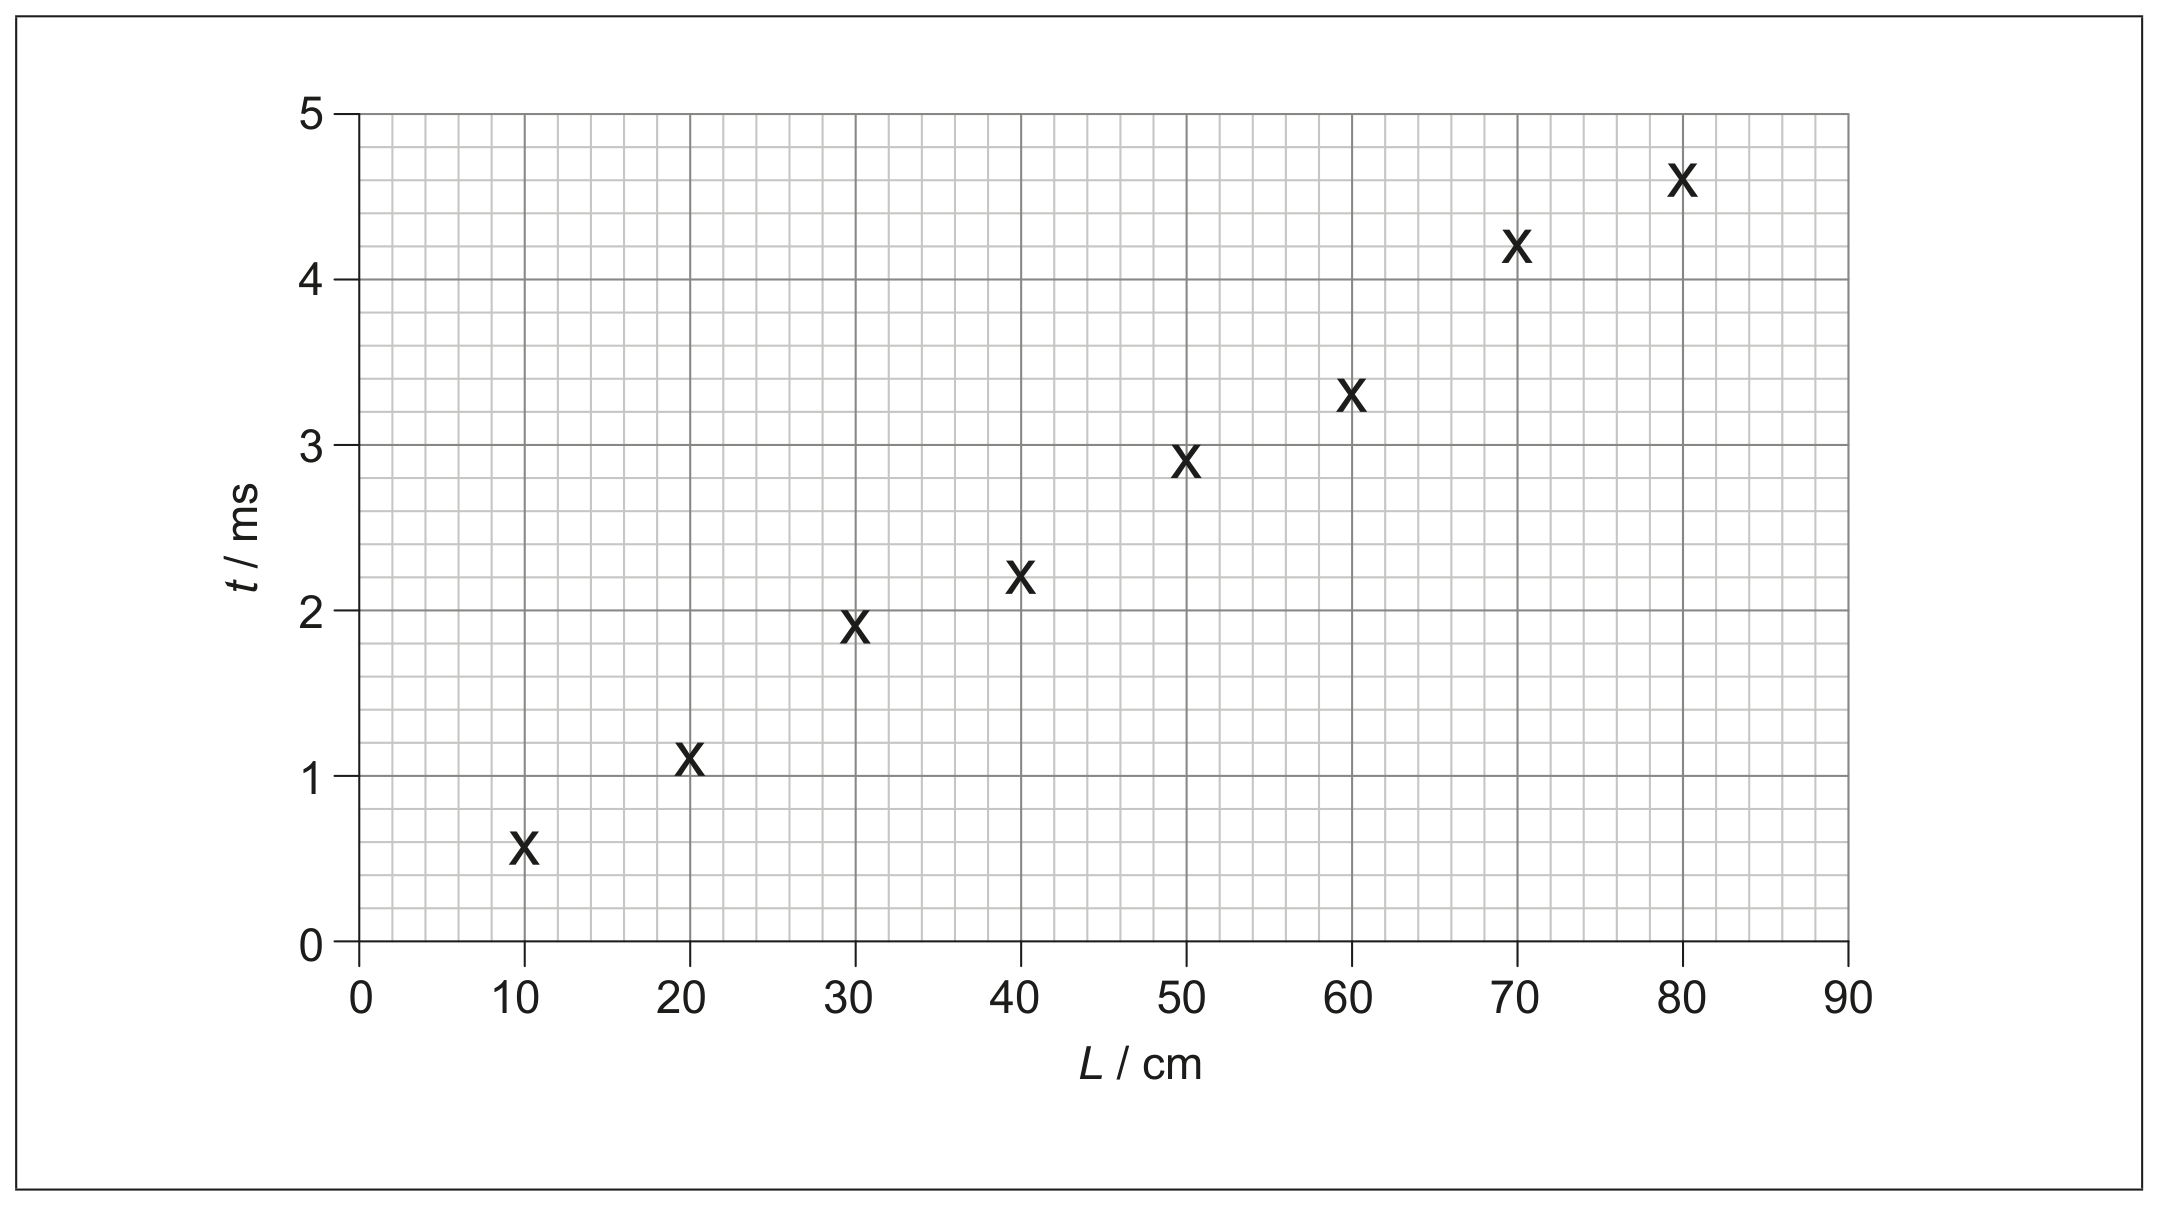
The graph shows the variation with tube length L of the time t for the sound to travel along the tube and be reflected back.

The percentage uncertainty in each time measurement is 9 %. The uncertainty in L is negligible.
Student B conducts the same experiment and analysis but places the microphone 10 cm to the left of the open end of each tube.
Compare, with reference to the graphs drawn, the value for speed of sound obtained by student B to that of student A.