Q BankQuestion BankDocsDocuments

B4.1.4—Range of tolerance of limiting factor

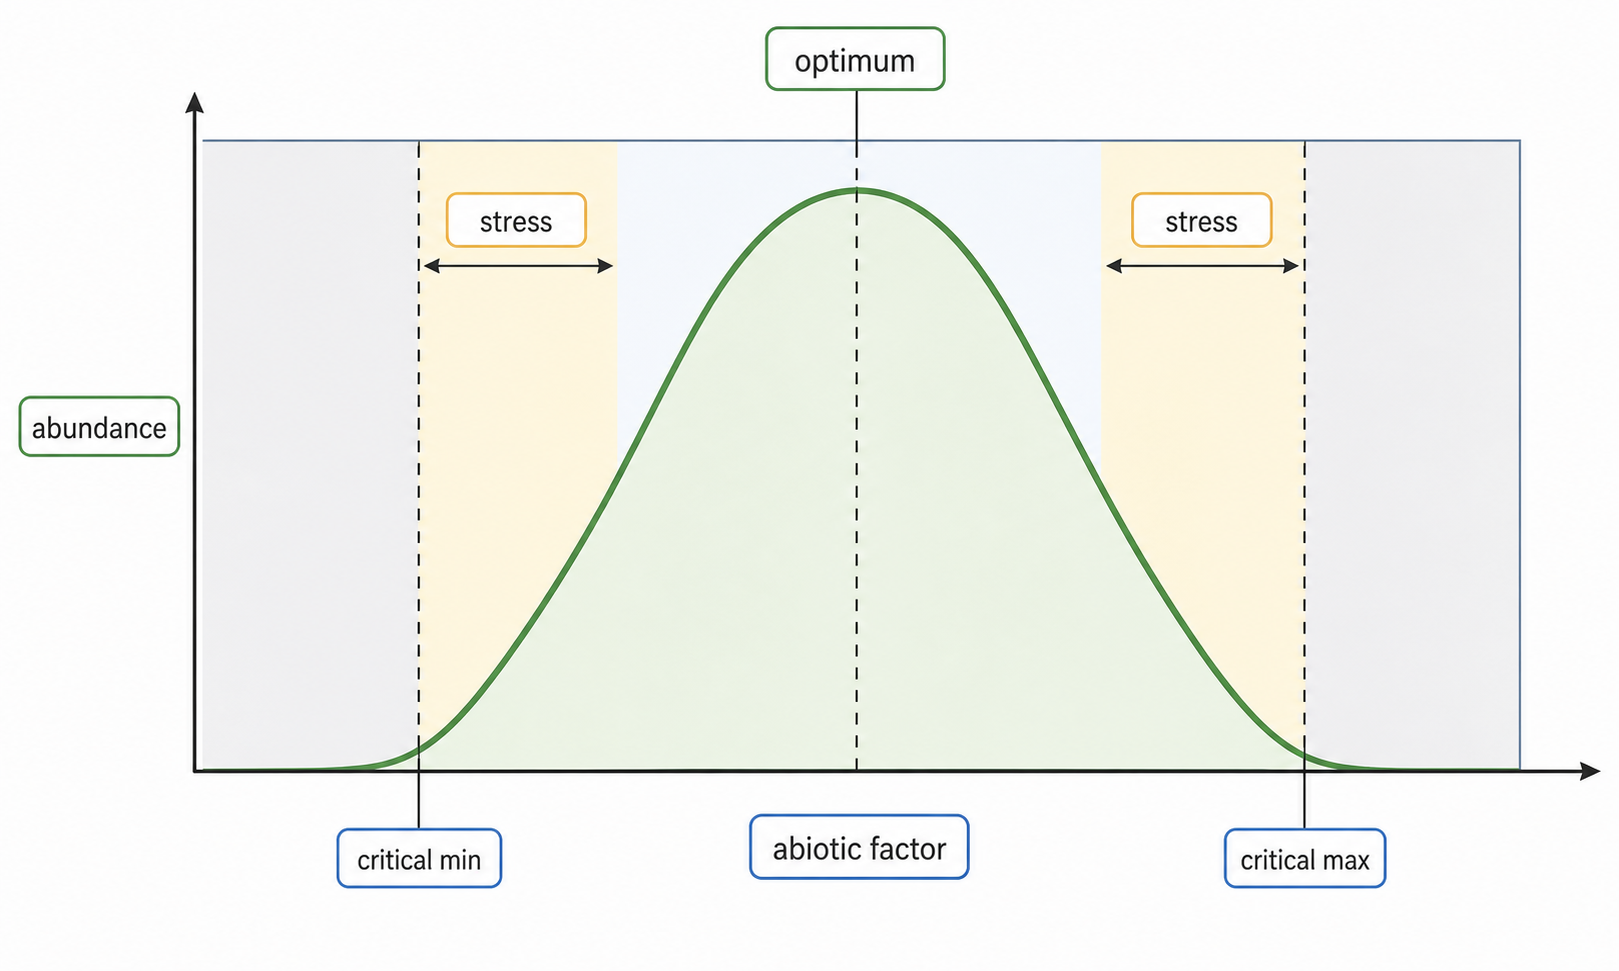
Tolerance ranges explain distribution because organisms perform best near optima and decline near critical minimum or maximum environmental limits of survival.

Syllabus
First assessment 2025
Objective
B4.1.4
Level
SL

Exam analysis

Chance of appearing5%of analysed past papers
Latest appearanceNovember 2025
Most common paperPaper2
Typical marks1–2

Common command terms

  • Evaluate
  • Deduce
  • Outline
  • Identify
  • Calculate
  • Analyse
  • Predict

Scoring notes

Common mistake
Treating a weak correlation or captive study as conclusive proof of distribution in the wild.

Recent exam appearances

November 2025Paper2 ["SL"] · TZ11(f)[ 2 ]B4.1.4—Range of tolerance of limiting factor
November 2025Paper2 ["SL"] · TZ11(e)[ 3 ]B4.1.4—Range of tolerance of limiting factor
November 2025Paper2 ["SL"] · TZ11(c)[ 1 ]B4.1.4—Range of tolerance of limiting factor
November 2025Paper2 ["SL"] · TZ11(b)[ 1 ]B4.1.4—Range of tolerance of limiting factor
November 2025Paper2 ["SL"] · TZ11(a)[ 1 ]B4.1.4—Range of tolerance of limiting factor
Practice this objective

Coverage 2012–2025 · Updated 15 Jul 2026

Concept essentials

  • Organisms have ranges of tolerance for abiotic factors.
  • Performance is highest near the optimum zone.
  • Zones of stress reduce growth, survival or reproduction.
  • Critical limits can exclude organisms from habitats.
  • Tolerance evidence must be evaluated using the strength and limits of the data.
ConceptIB Biology SL