B4.1.3—Abiotic variables affecting distribution

Abiotic variables such as temperature, water, light, pH, salinity, nutrients and substrate conditions strongly affect species distribution patterns in ecosystems.

Syllabus
First assessment 2025
Objective
B4.1.3
Level
SL

Exam analysis

Chance of appearing9%of analysed past papers
Latest appearanceNovember 2025
Most common paperPaper3
Typical marks1–2

Common command terms

  • Outline
  • Describe
  • State
  • Suggest
  • Discuss
  • Identify
  • Distinguish

Scoring notes

Common mistake
Listing abiotic factors without giving a biological reason for their effect.

Recent exam appearances

November 2025Paper1B ["SL"] · TZ12(a)[ 1 ]B4.1.3—Abiotic variables affecting distribution
November 2025Paper2 ["SL"] · TZ11(d)(i)[ 2 ]B4.1.3—Abiotic variables affecting distribution
May 2025Paper2 ["SL"] · TZ26(a)[ 2 ]B4.1.3—Abiotic variables affecting distribution
May 2025Paper1A ["SL"] · TZ124[ 1 ]B4.1.3—Abiotic variables affecting distribution
November 2024Paper3 ["SL"] · TZ112(b)[ 2 ]B4.1.3—Abiotic variables affecting distribution

Coverage 2010–2025 · Updated 15 Jul 2026

Abiotic Limits Filter Where a Species Can Persist

Temperature, water, light, salinity, pH, oxygen, minerals and substrate can restrict distribution when they fall outside the range for survival, growth or reproduction.

sample abundance at fixed positions along a transect + measure candidate abiotic variables with calibrated sensors + repeat with equal effort → test whether distribution changes with the gradient

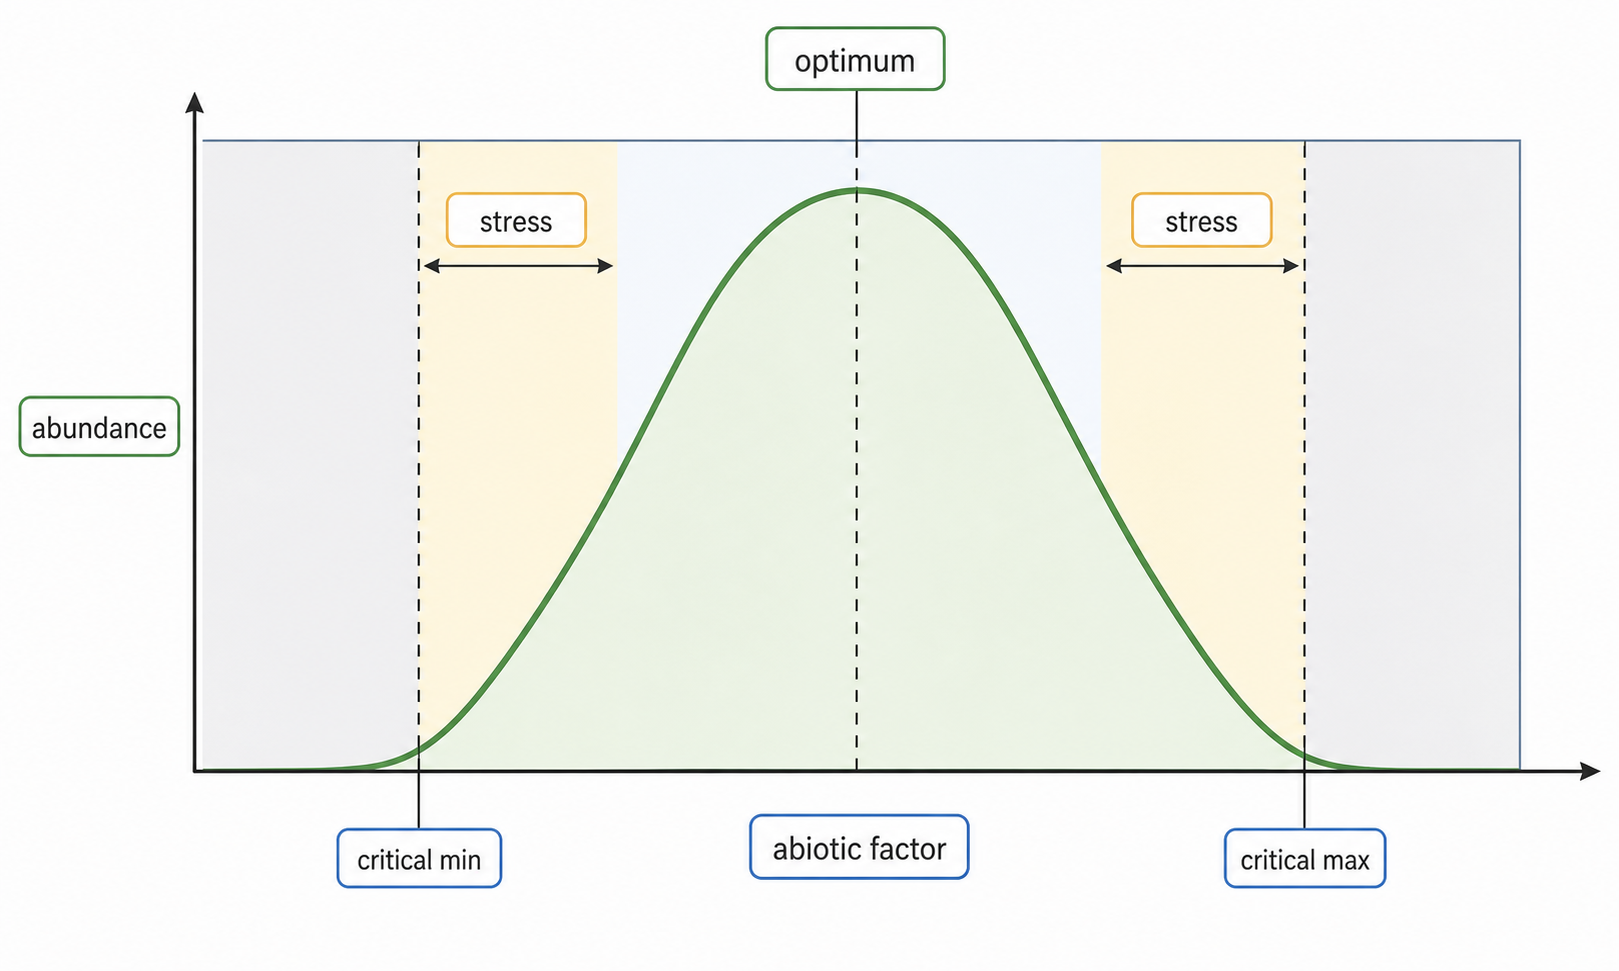
A Tolerance Curve Has an Optimum, Stress Zones and Limits

For one environmental factor, a species has a critical minimum and maximum. Performance is highest near an optimum and declines through zones of physiological stress toward either limit.

Static tolerance curve with abundance on the y-axis and one abiotic factor on the x-axis. Label critical minimum, critical maximum, lower stress zone, optimum zone, upper stress zone, and intolerance beyond both limits.

choose an x-value → locate performance on the curve → classify optimum, stress or intolerance → remember another factor may still prevent the species occurring

Summary: Predict Distribution from Environment and Adaptation

measure environment → locate tolerance limits and optimum → predict possible distribution → test abundance in the field → explain how adaptations change performance

microhabitat: local moisture, light and temperature
species range: interacting tolerance, adaptation and dispersal limits
biome: long-term climate filters whole communities; similar pressures can produce convergent forms

Abiotic variables affecting distribution

[ 4 ]

Discuss how abiotic factors can affect the distribution of species in an ecosystem.

Concept essentials

  • Abiotic factors are non-living conditions that affect organisms.
  • Temperature, water, light, pH, salinity and minerals commonly influence distribution.
  • Transects can correlate species distribution with measured abiotic variables.
  • A factor becomes limiting when deficiency or excess restricts survival, growth or reproduction.