C4.1.8—Modelling sigmoid growth

Modelling sigmoid growth explains how ecological evidence links organisms, resources and interactions to population size, distribution or community structure in a habitat.

Syllabus
First assessment 2025
Objective
C4.1.8
Level
HL

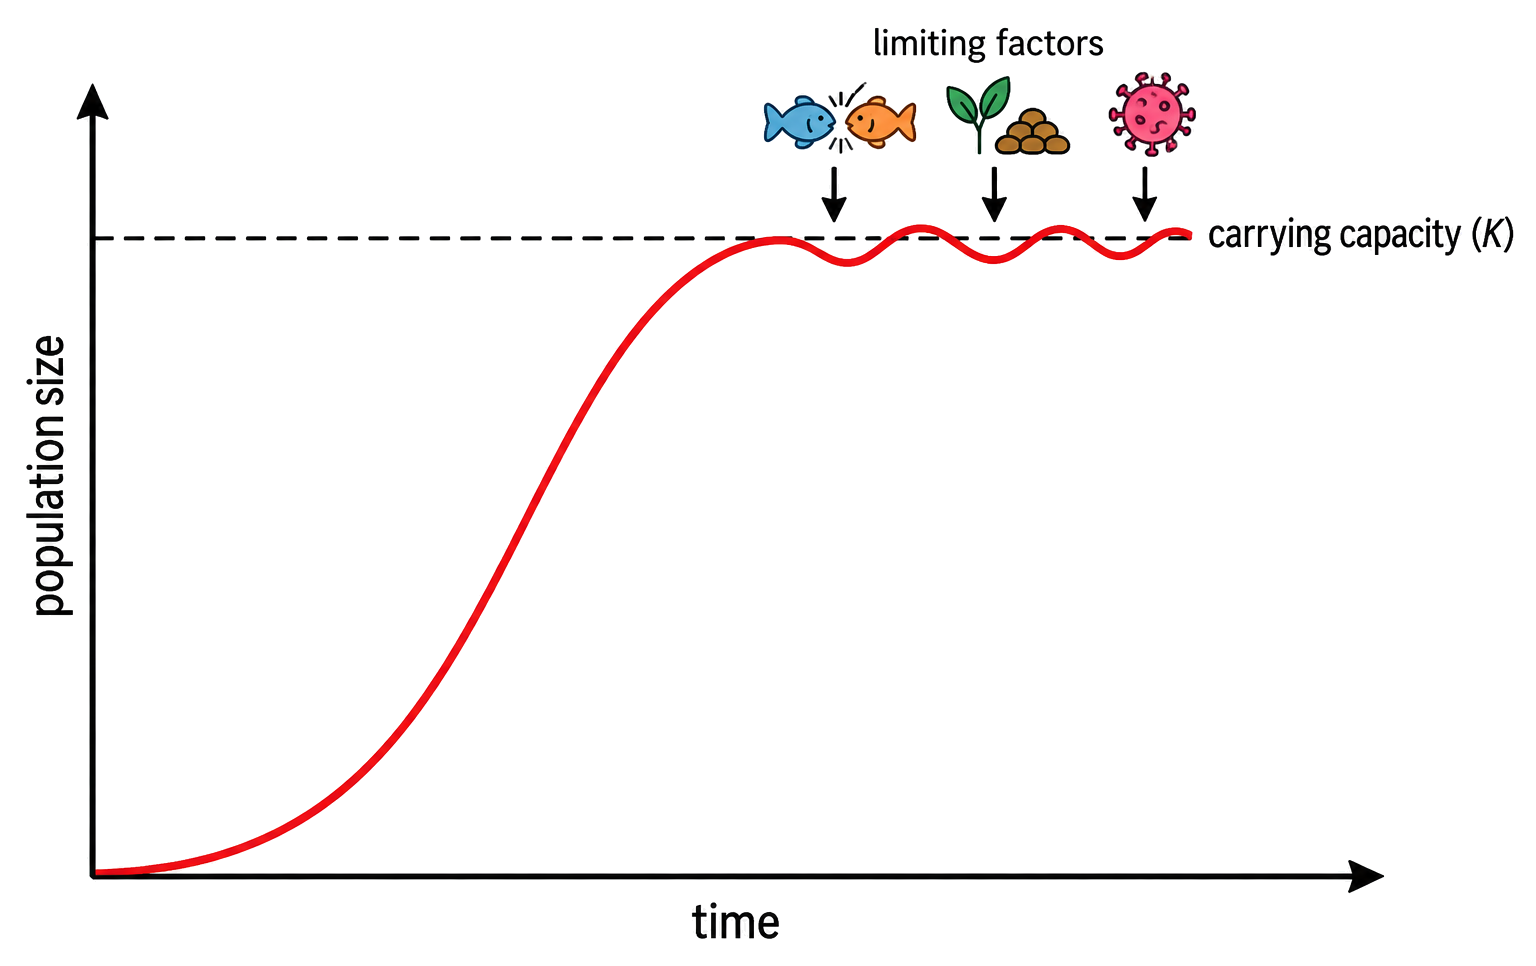
The sigmoid model links growth to carrying capacity

A sigmoid growth model can be tested by repeatedly measuring a population grown under controlled conditions, such as yeast or duckweed.

Start replicate cultures with comparable initial populations, keep temperature, nutrients, volume and light conditions controlled, measure population size at regular intervals, calculate means, and plot population size against time.

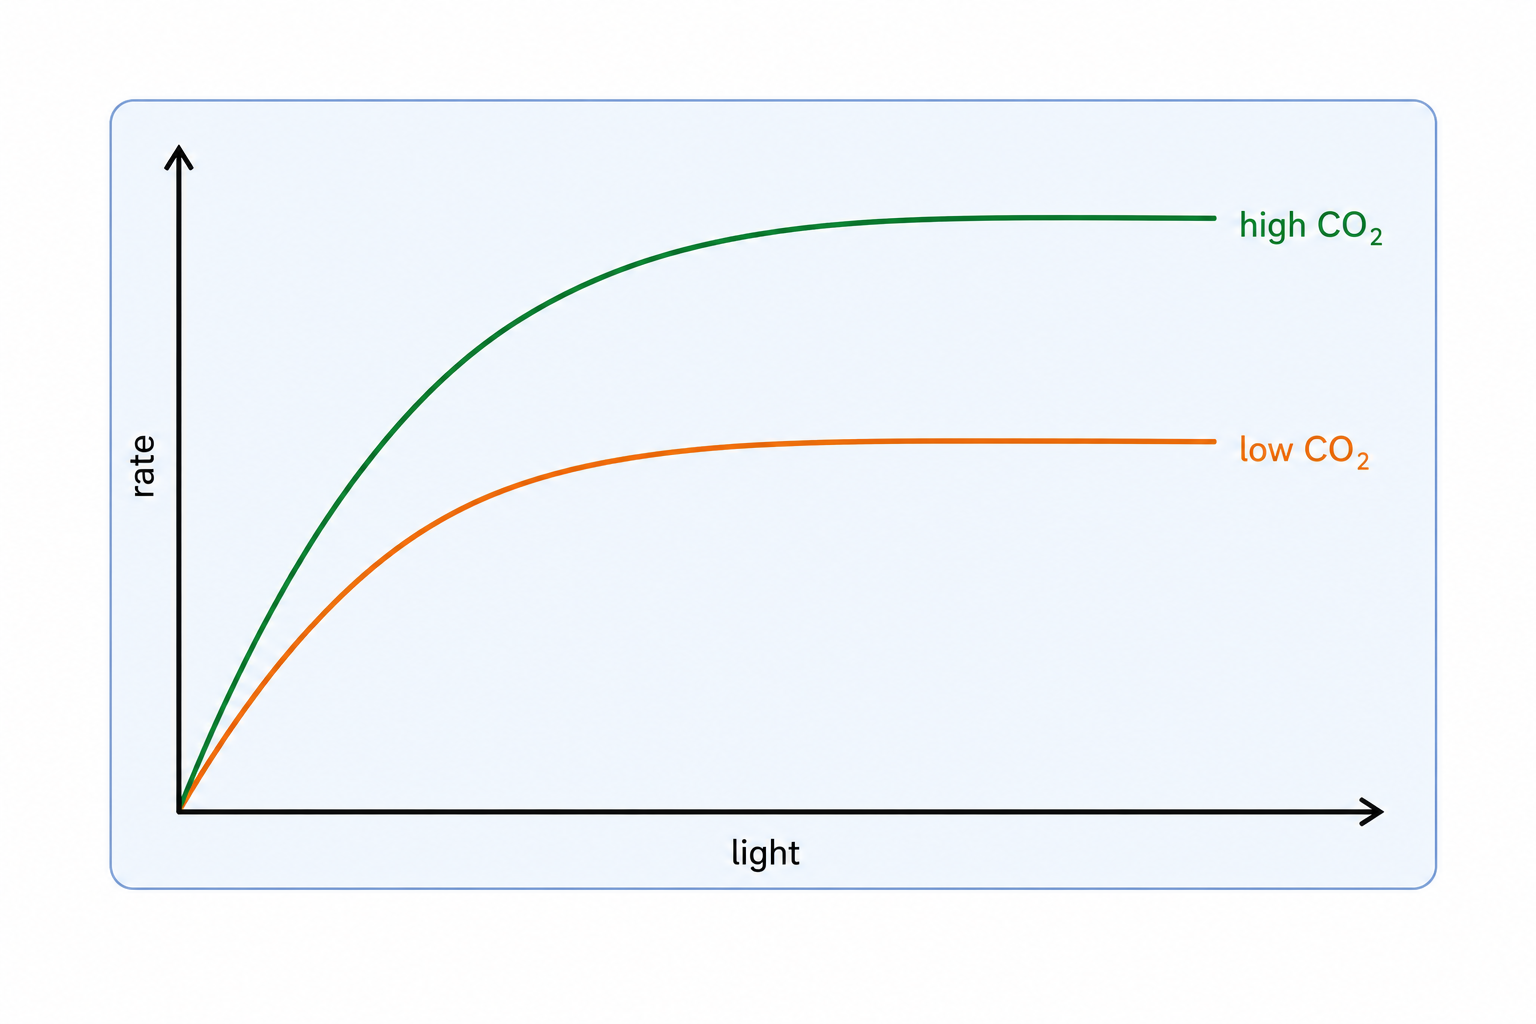
Look for an initially increasing growth rate, a transition as limiting factors intensify, and a plateau near carrying capacity. Compare replicate data with the ideal S-shaped curve and identify deviations.
Duckweed frond number can be counted daily in replicate containers; nutrient depletion, shading and crowding eventually reduce net growth and produce a plateau.
The sigmoid is a model. A plateau may shift if conditions change, and deviations must not be hidden by forcing a fitted curve through poor data.

Populations and Communities

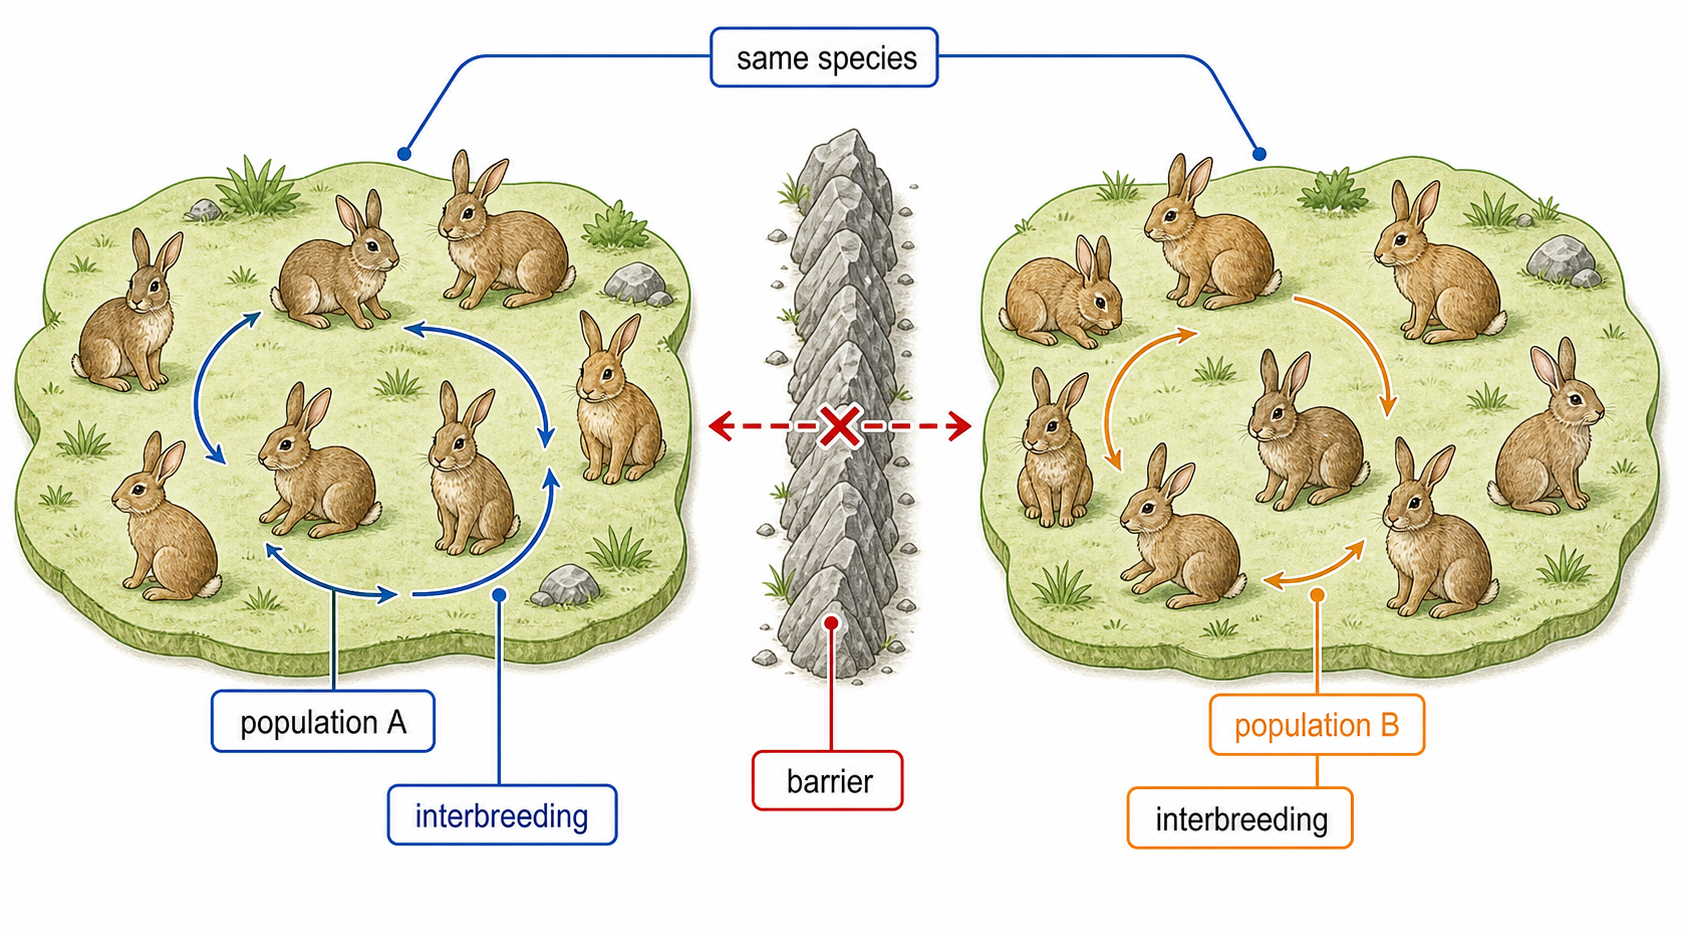
  • A population is one species in an area; a community is all interacting populations there.
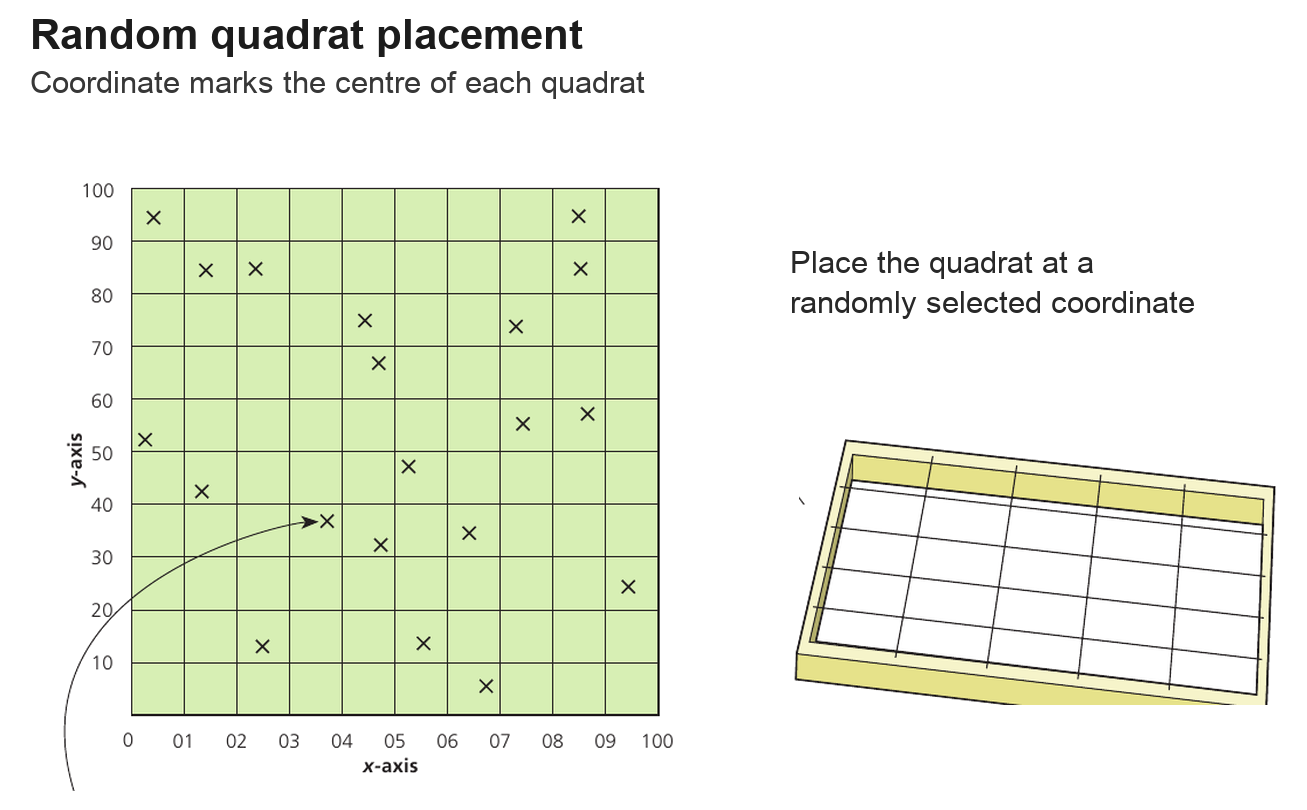
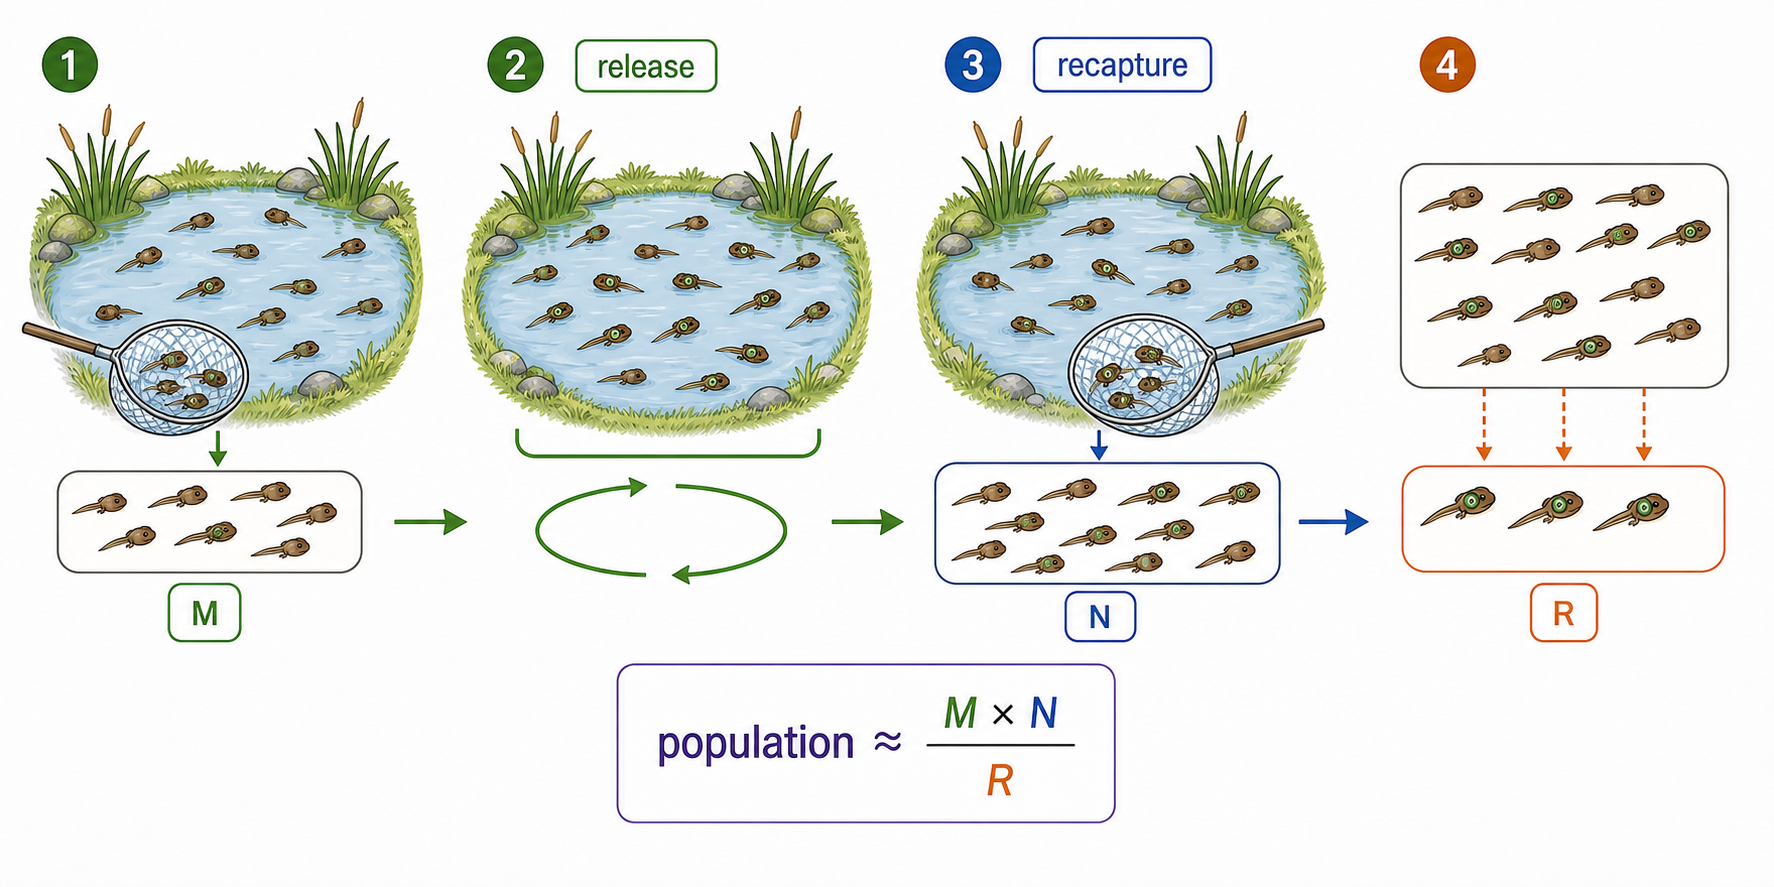
  • Estimate abundance with unbiased sampling: quadrats for sessile organisms and capture–mark–release–recapture for mobile animals, checking each method’s assumptions.
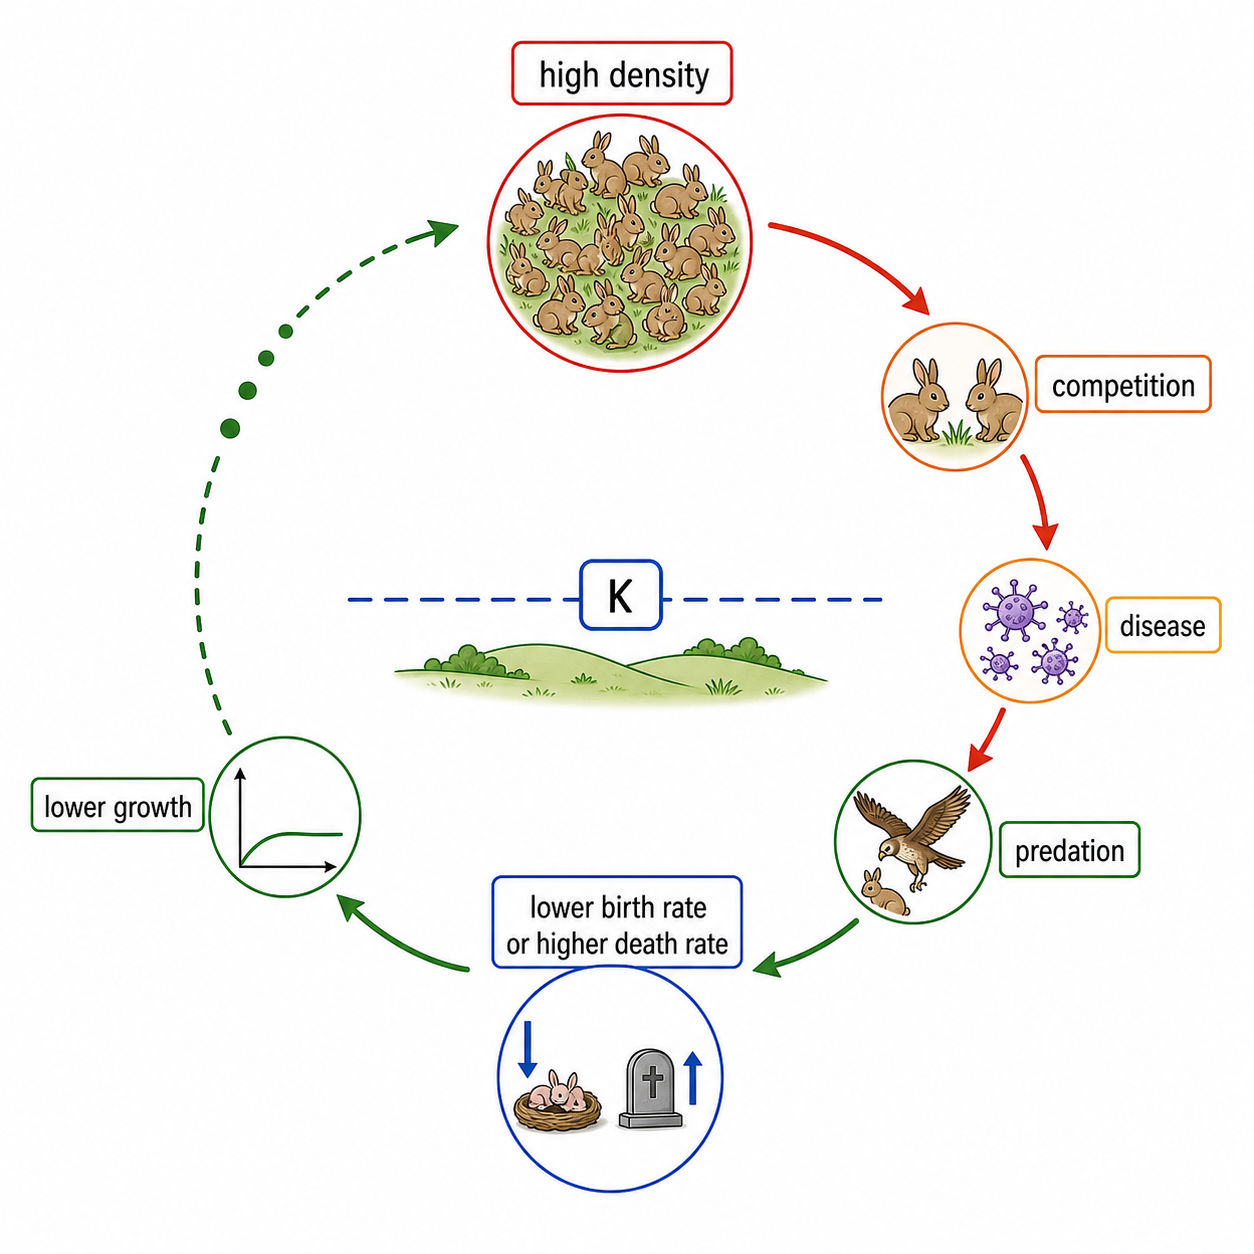
  • Density-dependent competition, predation, disease and waste create negative feedback around carrying capacity; exponential growth slows into a sigmoid curve as limits strengthen.
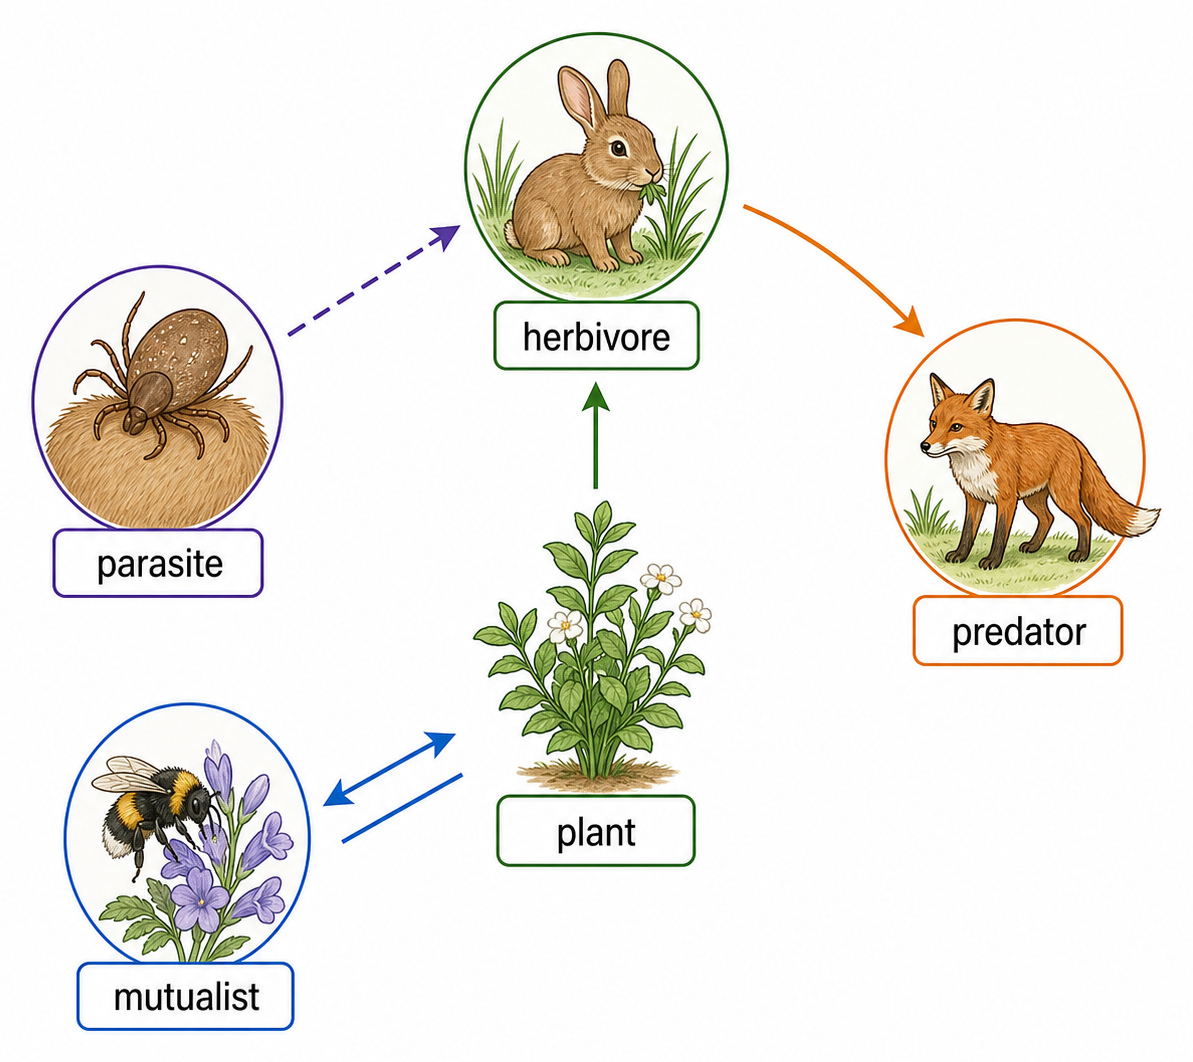
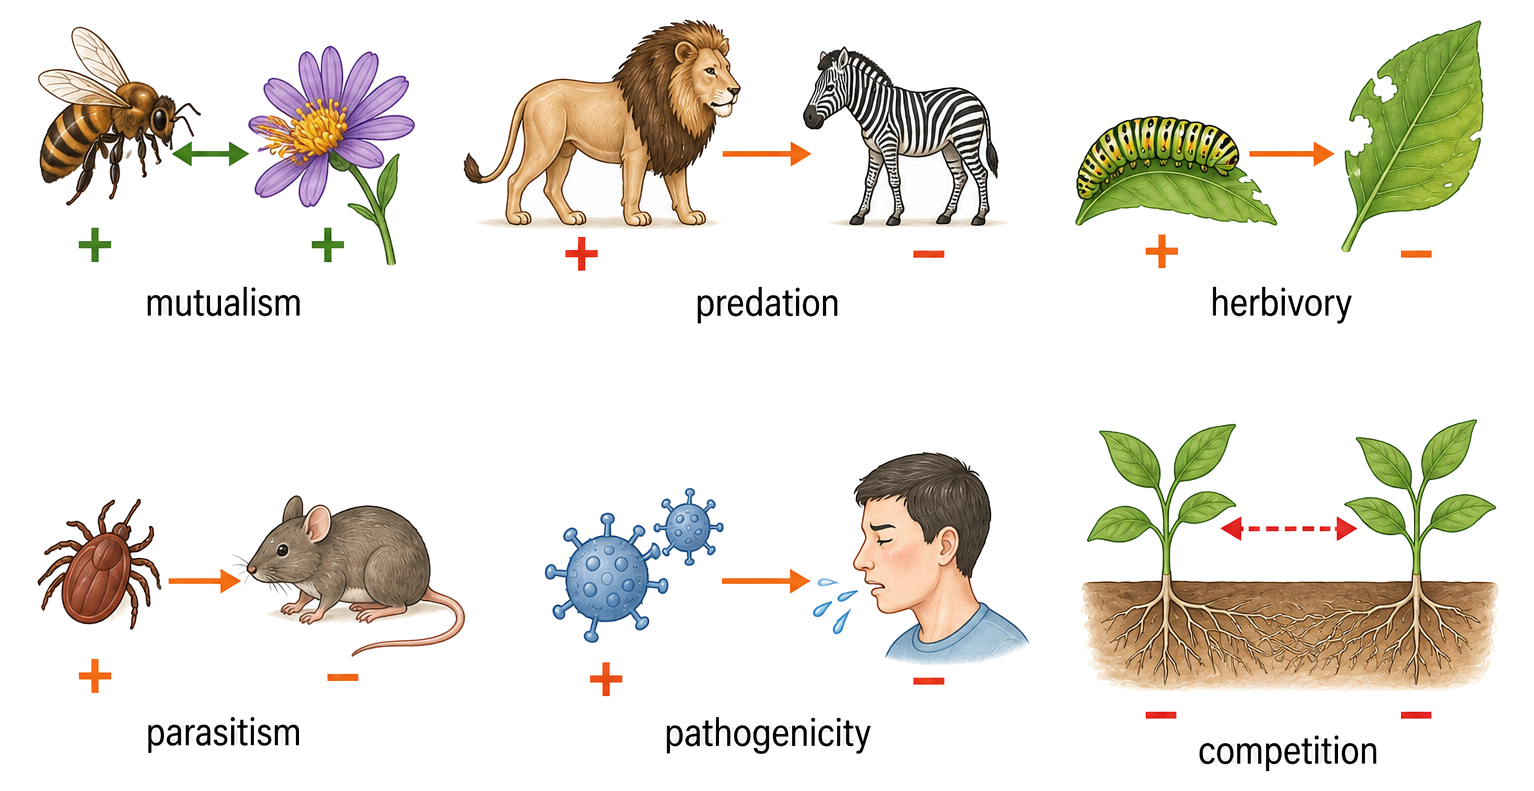
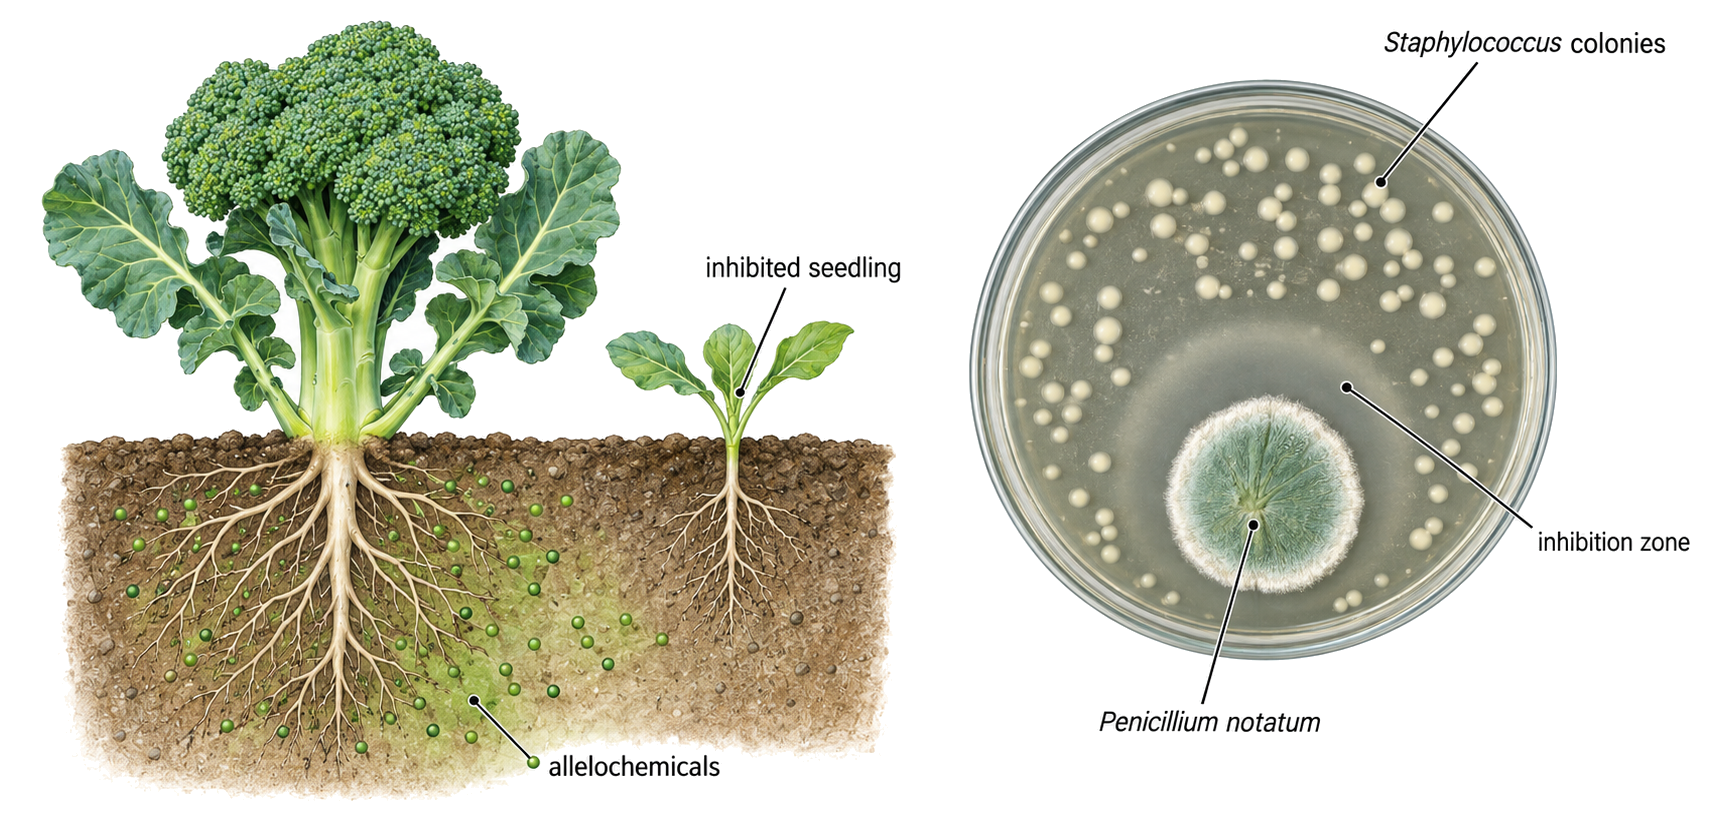
  • Classify interspecific relationships by costs and benefits: predation, herbivory, competition, mutualism, parasitism and pathogenicity.
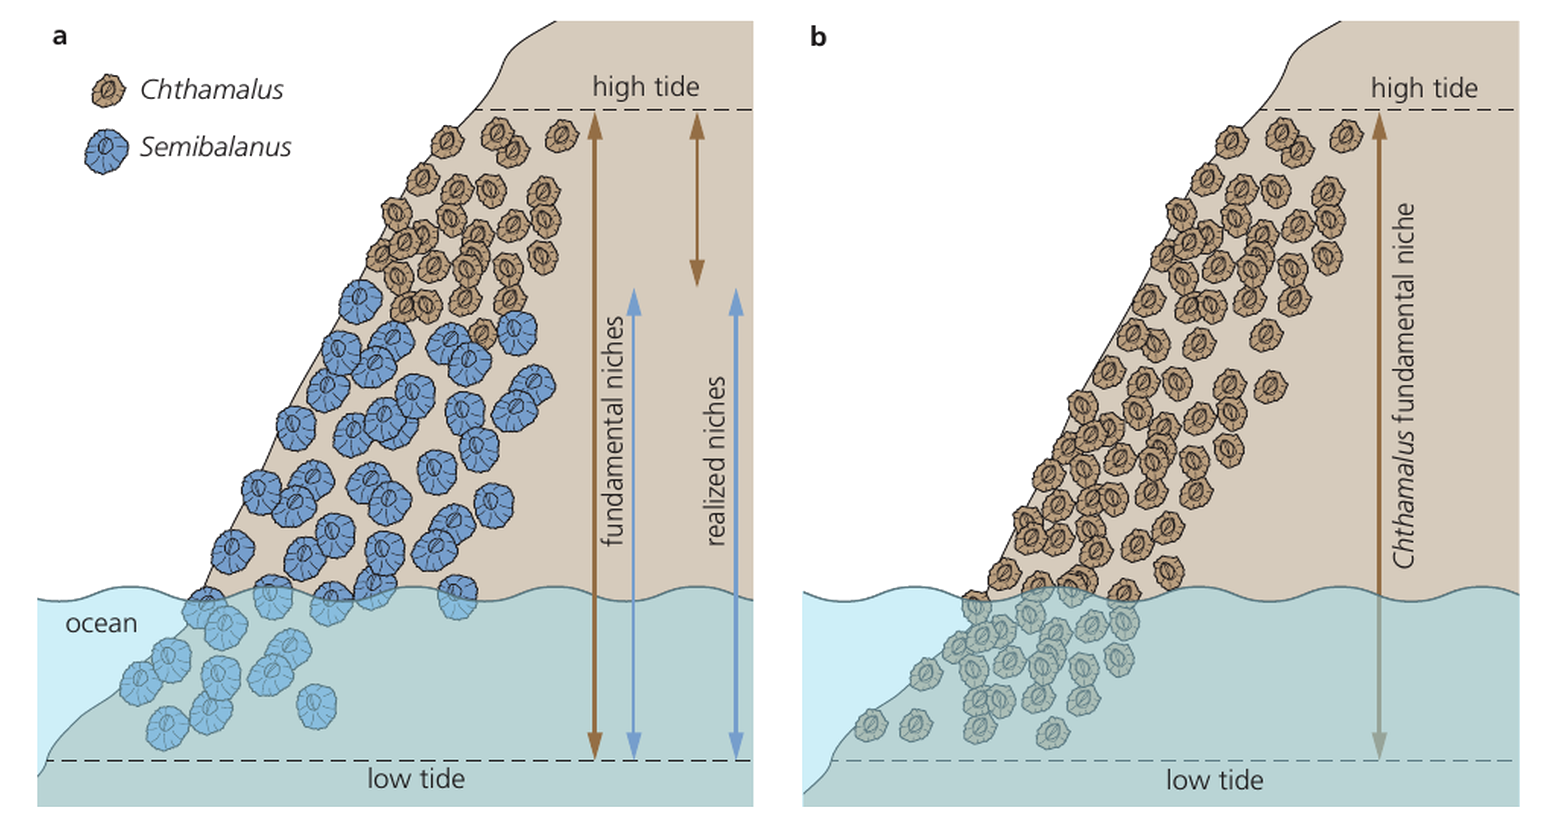
  • Invasive species may escape controls and displace endemic species. Removal experiments can reveal competition and fundamental versus realized niches.
  • Chi-squared tests assess species association from observed and expected quadrat counts.
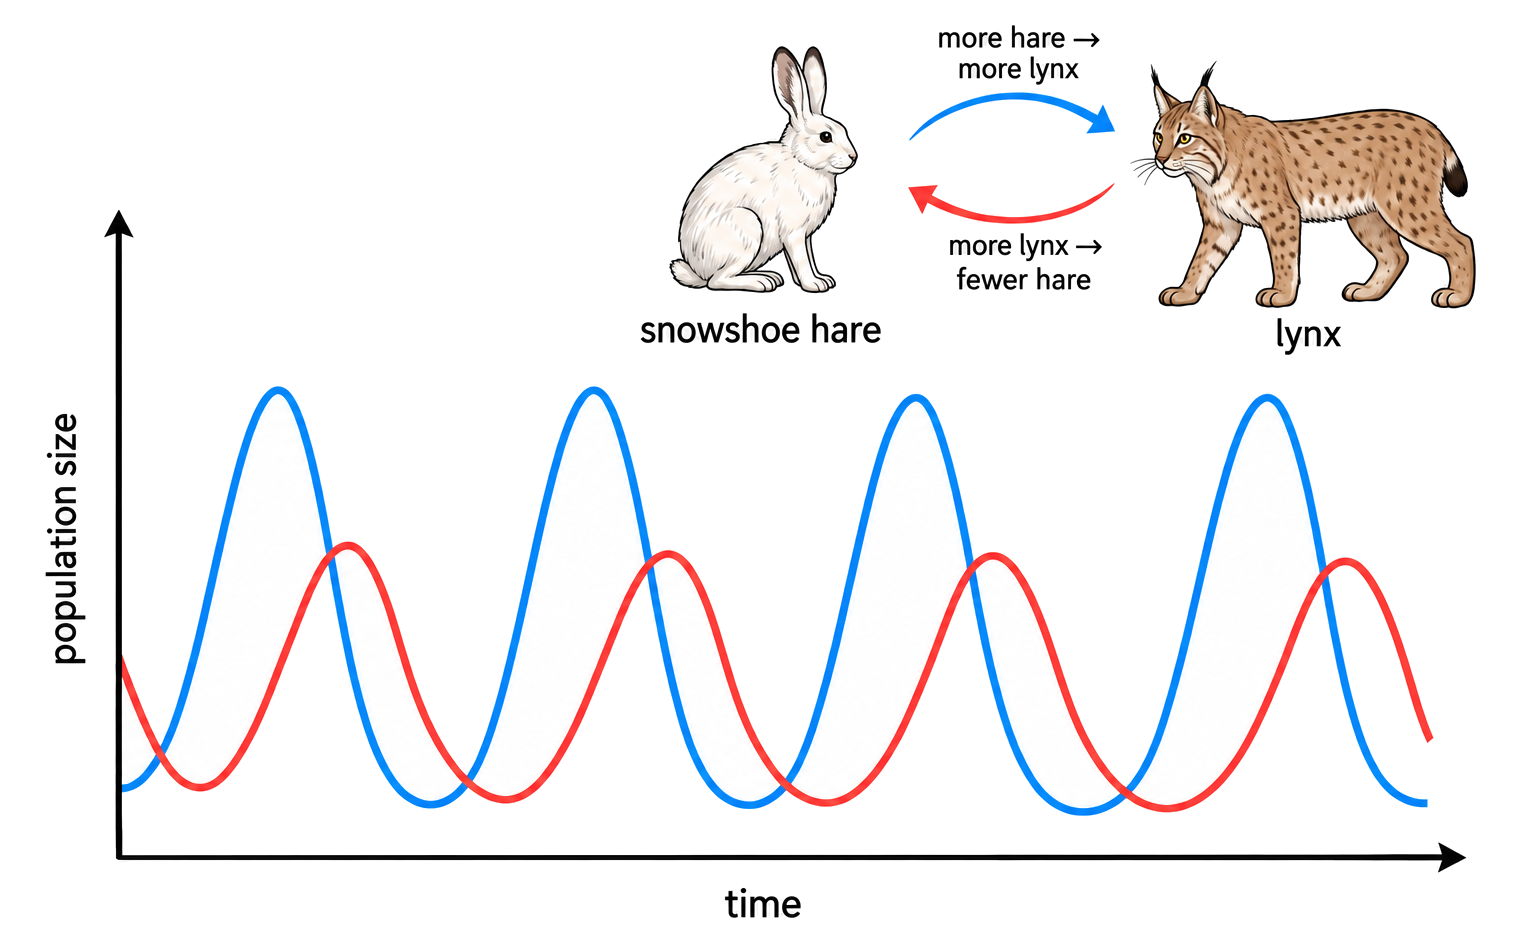
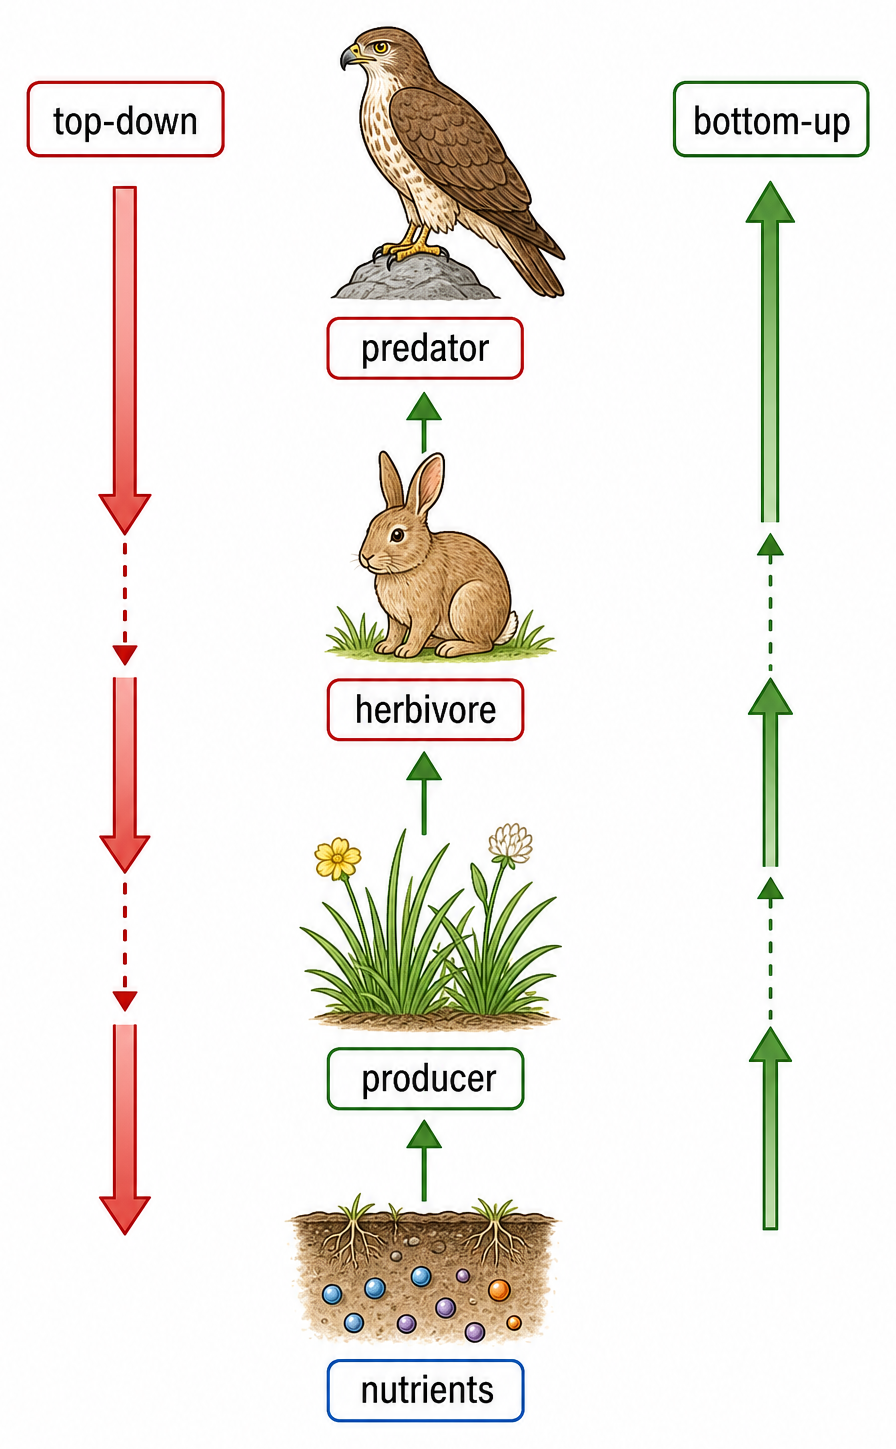
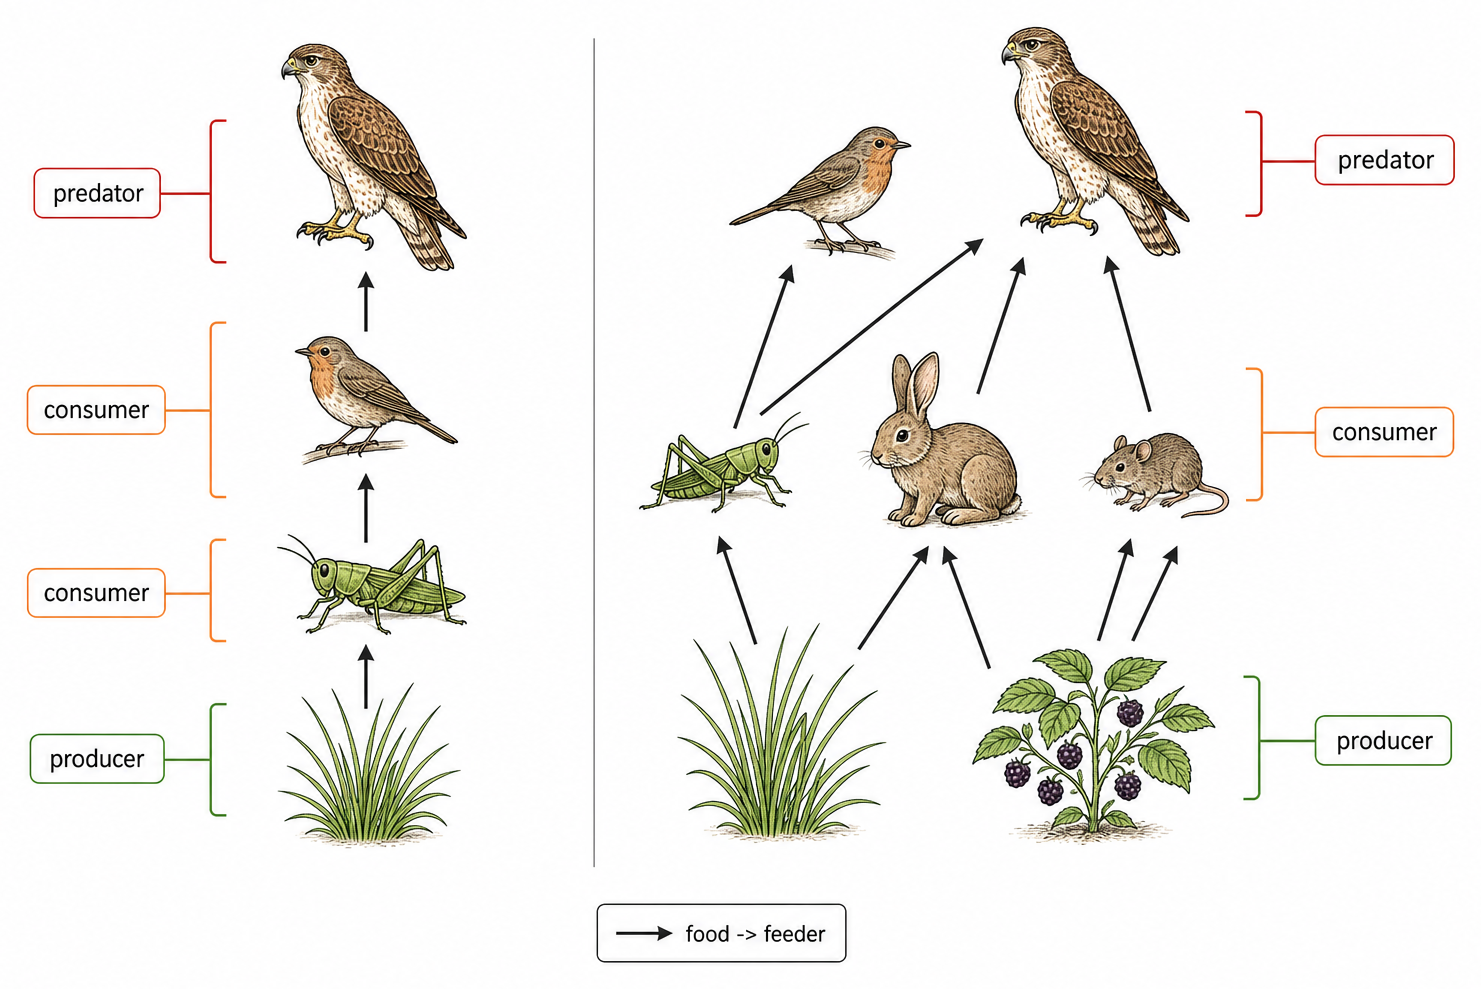
  • Predator peaks usually lag prey peaks; top-down control begins with consumers, while bottom-up control begins with resources or producers.

Concept essentials

  • Modelling sigmoid growth must be linked to the correct ecological unit, method or species interaction.
  • The evidence for modelling sigmoid growth depends on measurable abundance, distribution, survival or resource patterns.
  • Modelling sigmoid growth is clearest when cause, ecological process and population outcome are kept distinct.
  • Field or graph evidence for modelling sigmoid growth needs biological interpretation, not values alone.